
Abstract
Ovarian cancer is the most common cause of death among gynecological malignancies. We discuss different types of clinical and nonclinical features that are used to study and analyze the differences between benign and malignant ovarian tumors. Computer-aided diagnostic (CAD) systems of high accuracy are being developed as an initial test for ovarian tumor classification instead of biopsy, which is the current gold standard diagnostic test. We also discuss different aspects of developing a reliable CAD system for the automated classification of ovarian cancer into benign and malignant types. A brief description of the commonly used classifiers in ultrasound-based CAD systems is also given.
Introduction
Ovarian cancer is the fifth most common cause of cancer death among women (more than 13 000 deaths annually in the United States). 1 One out of 71 women has the risk of developing ovarian cancer as per the surveillance, epidemiology, and end results (SEER) cancer statistics. 2 Tumor (neoplasm) is an abnormal growth of body tissue and can be categorized into benign or malignant. If the tumor metastasizes, adjacent organs are affected, leading to more complications. Figure 1 sketches the typical location and appearance of ovarian cancer compared to a contralateral healthy ovary.

Location of ovarian cancer and comparison to a controlateral healthy ovary. (Reproduced with permission from Global Biomedical Technologies, Inc., Roseville, CA, USA)
About 90% of the ovarian cancers arise from the surface (epithelium) of the ovary, while some originate from fallopian tube. 3 Previous studies found that the principal causes of ovarian cancer are the mutations in genes like breast cancer type 1 susceptibility protein and breast cancer type 2 susceptibility protein, 4 endometriosis, 5 and treatments related to infertility. 6 One or more of the specific symptoms like abdominal pain or discomfort or swelling, back pain, bloating, urinary urgency, constipation, feeling full quickly, and tiredness can be associated with ovarian cancer if it occurs more often with severity. More specific symptoms are pelvic pain, abnormal vaginal bleeding, or involuntary weight loss. 7 –9 The medical treatment, prognosis, and survival rate of the patient depend upon the existing cancer stage of the patient. Ovarian cancer has 4 stages with extent of spread and complications (International Federation Of Gynecology And Obstetrics staging) increasing from stage I to IV. In stage I, cancer cells are found in one or both ovaries or on the surface of the ovaries or in fluid collected from the abdomen. In stage II, cancer cells may also have spread from one or both ovaries to other tissues. The early stages (I and II) of ovarian cancer are difficult to diagnose since the symptoms are vague and nonspecific. 10 If untreated, it advances and spreads further resulting in stages III and IV. In stage III, cancer involves one or both ovaries with microscopically confirmed peritoneal metastasis (less than 2 cm) outside the pelvis or regional metastasis of the lymph nodes. Stage IV is the most critical state in ovarian cancer, where cancer cells spread to tissues outside the peritoneum. Other organs may also be affected. In this cancerous stage, patients have poor prognosis independent of the medical treatment.
The symptoms associated with earlier stages of ovarian cancer are very different and, often, aspecific. The clinical examination usually starts with an objective examination of the patient’s status to detect macroscopical pathological conditions of the pelvis regions (ie, ascites, adnexal masses, and acute abdomen). However, instrumental examination is needed in the presence of suspicious signs. The most common tests to detect ovarian cancer are blood test (to check the level of cancer antigen [CA] 125) and transvaginal ultrasound (US) methods. A brief explanation of the instrumental examinations to detect ovarian cancer is given subsequently.
Cancer Antigen 125 Assay
This test is performed to determine the level of CA-125. Cancer antigen 125 is usually released into the blood by cells, and high CA-125 indicates sign of cancer or other conditions. 11 This test is used to monitor a woman’s response to ovarian cancer treatment and for detecting its return after treatment. However, high CA-125 levels cannot be considered as a sure marker due to the following reasons: this serum CA-125 is found to be elevated only in 50% of stage I cancers. 12 Another constraint with CA-125 is that uterine and pancreatic malignancies and benign conditions like fibroids, endometriosis, pelvic inflammatory disease, and benign ovarian cysts can also raise the level of serum CA-125. 13
Ultrasound
It uses high-frequency sound waves to create high-quality images that will help the doctors to detect the size, shape, and configuration of the ovaries and also to detect malignancies. 11 To have a better view, the probe may be inserted into the vagina (transvaginal US). As an example, Figure 2 shows the typical US images corresponding to benign and malignant ovarian tumors.
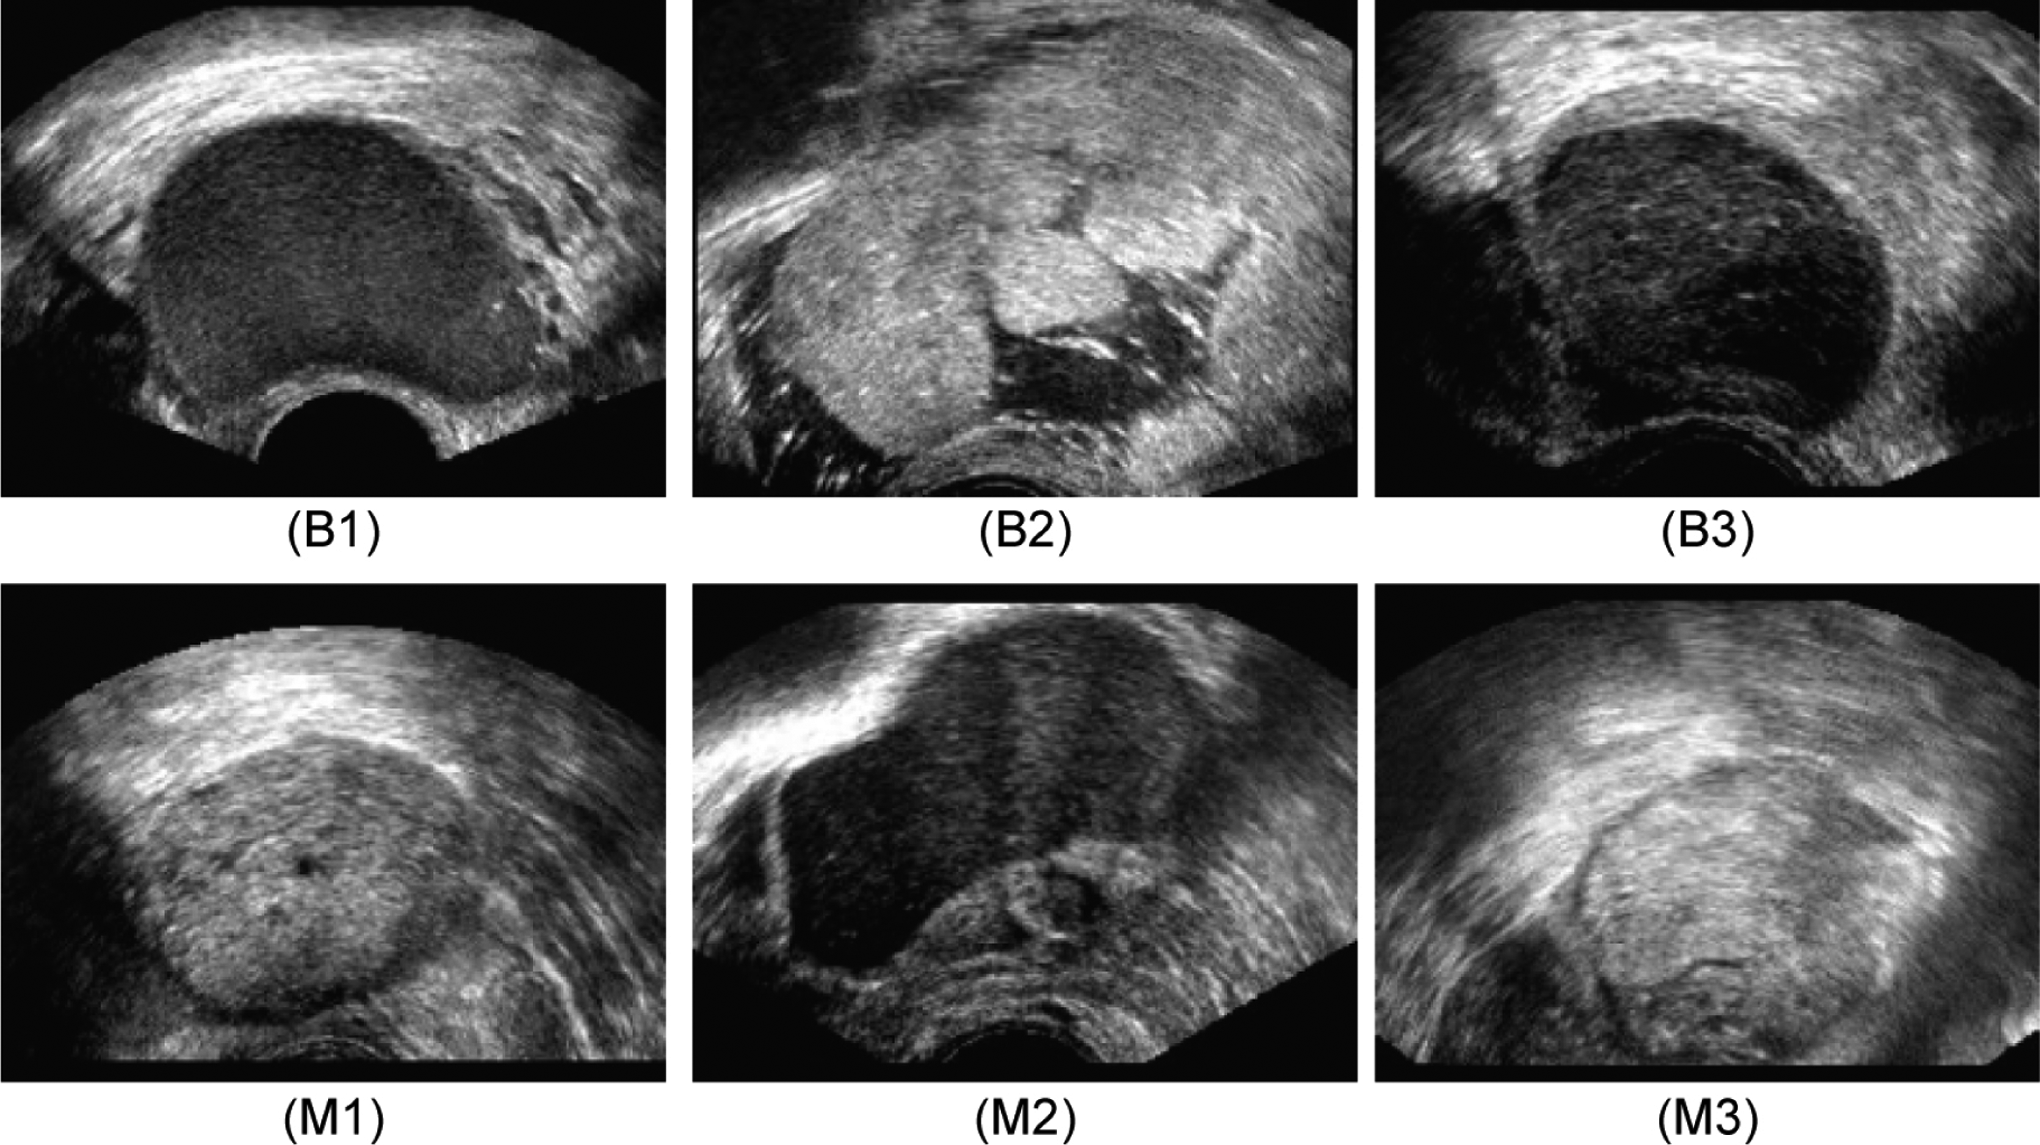
Ultrasound images of the ovary: (B1-B3) benign tumor, (M1-M3) malignant tumor.
Imaging methods like computed tomography scans, magnetic resonance imaging scans, and US studies are used to confirm the presence of the pelvic mass, but they cannot confirm its malignancy aspect. The limitation of imaging methods is that the changes between images corresponding to benign and malignant ovarian tumors are so subtle that even experts are likely to give a wrong interpretation. At present, there is no nonsurgical method, which can accurately detect ovarian cancer in its early stage. The following aspects about ovarian cancer provide motivation for research. For more than 60% of the women, detection of ovarian cancer takes place when the cancer is in stages III or IV. In this advanced stage, the cancer normally would have spread outside the ovaries and generally nothing can be done to save the patient. The average 5-year survival rate for ovarian cancer belonging to all stages is 47%. 14 According to the SEER program fact sheets, the 5-year survival rate is 92.7% if the cancer is confined to the primary site, that is, if cancer is detected when it is in Stage I.
This technical review aims at discussing the US-based techniques that have been proposed for characterizing the ovarian tissue by processing of B-Mode images. The focus on US modality is justified by 2 factors: first, the US examination is usually performed in the diagnostic process, and, second, US is a safe, cheap, and affordable imaging modality. In fact, for benefitting the common people, research is aimed at developing an affordable, harmless, and easily deployable modality that produces very accurate results. Automated CAD system using US images of ovarian tumor 15 –21 have all these desirable features and hence is the focus of this review.
Methods and Materials Used
Serum CA-125 level check is the initial test that is offered to people with suspected ovarian cancer. If CA-125 level is high (typically greater than 65), US examination is recommended. 22 The clinical variables assessed in the diagnosis of ovarian cancer are as follows: age (typically older than 55), menopausal status, undergone hormone treatment, and family history of cancer (mainly first degree relatives). The goal of developing new techniques to build a CAD system is to achieve very high accuracy in detecting early ovarian cancer. The false-positive rate should also be kept very low so as to avoid unnecessary biopsies in people with benign tumor. The attributes of CAD system such as speed, noninvasiveness, affordability, easy deployability, and usability and reliability are especially advantageous if ovarian cancer detection has to be performed on a mass of people. The different steps of CAD techniques are image acquisition, preprocessing, feature extraction, feature selection, classifier development, and classifier validation. 18
Figure 3 depicts the general block diagram of the proposed CAD technique for ovarian cancer detection. The acquired US image database is split into training and test sets. The classifiers are developed using images from the training set and evaluated using the test set. The blocks in the left side of the figure show the steps involved in the off-line training procedure, and the blocks in the right side show the steps involved in the online real-time system. In the off-line training system, features are extracted from the images in the training database, and highly discriminative features are then selected. These features along with the ground truth of whether the training images are benign or malignant are used to train the classifiers. Subsequently, the selected features from the test set image database are input into the trained classifiers to determine the class of the test image (benign/malignant). The predicted class and the actual class of the test image are compared to evaluate the performance accuracy, sensitivity, and specificity of the classifier.

Architecture of proposed computer-aided diagnostic (CAD) system.
Image Acquisition Method and Preprocessing
Pelvic US scan is obtained by moving the probe over the lower abdomen. Better images of the ovary can be obtained using transvaginal US, where a probe is inserted through the vagina to conduct the scan. Two-dimensional (2D) scanning is most commonly used, as the vascularity of the tumor can be captured by 2D power Doppler with proper settings so as to achieve high sensitivity to detect even low-velocity flow. 18 Three-dimensional (3D) techniques can capture the 3Dimages of the ovary, presenting the characteristics of the tumor volume such as thick papillary projections and solid areas in an effective manner. Thus, 3D US, power, and color Doppler can be selectively used in cancer-probable regions where sensitive scan is required. High-quality scanning (a predefined scanning protocol) is generally performed based on 3D transvaginal ultrasonography using Voluson-I (GE Healthcare, Wilmington, USA) or Aloka SSD 680 scanner (Aloka Ltd, Tokyo, Japan). The transvaginal probe works at a typical frequency range of 5 to 12 MHz. The scanned 3D data are stored in a hard disk (common is Sonoview, GE Medical Systems). Depending on the size of the volume box, the volume acquisition time ranges from 2 to 6 seconds. 18 Gray scale as well as color Doppler images can be used to study the morphological features.
Our group has developed a few CAD systems for ovarian cancer detection. 18 –21 In these studies, we evaluated 20 nonconsecutive women with previous diagnosis of ovarian mass (10 malignant, 10 benign; 9 postmenopausal, 11 premenopausal; age: 29-74 years). First B-mode ultrasonography was used to characterize the morphology of the adnexal masses. Subsequently, 2D power Doppler was used to assess tumor vascularization. Power Doppler settings were set to achieve maximum sensitivity for detecting low-velocity flow without noise (frequency, 5 MHz; power Doppler gain, 0.8; dynamic range, 20 to 40 dB; edge, 1; persistence, 2; color map, 5; gate, 2; filter, L1; PRF, 0.6 kHz). Then, 3D transvaginal ultrasonography was carried out using Voluson-I, and 3D volumes of the suspicious areas were acquired. We then chose the middle 100 images from each volume from each patient and created a database that had 1000 benign images and 1000 malignant images. The region of interest (ROI) was then delineated by a gynecologist and radiologist. This ROI from each image was used for the subsequent feature extraction process.
Features Describing Protein Characterization
Mass spectrometry (MS) can be used for protein characterization. Mass spectrometry is an analytical technique that is used to measure the mass to charge ratio of the charged particles. 23 The disadvantage of MS data is its high dimensionality feature set. The high dimensionality necessitates complex classifier design, which makes the CAD system costly as well as computationally intensive causing the system to be slow.
Morphological and Vascular Features
Features like shape, size, solidity, vascularity, and number of cavities present in tumor (unilocular, multilocular, etc) are useful to differentiate benign from cancerous ovarian tumors. 18 –21 These features can be understood by observing US images. Vascularity can be clearly measured by parameters such as pulsatility index, resistance index, time-averaged maximum velocity, presence of diastolic notch, and vessel location. The color content is one of the strong indicators of the vascularity of the tumor. The color Doppler flow is significantly higher for malignant tumors.
Malignancy in ovarian tumor can be associated with morphological features like irregularity, multilocularity, solid component with diameter greater than 100 mm, presence of ascites and papillary structures, and increased blood flow. Features of tumor indicating benignity are smoothness, unilocularity, solid component with maximum diameter less than 7 mm, and absence of blood flow. Morphologic characteristics such as ovarian wall thickness, inner wall structure, and presence of septa and papillaries can help in distinguishing benign and malignant ovarian tumors. Clinicians and medical experts use suitable weighted combination of clinical as well as morphologic parameters to detect ovarian malignancy. 24
Textural (Ultrasonographic) Features
The cytoarchitecture variations and morphological features are reflected as nonlinear changes in texture of US images. These nonlinear changes are captured as suitable texture features that can quantify the changes in the intensity, regularity, coarseness, contrast, homogeneity, and so on of the pixels of the image. Examples of texture descriptors are Local Binary Pattern (LBP), Laws Texture Energy (LTE), entropies, and Hu invariant moments. These features are briefly explained subsequently:
Local binary pattern
Ojala et al 25,26 developed the technique of LBP using which the statistical and structural characteristics of the texture of an image can be obtained. A variety of applications use LBP techniques for texture segmentation 27 and face recognition. 28
Laws texture energy
Laws texture energy is a measure of texture energy based on representation of image features without referring to the frequency domain. The energy within the pass region of filters is estimated by applying texture energy transforms (masks). Laws empirically determined suitable size of masks required to discriminate between different kinds of texture. 29,30
Entropy
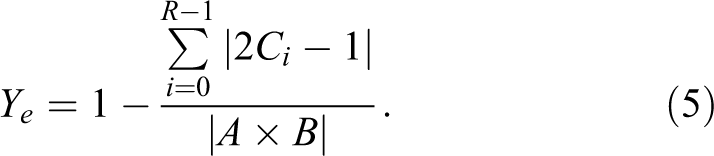
It is a measure of uncertainties in the image. Let f (x, y) be the image with Pi
(i = 0, 1, 2, 3 … R − 1) various gray levels. The normalized histogram for an image of size (A × B) is given by:

Shannon entropy:

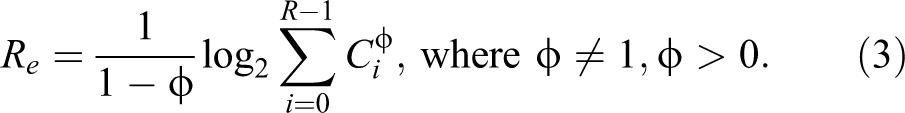
Renyi entropy
31
:

Hu Invariant Moments
These moments are widely used to analyze the patterns. The 2D moment of an image

For r, s = 0, 1, 2 …, the central moment is defined as:

where

For r, s = 0, 1, 2, 3 …, where


Discrete wavelet transform
Discrete wavelet transform (DWT) basically acts as low-pass and high-pass filter. When DWT is applied to an image, 4 different coefficients are obtained. Approximate coefficients of level 1 (A1) are obtained by applying a low-pass filter to both the horizontal row and the vertical columns of pixels. Detailed horizontal coefficients of level 1 (Dh1) are obtained by applying low-pass filter to the horizontal rows of pixels and high-pass filter to the vertical columns of pixels. Detailed vertical coefficients of level 1 (Dv1) are obtained by applying high-pass filter to the horizontal rows of pixels and low-pass filter to the vertical columns of pixels.
33
Finally, detailed diagonal coefficients of level 1 (Dd1) are obtained by applying high-pass filter to both horizontal rows and vertical columns of pixels. Similarly, Dh2, Dv2, Dd2, and A2 are the resultant matrices obtained at second level of 2D DWT. The wavelet basis biorthogonal wavelet 3.7 can be selected to decompose the medical images.
34
The energy values in the various subbands can be used as features for classification of benign and malignant images as given in Equation 16:

Features of Higher Order Spectra
Higher order spectra (HOS) is a nonlinear technique and has high signal to noise ratio (SNR) due to elimination of Gaussian noise which is good for estimation of parameter.
35
It indicates the phase coupling between the frequency components.
36
It also has the ability to differentiate various non-Gaussian signals accurately. First- and second-order statistics will not be able to unearth the hidden subtle variations in the signal. Bispectrum which is the third-order cumulant can be used to extract the nonlinear information present in the signal and is given by:

where X(f) is a discrete Fourier transform (DFT) of x(nT). E[.] is the expected value operator.
Normalizing bispectrum
37
using power spectra will yield bicoherence and is given by:

where P(f) is the power spectra.
Fourier coefficients X (f1 ), X(f2 ), and X (f 1 + f 2) are evaluated in the nonredundant region Ω (Figure 4).
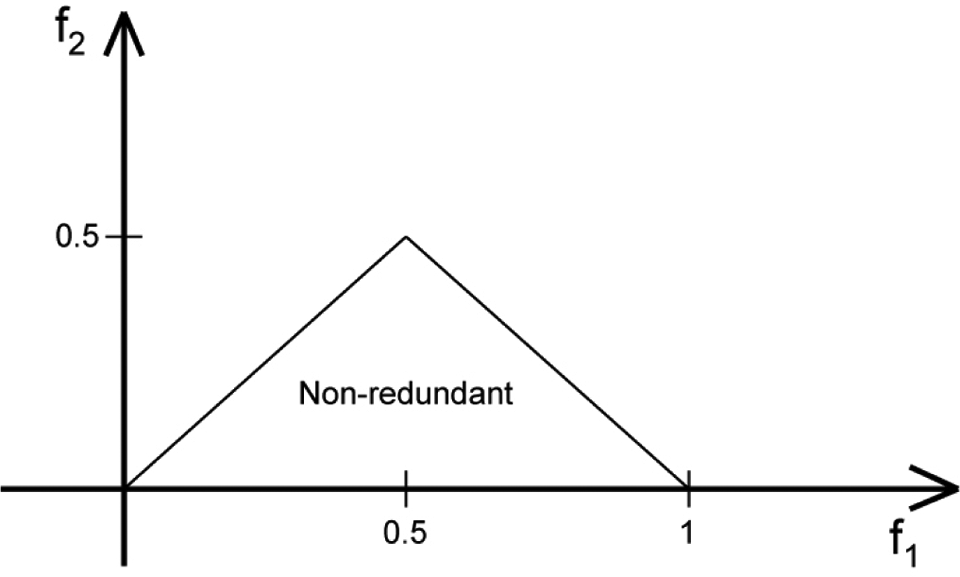
Nonredundant region (principal domain).
The bispectrum phase entropy
38
is calculated as:

where
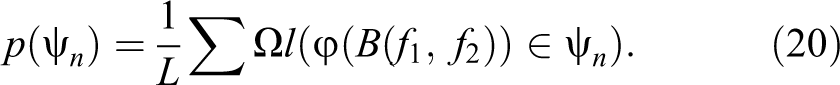
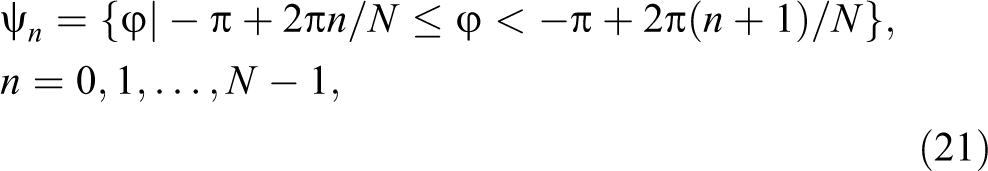
where L is the number of points within the region Ω, φ is the phase angle of the bispectrum, and l(.) is an indicator function that gives a value of 1 when the phase angle is within the range depicted by ψn in Equation 21.
Normalized bispectral entropy (Ent1):

Normalized bispectral squared entropy (Ent2):

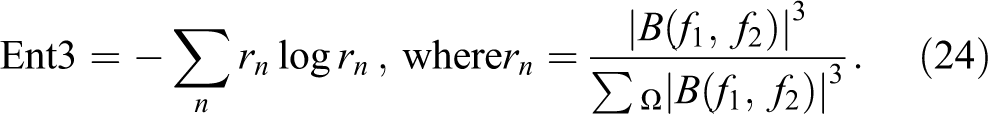
Normalized bispectral cubed entropy (Ent3):
Bispectrum phase entropy (EntPh):

where
Mean bispectrum magnitude (mAmp):

where B (f 1, f 2) is the bispectrum of the signal.
L: Number of points within the samples in Figure 4. Weighted center of bispectrum (wc
1 − wc):

Moments of bispectrum (H 1 − H 3)
The summation of the logarithmic amplitudes of H1 bispectrum is equated as:

The summation of the logarithmic amplitudes of the diagonal elements in the H2 bispectrum is equated as:

The first-order spectral moment of amplitudes of diagonal elements of the bispectrum H3 is equated as:

All the above-mentioned features are again defined over the principal domain Ω in Figure 4. If the feature analysis of US images by CAD methods of high reliability indicates malignancy of ovarian tumor, then the physicists can resort to the final confirmation test of biopsy. A sample of tissue of fluid from the cancer-suspected area is removed and studied under microscope to observe its cytoarchitecture. The cytoarchitecture of malignant and benign tumors is significantly different. Biopsy and histopathologic analysis can not only confirm the results of US image analysis but can also determine the grade of the cancer cells and ovarian cancer stage if cancer is detected. Grade tells about the abnormality level of the cancer cells while stage tells about the extent of spread of the cancer to the other parts.
Feature Selection
Student t test can be used to find the significance of the extracted features by calculating the P value. The P value indicates whether the means of 2 groups or classes (in this case, the benign and malignant classes) are statistically different. The lower the P value is, the more statistically significant the feature is. This tool is especially useful to cut down the high-dimensional feature set into significant low-dimensional feature set. Depending on the number of features that are needed, the required cutoff lower bound P value can be adjusted.
Data Resampling (k-Fold Stratified Cross-Validation)
This technique is used to evaluate the classifier using the selected features. Here, the data set (comprised of selected features) is randomly split into k parts with each part containing the same ratio of samples from both classes. In the first iteration, (k − 1) parts of data are used to train the classifier, and the remaining one part is used for testing. The iteration is repeated (k − 1) times using a different test set (with the remaining sets as training sets) each time. This procedure is used to develop a robust classifier system even with a small data set.
Benign Versus Malignant Classification
The statistically significant features extracted from the ovarian tumor US images are given as input to the classifiers. For developing the 2-class automated detection system, initially the classifiers are trained to distinguish between the features corresponding to benign and malignant ovarian tumors. In the off-line training phase (Figure 3), the classifier is fed with the values of the selected features of each class as input and the corresponding class label (the ground truth of whether the fed US image belongs to benign or malignant category) as output. This training process is for the classifier to understand the relationship between the input data and the output class label and also to obtain the classifier parameters. In the online system, the significant features extracted from the input image that is to be classified are fed to the trained classifier. The classifier then performs classification of ovarian tumors into benign and malignant in real time. Classifiers like decision tree (DT), fuzzy Sugeno, k-nearest neighbor (KNN), probabilistic neural network (PNN), and support vector machine (SVM) are commonly used in the automated detection of ovarian cancerous tumors. They are briefly explained subsequently.
Decision tree
It detects various classes from a given data by simulating a tree and a series of rules, which can be used to identify the test data to represent the model. 39 The decision nodes of the DT move downward from the root node. At each decision node, attribute is tested with each outcome yielding in a branch. They (branches) may terminate at another decision node or end at a leaf node.
Fuzzy Sugeno
It divides a pattern space into several subspaces. If–then-type rule depicts the relationships between the target patterns and their corresponding classes for each subspace. It classifies the unknown patterns using fuzzy inference and rejects pattern of unknown class, which are not considered by training. Nonlinear classification boundary can be easily implemented using this classifier. 39
k-Nearest neighbor
It is one of the simple classifiers, which determines the k-nearest neighbors using the minimum distance from the query instance to the learning samples. New test class can be predicted using these k-nearest neighbors. 39
Probabilistic neural network
It uses 4 layers to implement kernel discriminant analysis. 40 Inputs (features) are fed from the input layer into a hidden layer for computation of the Euclidean distance of the unknown data from the center point of the hidden neuron. In the hidden layer, Radial Basis Function (RBF) kernel functions using sigma values are computed on the Euclidean distance to get the weighted vote, which is fed to the pattern layer. In the pattern layer, a pattern neuron for each class is stored, and each weighted vote is added to the corresponding neuron from the hidden layer. The largest votes are used to detect the unknown class by comparing the weighted votes for each class stored in the pattern layer in the final layer. 41
Support Vector Machine
It has good generalization properties, can be easily trained, and performs well on nonlinear data. 42,43 It performs well with many features and also with less number of training samples. It looks for the hyperplane as a decision surface which separates the 2 classes with maximum margin. Hence, the separating hyperplane will be oriented perpendicular to the shortest line separating the convex hulls of the training features for each class, and it will be located midway along this line. In order to classify the nonlinear data, kernels can be used to map the input data to a high-dimensional space. 44 –46 Linear kernel, polynomial kernel of order 1, 2, and 3, and the RBF kernel are commonly used.
Clinical Validation of Classification
Classifier performance measures such as sensitivity, specificity, accuracy, and positive predictive value (PPV) can be calculated for different classifiers to understand their classification efficiency. The classifiers that have higher value for these parameters have higher capability and reliability in detecting the nature of the ovarian tumor. The CAD systems using such classifiers can serve as reliable adjunct techniques to physicians.
Discussion
Summary of studies that presented various CAD techniques for ovarian tumor classification is listed in Table 1. Standardized blood test data were used for classification of benign cysts and malignant conditions. 47 Multilayer perceptron network was used for classification, and it was found that the technique could distinguish between early- and late-stage cancers with an accuracy of up to 92.9%. In another study, hybrid random subspace fusion scheme that constructs a set of different fuzzy classifiers utilizing different subsets of both the feature space and the sample domain, combining the results of these classifiers using appropriate decision functions, was used. 48 Experimental results using 2 protein mass spectra data sets of ovarian cancer demonstrated an accuracy of 100% (data set 1) and 86.36% (data set 2) using this approach.
Summary of Studies That Presented Various CAD Techniques for Classification of Ovarian Tumor.

Abbreviation: CAD, computer-aided diagnostic.
DNA microarray and proteomics data were analyzed using complementary learning fuzzy neural network (CLFNN). 49 The combination of CLFNN-microarray, CLFNN blood test, and CLFNN proteomics demonstrated 84.72% of classification accuracy. A novel approach to feature extraction from MS data of ovarian cancer was proposed. 50 The proteomic MS data after preprocessing were wrapped into information images that were accordingly mapped to binary images using adaptive threshold. The energy curves of binary images were the result of dimensionality reduction that makeup the alternative biomarker patterns that were used to classify cancer samples. A sensitivity of 98%, a specificity of 95%, and a PPV of 95.15% were reported.
A novel approach for dimensionality reduction was proposed and tested using high-resolution surface-enhanced laser desorption/ionization time-of-flight data published for ovarian cancer. 51 Four statistical moments (mean, variance, skewness, and kurtosis) were used to reduce feature dimensions. In order to improve efficiency and classification performance, the data were further used in kernel partial least square models. The proposed method achieved average sensitivity of 99.50%, specificity of 99.16%, and accuracy of 99.35%. In another study, a bioinformatics tool was developed and used to identify proteomic patterns in serum that distinguish neoplastic from nonneoplastic disease within the ovary. 52 Proteomic spectra were generated by mass spectroscopy (surface-enhanced laser desorption and ionization). The method yielded a sensitivity of 100% (95% confidence interval 93-100), specificity of 95% (87-99), and PPV of 94% (84-99) in distinguishing neoplastic from nonneoplastic disease within the ovary.
A neural network algorithm to compute the probability of malignancy score for preoperative discrimination between malignant and benign adnexal tumors was proposed. 53 Input to the artificial neural network include age, menopausal status, maximum tumor diameter, tumor volume, locularity, the presence of papillary projections, the presence of random echogenicity, the presence of detectable blood flow velocity waveforms, the peak systolic velocity, time-averaged maximum velocity, the pulsatility index, and resistance index. The sensitivity and specificity at the optimum diagnostic decision value for the artificial neural network output were 100% and 98.1%, respectively. A case-based approach called ADNEXPERT used histopathologic and sonographic data from 2290 to diagnose adnexal tumors. 54 Fifteen questions are posed after the US examination. ADNEXPERT assesses the adnexal tumor pathology and makes a histological classification. It was able to accurately assess the pathology with an accuracy of 71% correctly.
The performance of artificial neural networks and the multiple logistic regression (MLR) models for predicting ovarian malignancy was compared in patients with adnexal masses using transvaginal B-mode and color Doppler flow ultrasonography. 55 During testing, 3-layer, back-propagation networks, based on the same input variables selected by using MLR (women's ages, papillary projections, random echogenicity, peak systolic velocity, and resistance index), had a significantly higher sensitivity than did MLR (96% vs 84%; McNemar test, P = .04).
An automatic technique for quantitative analysis and malignancy detection of ovarian masses using B-scan US images based on morphologic analysis of the ovarian mass was presented. 56 The method involves 2 steps: (1) classification of the mass (into one of the 3 major tumor types: cyst, semisolid, and solid) and (2) detailed analysis of the mass. Then, the malignancy evaluation was performed based on the collected data and the criteria provided by commonly used scoring systems. This method was able to detect the cancer stages automatically with an accuracy of 70%. An innovative CAD technology that quantifies characteristic features of backscattered US and theoretically allows transvaginal sonography (TVS) to discriminate benign from malignant adnexal masses was proposed. 57 This method correctly identified 138 of 141 malignant lesions and 206 of 234 nonmalignant tissues (98% sensitivity and 88% specificity) with an accuracy of 91.73%.
Our group proposed a CAD technique 18 to classify benign and malignant ovarian tumors using LBPs and LTE features in an SVM classifier. We obtained an average accuracy of 99.9%, sensitivity of 100%, and specificity of 99.8%. In another study, 19 we extracted Hu invariant moments, Gabor wavelet features, and entropies from the US images and used them for classification. Using the PNN classifier, we were able to achieve an average accuracy of 99.8%, sensitivity of 99.9%, and specificity of 99.6%. In another similar study, 20 we used HOS and texture features in a decision tree classifier and recorded an average accuracy of 97%, sensitivity of 94.3%, and specificity of 99.7%. In our most recent study, 21 using 11 significant features based on first-order statistics, Gray Level Co-occurrence Matrix, and run length matrix in KNN/PNN classifiers, we were able to achieve 100% classification accuracy, sensitivity, specificity, and PPV in detecting ovarian tumor.
It can be seen from Table 1 that the CAD tool, which used texture features in the KNN/PNN classifiers was the most efficient in predicting ovarian tumor (with 100% accuracy). Thus, we feel that a decision support system built with clinically significant features and robust classifiers can outperform other invasive methods. In addition to this, an integrated index using the extracted features can be formulated and used to distinguish the 2 classes using just 1 number. 18
One of the drawbacks of the technique listed in Table 1 is that to extract the information contained in the texture parameters, a mathematical processing is needed. This is a complication of the diagnostic procedure, because texture features require algorithms for their interpretation. Also, if classification is needed (for instance for the differential diagnosis of benign and malignant lesions), usually a reference data set must be available. Nevertheless, it can be seen that a great effort has been made by researchers to make the CAD systems as user friendly and automated as possible.
Conclusion
Ultrasound imaging is a noninvasive technique to visualize the benign and malignant nodules. However, the outcome of this test is subjective due to interobserver variability. In this article, we reviewed computer-aided diagnosis systems that were developed to predict ovarian cancer using features extracted from US images. We briefly explained various features that can be extracted to train the classifiers for the automated diagnosis of cancer and also described several published CAD techniques for ovarian cancer detection. The preliminary results show that such CAD systems can be used as a reliable adjunct technique for ovarian cancer diagnosis. However, the classification accuracy of the CAD system should be improved and/or evaluated with huge database, better features, and classifiers before these systems can be routinely used in clinical settings.
Footnotes
Abbreviations
Declaration of Conflicting Interests
The author(s) declared no potential conflicts of interest with respect to the research, authorship, and/or publication of this article.
Funding
The author(s) received no financial support for the research, authorship, and/or publication of this article.