
Abstract
Introduction
Owing to the limitation in the field size of the magnetic resonance (MR)-Linac, currently, tumors with a length of >20 cm cannot be treated. Thus, the present study aimed to develop an expanded magnetic resonance imaging-guided adaptive radiotherapy (MRIgART) workflow for long, continuous planning target volumes (PTVs).
Methods
The PTVs were divided into two sub_target volumes (PTV_sub1 and PTV_sub2). We established two isocenters and defined a field overlap region. By adjusting the MR scan range, devising the online and offline adaptive procedures, synchronizing the online adaptive processes, and constructing a pretreatment dose evaluation, a new MRIgART workflow for long PTVs was established. The new workflow was validated using an in-house-made MR phantom. Additionally, the ArcherQA Monte Carlo-based method, ArcCHECK phantom, and ionization chamber measurement method were used for dose verification.
Results
Two clinical scenarios were established: (1) both PTV_sub1 and PTV_sub2 followed the adapt-to-position (ATP) workflow, and (2) PTV_sub1 followed the adapt-to-shape (ATS) workflow, whereas PTV_sub2 followed the ATP workflow. The feasibility of the proposed MRIgART workflow for long, continuous PTVs was demonstrated through three independent rounds of testing and validation for each scenario. When field overlaps were utilized, the PTV length that can be treated is 40 cm minus the length of field overlap region. The average gamma pass rates for the PTV_sub1 and PTV_sub2 adaptive plans were 95.74% and 98.63%, respectively (ArcherQA vs TPS). For the field overlap region, the average gamma pass rate was 95.50% (ArcCHECK vs TPS). The difference between the ionization chamber measurements and calculated results was smaller than 2%.
Conclusion
This study demonstrated the feasibility, safety, and accuracy of the MRIgART workflow for long PTVs. This workflow provides an effective solution for expanding the application of MRIgART to patients with long, continuous PTVs.
Keywords
Introduction
Magnetic resonance imaging (MRI)-guided adaptive radiotherapy (MRIgART) has many advantages. MRI offers superior soft tissue contrast,1–3 enhancing the accuracy of delineating gross target volumes and organs at risk (OARs).4–6 MRIgART integrates real-time magnetic resonance (MR) imaging during treatment, allowing visualization of the tumors and surrounding tissues. 2 It also allows for daily ART based on the patients’ on-the-day image.7,8
However, the current MR-Linac systems, such as the Elekta Unity (Elekta, Stockholm, Sweden), have a maximum field size of 22 cm in the superior–inferior direction, limiting the length of the planning target volume (PTV) that can be treated in patients. 9 Furthermore, to accommodate the anatomical changes and setup errors during online plan adaptation, a 1-cm setup/field margin is commonly recommended for patients with cervix cancer, based on Chuter et al's study findings.10,11 If positioning errors or target deformations exceed 1 cm, part of the target may fall outside the treatment field, making plan optimization infeasible. Consequently, MRIgART can effectively treat the PTV of up to 20 cm in length along the superior–inferior axis. However, certain patient populations, those with extended PTVs, were unable to benefit from MRIgART due to the limited treatable field length of the current MR-Linac system. We performed a statistical analysis of the PTV length for all the 980 patients treated at our hospital over a 3-month period from May to July 2024. The results showed that 36.33% of these patients have a length exceeding 20 cm. To broaden MRIgART's applicability, developing a safe and feasible method for treating long PTV is essential.
Two studies have explored the application of MRIgART for extended PTV. Placidi et al 12 tested the dosimetic accuracy and confirmed multi-leaf Collimator and couch precision in dual-isocenter MRIgART. Their findings suggested that introducing artificial positioning errors of 2 and 5 mm still met dose accuracy and robustness requirements. Chuter et al 11 introduced the dual-isocenter technique to address the MR-Linac's field size limitation. They explored potential adaptive workflows in combination with a dual-isocenter approach and the treatment plans were simulated to account for inter-fraction anatomical changes. They designed the dual-isocenter plans for 10 patients with cervical cancer, shifting the isocenter by 3 and 6 mm to assess the dose distribution. They found that the upward PTV shifts did not impact the coverage, whereas the downward shifts reduced the PTV coverage by approximately 2.4% per millimeter.
For the Unity MR-Linac system (Elekta, Stockholm, Sweden), the following two adaptive modes are available: adapt to position (ATP) and adapt to shape (ATS).13–15 In ATP, the plan is adjusted based on the patient's position using the reference computed tomography (CT) image, whereas, in ATS, the oncologist adapts the PTV and OAR contours to the patient's current anatomy. This is followed by the optimization of the MRI-based adaptive plan. After achieving the dosimetric criteria, quality assurance (QA) for the adaptive plan is performed through a secondary independent dose calculation.15–17
To expand the range of cancer patients who can benefit from treatments delivered on the MR-Linac, we explored the clinical workflow of MRIgART for treating long, continuous PTVs using both the ATP and ATS modes. Several critical issues needed to be resolved in the online workflow. First, the MR scan range is limited; for instance, the Elekta Unity MR-Linac has an MR scan range of 30 cm, which is insufficient for patients with PTV lengths exceeding this limit, such as in cervical cancer patients. Second, an efficient workflow for online ART based on the current MRIgART technology is required to address the field length limitations. Third, when using multiple MRIgART isocenters, a timely and effective composite adaptive dose evaluation method is necessary to ensure treatment safety. Fourth, synchronization of the online adaptive processes is critical for improving the efficiency of radiotherapy.
To address these challenges, we developed an MRIgART workflow, specifically designed to overcome the limitations related to MR scan range, treatment field size, adaptive plan generation, and composite dose evaluation. We demonstrated its application using an in-house-designed MR phantom. Additionally, pretreatment dose validations were performed for the ART plan of long PTVs.
Materials and Methods
MRIgART for Long, Continuous PTVs
The present study developed the MRIgART workflow for long, continuous PTVs. The long PTV was divided into the following two sub_target volumes: PTV_sub1 and PTV_sub2. We established two isocenters. The new MRIgART workflow is illustrated in Figure 1.

The MRIgART Workflow for Long, Continuous PTVs. White Workflow: Refers to the Processes of Design and Dose Verification of the Reference Plan. Pink Workflow: Refers to the Online Adaptive Processes of the PTV_sub1. Blue Workflow: Refers to the Online Adaptive Processes of the PTV_sub2. Abbreviations: PTV, Planning Target Volume; CT, Computed Tomography; MR, Magnetic Resonance; ATP, Adapt to Position; ATS, Adapt to Shape.
PTV_sub1 followed the existing MRIgART workflow. The PTV_sub2 workflow was implemented as follows. First, the on-the-day MR image was obtained and an offline reference plan was created based on the adaptive dose of PTV_sub1. Subsequently, the reference plan was transferred to the patient information management system (PIMS). Then, the MR image of PTV_sub2 was rescanned, and the online adaptive plan for PTV_sub2 was designed. Next, the composite dose evaluations of the adaptive plans were performed. After meeting the dose requirements, the adaptive plan of the PTV_sub2 was validated and the treatment was executed.
To enhance the efficiency of radiotherapy, the following multiple processes of MRIgART were performed concurrently: (i) synchronizing the image registration, structure delineation, and adaptation (if ATS) for PTV_sub1 with the change in the MR scan center and image scanning for PTV_sub2; and (ii) synchronizing the treatment for PTV_sub1 with the design of the offline reference plan for PTV_sub2.
The present study had an experimental phantom-based study design. The feasibility of the proposed MRIgART workflow for long, continuous PTVs was evaluated using a single phantom. In the present study, the following two workflow scenarios were designed: (1) both PTV_sub1 and PTV_sub2 followed the ATP workflow, and (2) PTV_sub1 followed the ATS workflow, whereas PTV_sub2 followed the ATP workflow. For each workflow scenario, three independent rounds of testing and validation were performed.
Workflow Simulation Using an in-House-Made Phantom
To simulate and evaluate the proposed MRIgART workflow for long, continuous PTVs on the Unity MR-Linac system, we developed an in-house phantom measuring approximately 33 cm in length and 25 cm in width. The phantom was designed to simulate human tissue heterogeneity and geometry, with a focus on maintaining internal structural stability for consistent imaging and dose delivery. The outer shell was constructed using rigid polymethyl methacrylate to ensure geometric integrity. Internally, the compartments were filled with water as well as muscle-equivalent porcine and fat tissues to mimic the soft tissue contrast and electron density characteristics. The densities of the main components were as follows: water (1.00 g/cm³), muscle tissue (∼1.05 g/cm³), and fat tissue (∼0.92 g/cm³). Prior to use, the phantom underwent a CT scan to confirm the geometric accuracy, material uniformity, and stability under repeated scans. The CT images of the in-house-made phantom are displayed in Supplemental Material 1.
Delineation of PTV and OARs and Their Dose Requirements
The CT image of the in-house-made phantom was imported into the Monaco treatment planning system (TPS) (version 5.4, Elekta, Crawley, UK). The PTV was delineated by a radiation oncologist. The PTV was divided into PTV_sub1 and PTV_sub2. The PTV_sub1 and PTV_sub2 lengths were 12 and 18 cm, respectively, as shown in Figure 2. The superior and inferior PTVs were asymmetric, reflecting many real clinical situations. To mitigate the dose hot spots and cold spots within the junction region of PTV_sub1 and PTV_sub2, a field overlap region of PTV_mid (Figure 2) with a length of 4.5 cm was set. Chuter et al 8 utilized a 2-cm field overlap region. Myers et al 18 suggests that elongating the overlap volume can mitigate the dose discrepancies arising from the positioning errors. In the present study, the choice of a 4.5-cm overlap region was based on a balance between ensuring sufficient robustness and still maintaining an adequate treatable PTV length. The detailed definition of the dose fall-off region PTV_mid and its optimization method are provided in Supplemental Material 2. OAR1, OAR2, and cavities were also delineated. Among them, OAR2 was located in the field overlap region. The prescribed dose for the PTV was set at 45 Gy delivered in nine fractions. At least 95% of the PTV was required to receive the prescribed dose.

Schematic Diagram of the Planning sub_Target Volumes for PTV and Field Overlap Region. The Long, Continuous PTV Was Divided into the Following Two Planning sub_Target Volumes: PTV_sub1 and PTV_sub2. The Field Overlap Region Was PTV_mid. Abbreviations: PTV, Planning Target Volume; OAR, Organs at Risk.
Design of the Reference Plans and Dose Verification
Two isocenters, iso_PTV_sub1 and iso_PTV_sub2, were established. The distance between the two isocenters in the superior–inferior direction was 14.4 cm. The transition between the two isocenters was accomplished by moving the treatment couch inward or outward.
Two IMRT plans were generated utilizing eight fields each,taking into account the location and symmetric distribution of PTV_sub1 and PTV_sub2. To prevent a high-dose delivery to the cable tube in the low-temperature thermostat, the plans were designed to avoid beam angles of 13°. The parameters of the two plans were configured as follows: minimum segment area, 4 cm2; minimum segment width, 0.5 cm; low fluence smoothing; a minimum of 4 MUs per segment; maximum number of segments, 100; statistical uncertainty per calculation, 1%. All plans were calculated using the Monaco TPS, with a grid size of 0.3 cm in three dimensions. The optimization of the reference plan for PTV_sub2 was done using the “Bias Dose” function, which is designed to guide the optimization process when planning with multiple isocenters. By importing the dose distribution of PTV_sub1 into the PTV_sub2 plan optimization, the system adjusts the dose to avoid the hot spots and improve dose homogeneity across the field overlap region.
Dose verification was performed using the MR-compatible ArcCHECK phantom (Sun Nuclear Corporation, Melbourne, USA). 19 Each plan was recalculated using the phantom's CT image. The ArcCHECK was then mounted on the treatment couch. The data were collected and analyzed using SNC patient software (version 8.2, Sun Nuclear Corporation, Melbourne, USA). To identify discrepancies between the calculations and phantom measurements, the gamma pass rate (ArcCHECK vs TPS) was used. As recommended by the AAPM report TG218, 20 a criterion of 2 mm/3% with global normalization and a threshold of 10% were implemented.
MR Scan, Image Registration, and Structure Adaptation for PTV_sub1
The phantom was positioned on the Unity treatment couch, which was then adjusted to align with the isocenter of PTV_sub1. A localizer scan was performed initially, followed by adjusting the MR scan range for PTV_sub1. The adjustment method can be found in Supplemental Material 3. This scan was designed to encompass the PTV_sub1, field overlap region, and portions of PTV_sub2. The resulting on-the-day MR image of PTV_sub1 (referred to as MR_sub1) was obtained. Upon the completion of the MR scan, rigid registration was then performed. Depending on the selection, either the ATS or ATP mode could be used. If the ATS mode was selected, the structures for PTV_sub1 and OARs would be adapted from the reference CT image to the MR_sub1.
MR Scan, Image Registration, Structure Delineation, and Adaptation for PTV_sub2
During image registration and structure adaptation for PTV_sub1, the MR scan center was shifted toward the PTV_sub2. The initial MR scan of PTV_sub2 was performed, yielding the first on-the-day MR image (MR_first_sub2). Adjusting the MR scan range to include the PTV_sub2, field overlap region, and portions of PTV_sub1 is essential.
After acquiring the MR_first_sub2 image, performing deformable registration between the MR and reference CT images was necessary. Moreover, the adaptation of the structures was executed using the ATS mode. This step was performed to ensure that the structures for PTV_sub2 and OARs could be mapped onto the MR_first_sub2 image.
Design of the Online Adaptive Plan for PTV_sub1 and Dose Verification
After image registration and structure adaptation, the online ART plan for PTV_sub1 was designed. Following the standard procedure, either an ATS or ATP adaptive plan was created. Following online plan approval, the ArcherQA software (Wisdom Technology Company Limited, Hefei, China)15,21 was used for rapid dose verification. Once the verification was completed and the plan passed QA, it was then executed.
Design of the on-the-day Offline Reference Plan of PTV_sub2
Owing to the absence of the “Bias Dose” function in the online Monaco system, the optimization of the on-the-day reference plan of PTV_sub2 should be performed on the offline system. The online Monaco system was closed during the PTV_sub1 treatment, and the offline system was opened. The plan was optimized based on the PTV_sub1 adaptive plan. After completing the design of the on-the-day reference plan of PTV_sub2, it was transmitted to the PIMS.
Couch Movement, re-MR Scan, and Design of the Online Adaptive Plan for PTV_sub2
The treatment couch was moved to the isocenter of PTV_sub2. The MR scan range was adjusted to ensure that the PTV_sub2, field overlap region, and PTV_sub1 portions can be scanned. Subsequently, the second on-the-day MR image of PTV_sub2 (MR_second_sub2) was obtained. The online MR_second_sub2 image was registered to the MR_first_sub2 image. An ATP adaptive plan of PTV_sub2 was designed.
Composite Dose Evaluation of PTV and Validation and Execution of the Adaptive Plan for PTV_sub2
To evaluate the PTV dose, the online and offline systems were closed and opened, respectively. The adaptive doses for PTV_sub1 and PTV_sub2 were summed to obtain the composite dose. If the evaluation was successful, the process returned to the online Monaco system and the ArcherQA system was utilized to perform dose verification of the adaptive plan for PTV_sub2. Upon successful verification, the adaptive plan was then implemented. In cases where the evaluation of the composite dose failed, either due to inadequate PTV coverage or excessive dose to OARs, the adaptive plan was revised. The updated plans were then re-evaluated following the same workflow until the composite dose met the clinical requirements.
Dose Verification of the Field Overlap Region
Dose verification of the field overlap region for the composite adaptive plan was performed using an ionization chamber 22 and the ArcCHECK-MR 19 phantom.
We employed a PTW 30013 ionization chamber. It was placed between a 6-cm solid water slab (top) and a 14-cm water solid slab (bottom), and was also positioned at the phantom's central point. The region of overlapping fields was located in the central region of the phantom, and the length of the field junction was 4.5 cm. Thus, the ionization chamber was precisely within the field overlap region. The adaptive plans for PTV_sub1 and PTV_sub2 were delivered to the ionization chamber. Each adaptive plan was recalculated using the CT image of the solid water phantom. Two calculated doses were then combined. The difference between the calculations and measurements was subsequently determined.
Dose verification was performed using the MR-compatible ArcCHECK phantom. 19 The field overlap region was within the measurement range, which refers to the sensitive volume of the PTW 30013 ionization chamber (0.6 cm3), within which the dose was recorded. The data were collected and analyzed using SNC patient software. Each adaptive plan was recalculated using the phantom CT image, and two adaptive phantom doses were combined in SNC patient software. The gamma pass rate (ArcCHECK vs TPS) was used to identify any discrepancies between the calculations and measurements, with a criterion of 2 mm/3% and a threshold of 10%.
Treatment Time Record of Each Step of the MRIgART Workflow
In addition to evaluating the feasibility of the MRIgART workflow for long, continuous PTVs, the treatment time of each step of the workflow with the in-house-made phantom was also systematically recorded, specifically when PTV_sub1 follows the ATS workflow and PTV_sub2 follows the ATP workflow.
Results
Length of the PTV Using the New MRIgART Workflow
As depicted in Figure 3, the maximum treatable length of the PTV in the new workflow is calculated as follows:

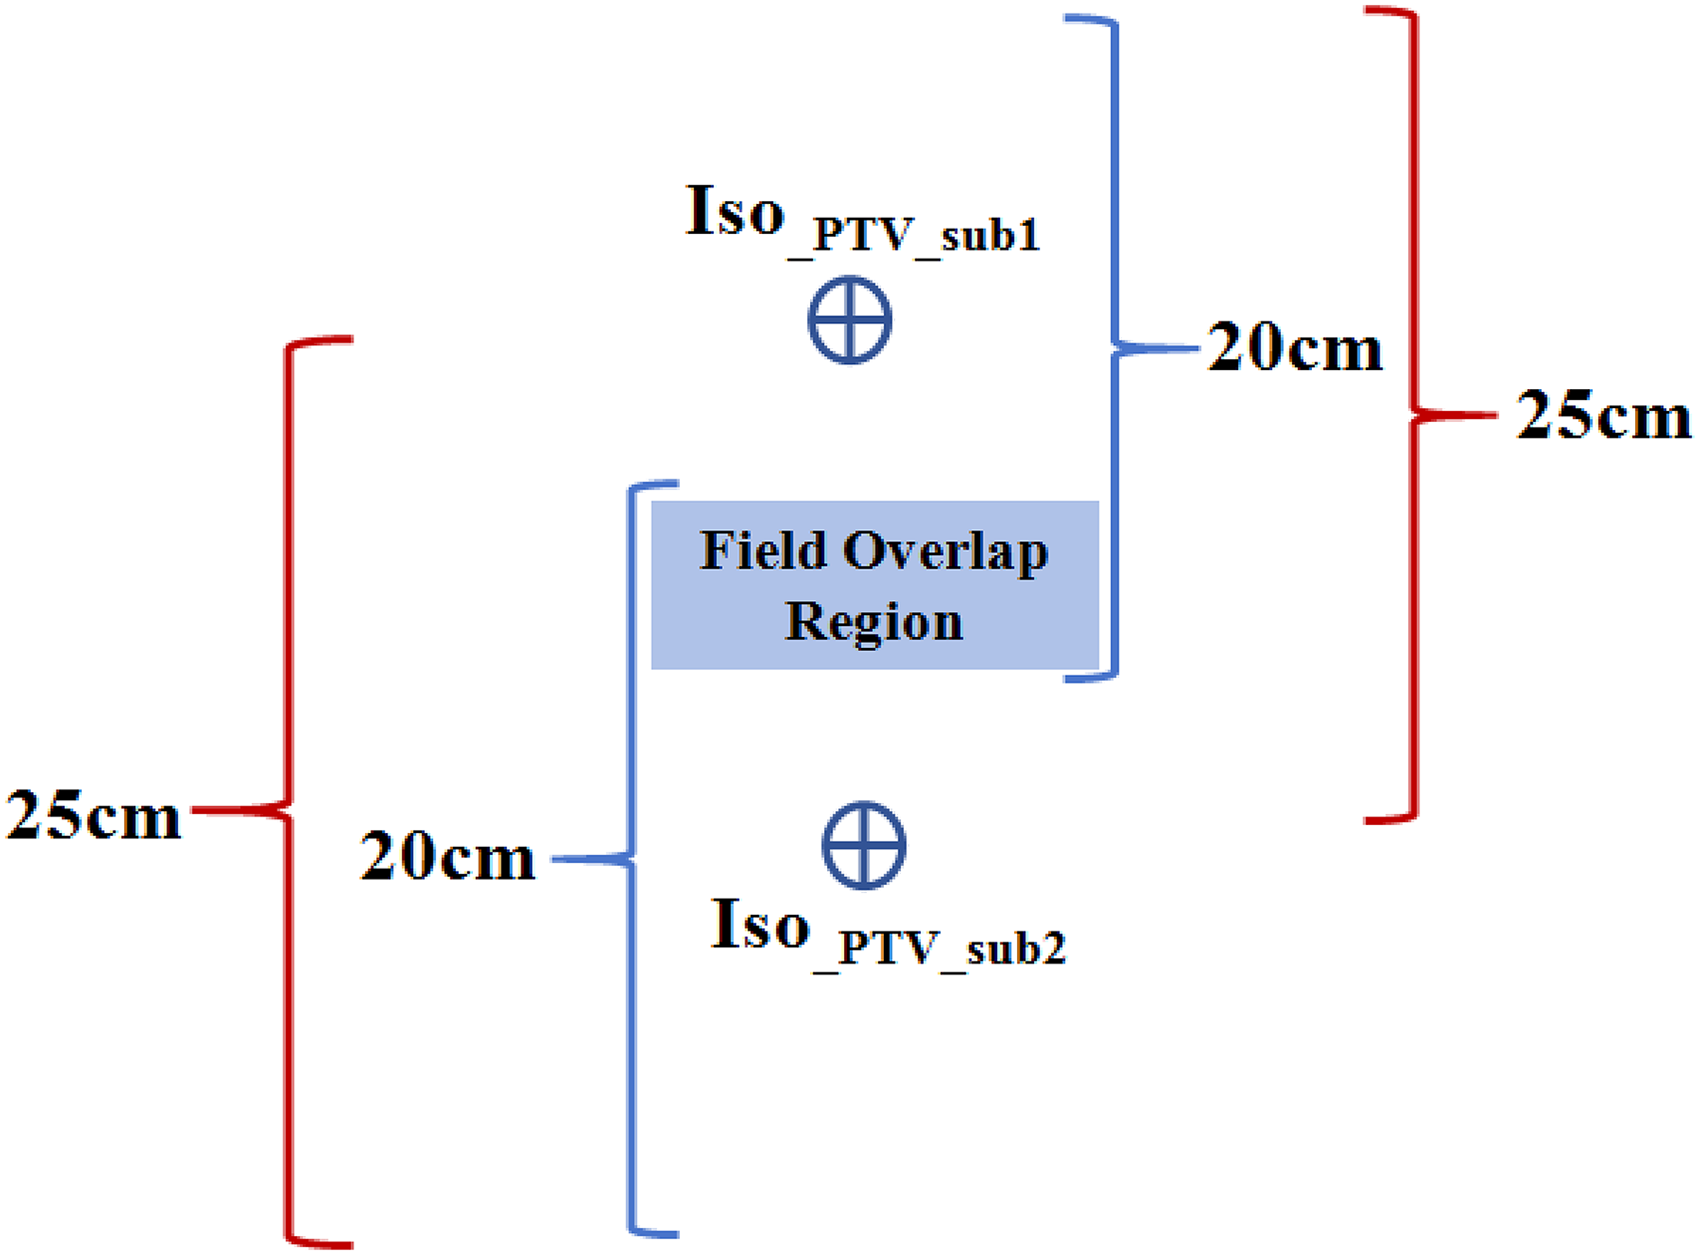
Schematic Diagram Illustrating the Radiotherapy Treatment Field and MR Scan Range of MRIgART for Long, Continuous PTVs. The Blue Single Quotation Symbol Represents a Single Treatment Region. The Red Single Quotation Symbol Represents a Single Clear MR Image Region Obtained. Abbreviations: Isocenter of PTV_sub1 (iso_PTV_sub1); Isocenter of PTV_sub2 (iso_PTV_sub2).
The overlap length between the two MR scans (denoted as LMR scan overlap) is calculated as follows:

Using equation (2), it can be inferred that, if the PTV length is 30 cm, the overlap length on the MR image can reach up to 20 cm. Similarly, if the PTV length is 35 cm, the overlap length on the MR image can reach 15 cm.
Composite Dose Evaluation Results of the Adaptive Plans
Before the PTV_sub2 treatment, the composite dose evaluation of the two adaptive plans for PTV_sub1 and PTV_sub2 was performed. The results were presented in two parts: one showing the results when both PTV_sub1 and PTV_sub2 followed the ATP workflow, and the other showing the results when PTV_sub1 followed the ATS workflow and PTV_sub2 followed the ATP workflow.
Study Results When Both PTV_sub1 and PTV_sub2 Follow the ATP Workflow
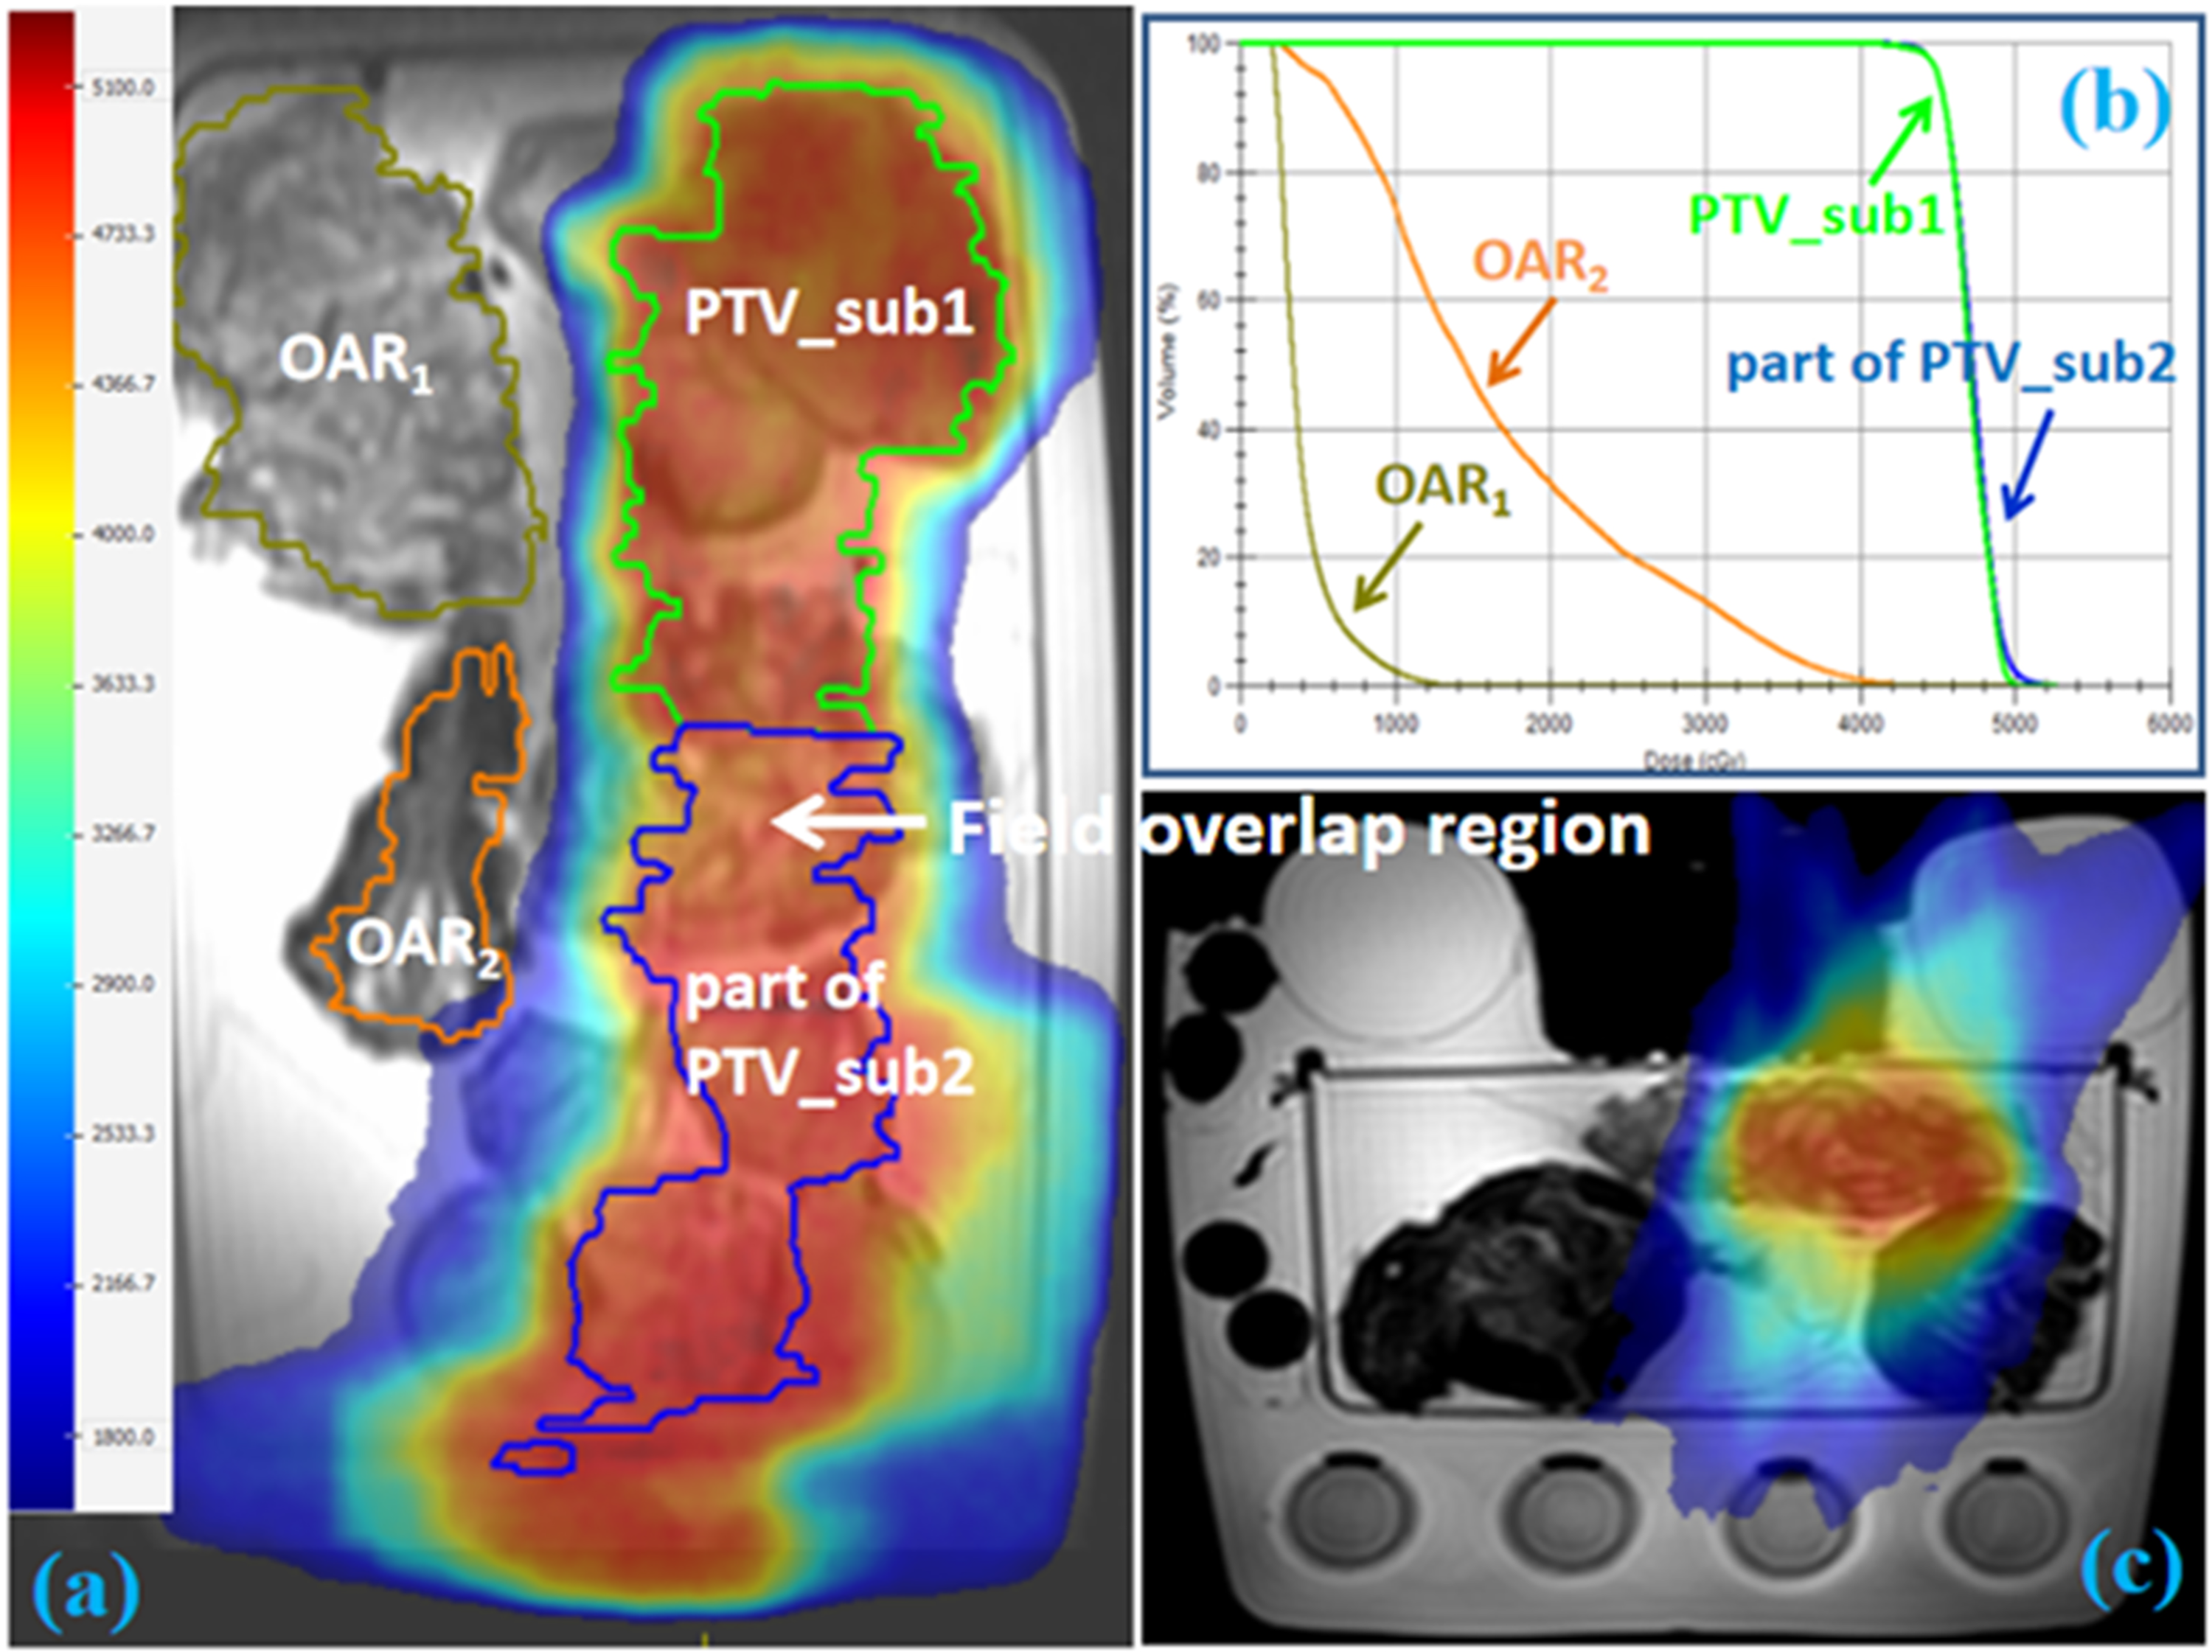
Since PTV_sub1 adopted the ATP online adaptive mode, the composite dose can be evaluated on the reference CT image. The dose distributions and dose volume histograms (DVHs) of the composite adaptive plan on the reference CT image of PTV_sub1 are shown in Figure 4.

The Dose Distribution and DVH of the Composite Adaptive Plan on the Reference CT Image. (a) Coronal Dose Distribution. (b) DVH of PTV, PTV_sub1, PTV_sub2, OAR1 and OAR2. (c) Cross-Sectional Dose Distribution of the Field Overlap Region.
Table 1 presents the dose comparison between the composite adaptive plan and composite reference plan for PTVs and OARs from three independent rounds of workflow simulation. In this simulation, both PTV_sub1 and PTV_sub2 followed the ATP workflow. As shown in Table 1, when compared with the reference plan, the Dmax in the adaptive plan was decreased and D1cc of the PTV_sub1 was increased. The difference between the two plans in D1cc of PTV_sub1 was <1%. For the mean dose of OAR1, a relatively small deviation was noted between the reference and adaptive plans. Table 1 shows that, for the OAR2 located in the field overlap region, the differences between the two plans were 3.44% and 2.74% for Dmax and D1cc, respectively. The difference for the Dmean of OAR2 was −1.06%.
Comparison of the Dose Parameters of PTV and OARs Between the Composite Adaptive Plan and Composite Reference Plan When Both PTV_sub1 and PTV_sub2 Follow the ATP Workflow, Accross Three Independent Workflow Simulations.
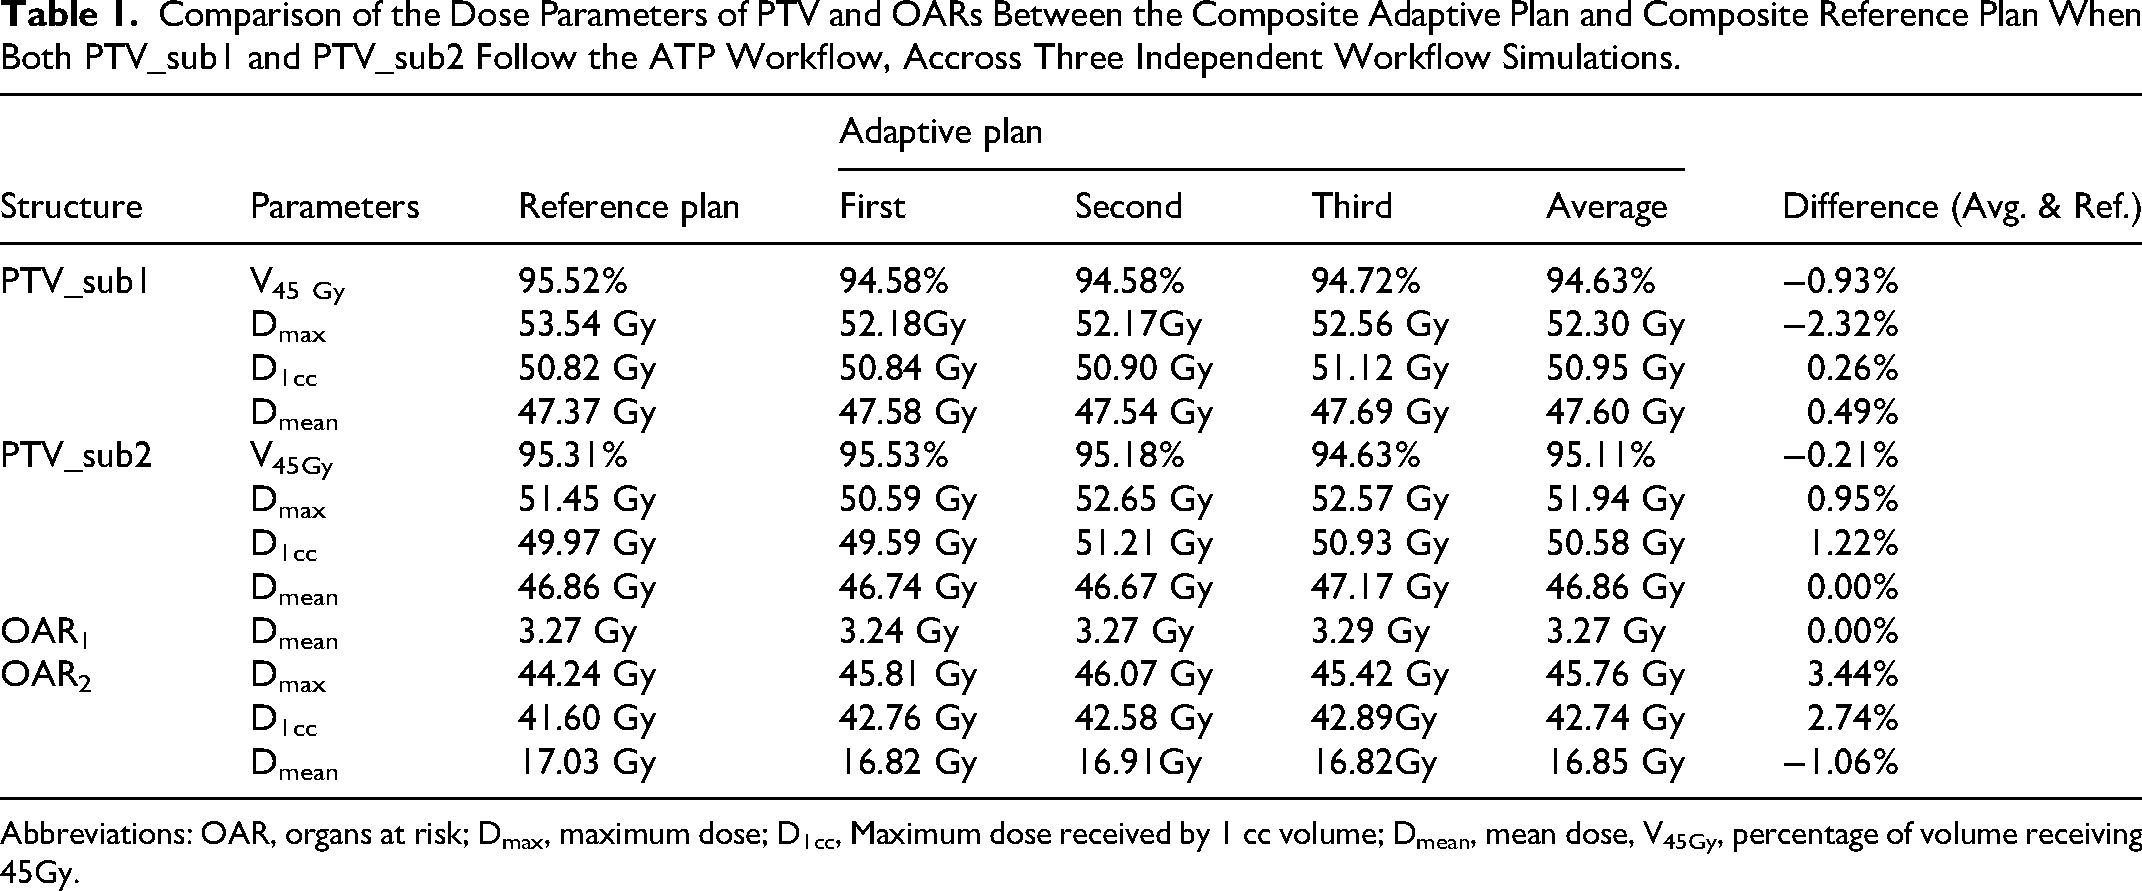
Abbreviations: OAR, organs at risk; Dmax, maximum dose; D1cc, Maximum dose received by 1 cc volume; Dmean, mean dose, V45Gy, percentage of volume receiving 45Gy.
Study Results When PTV_sub1 Follows the ATS Workflow and PTV_sub2 Follows the ATP Workflow
Since PTV_sub1 and PTV_sub2 follow the ATS and ATP workflows, respectively, the online adaptive radiotherapy plans were generated on their respective daily MR images. The dose distributions and DVHs of the composite adaptive plan on the on-the-day MR image of PTV_sub1 and PTV_sub2 are shown in Figures 5 and 6.
The Dose Distribution and DVH of the Composite Adaptive Plan on the on-the-day MR Image of PTV_sub1. (a) Coronal Dose Distribution. (b) DVH of PTV_sub1, Part of PTV_sub2, OAR1, and OAR2. (c) Cross-Sectional Dose Distribution of the Field Overlap Region. Abbreviations: DVH, Dose Volume Histograms; OAR, Organs at Risk.

The Dose Distribution and DVH of the Composite Adaptive Plan on the on-the-day MR Image of PTV_sub2. (a) Coronal Dose Distribution. (b) DVH of Part of PTV_sub1, PTV_sub2, Part of OAR1, and OAR2. (c) Cross-Sectional Dose Distribution of the Field Overlap Region. Abbreviations: DVH, Dose Volume Histograms; OARs, Organs at Risk.
Table 2 presents the dose comparison between the composite adaptive plan and composite reference plan for PTVs and OARs from three independent rounds of workflow simulation. In this simulation, PTV_sub1 follows the ATS workflow whereas PTV_sub2 follows the ATP workflow. The results presented in Table 2 were obtained on the corresponding on-the-day MR image sets used for the adaptive plan. Specifically, the dose metrics for PTV_sub1 and OAR1 were evaluated on the on-the-day MR image of PTV_sub1, whereas those for PTV_sub2 and OAR2 were evaluated on the on-the-day MR image of PTV_sub2. As shown in Table 2, when compared with the reference plan, the Dmax and D1cc of the PTV_sub1 in the adaptive plan were decreased. Additionally, although the Dmax and D1cc of PTV_sub2 increased compared to those of the reference plan, the difference values between the two plans were <3%. For the OAR1 mean dose, although there was a relatively large deviation between the reference and adaptive plans for the first simulation, the average absolute dose difference was −0.04 Gy. Table 2 shows that, for OAR2 located in the field overlap region, all of its dosimetric metrics did not exceed 2%.
Comparison of the Dose Parameters for PTV and OARs Between the Composite Adaptive Plan and Composite Reference Plan When PTV_sub1 and PTV_sub2 Follow the ATS and ATP Workflow, Respectively, Across Three Independent Workflow Simulations.

Abbreviations: OAR, organs at risk; Dmax, maximum dose; D1cc, Maximum dose received by 1 cc volume; Dmean, mean dose, V45Gy, percentage of volume receiving 45Gy.
Dose Verification Results
Dose Verification Results of the Reference and Adaptive Plans
Table 3 shows the dose verification results of the reference and adaptive plans. With the 2-mm/3% criterion, the gamma pass rates (ArcCHECK vs TPS) of the reference plan for PTV_sub1 and PTV_sub2 were 99.6% and 99.8%, respectively. When both PTV_sub1 and PTV_sub2 adopted the ATP workflow, the average gamma pass rates (ArcherQA vs TPS) of the adaptive plan for PTV_sub1 and PTV_sub2 were 96.20% and 99.20%, respectively. When PTV_sub1 and PTV_sub2 follow the ATS and ATP workflow, respectively, the average gamma pass rates (ArcherQA vs TPS) of the adaptive plans for PTV_sub1 and PTV_sub2 were 95.27% and 98.05%, respectively. The average gamma pass rates for the PTV_sub1 and PTV_sub2 adaptive plans were 95.74% and 98.63%, respectively.
Dose Verification Results of the Reference and Adaptive Plans Across Two Scenarios in Three Independent Workflow Simulations.
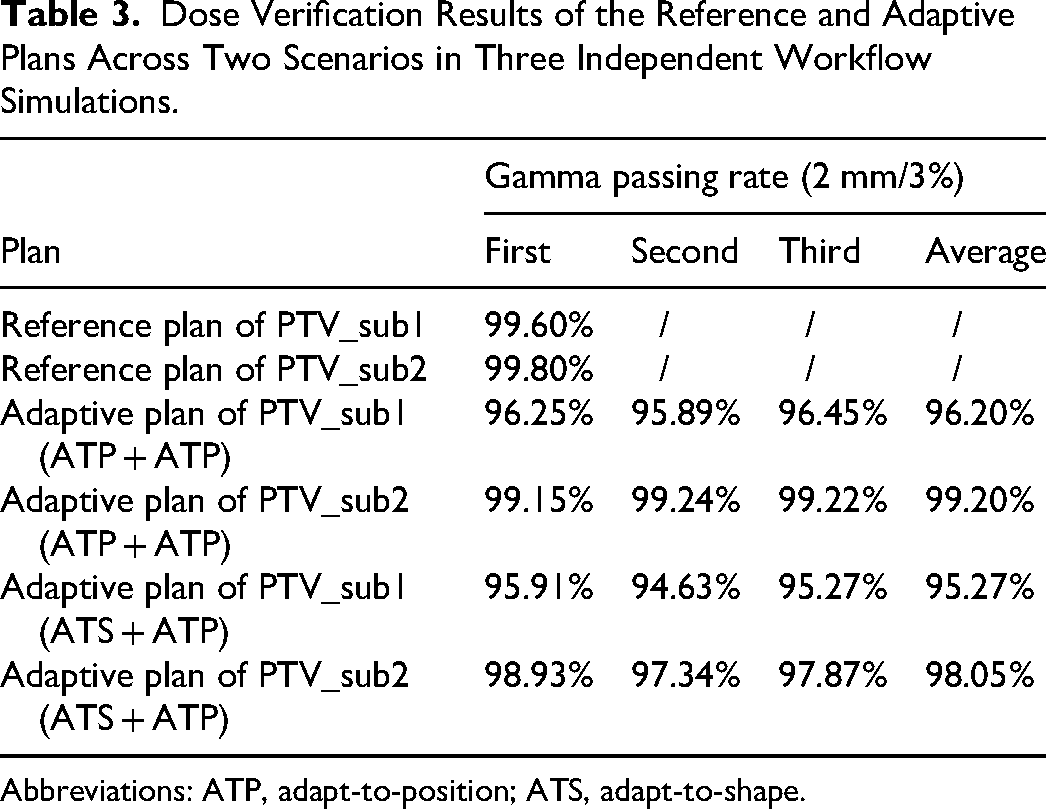
Abbreviations: ATP, adapt-to-position; ATS, adapt-to-shape.
Dose Verification Result of the Field Overlap Region
Table 4 presents the dose measurement results obtained with the ionization chamber alongside the dose calculation results of the composite adaptive plans. When both PTV_sub1 and PTV_sub2 adopted the ATP workflow, the differences between the measured and calculated values was smalller than 2%. When PTV_sub1 follows the ATS workflow whereas PTV_sub2 follows the ATP workflow, the difference between the measured and calculated values was smalller than 1.5%.
Measurement Results Obtained by Using the Ionization Chamber PTW 30013 and Calculation Results Obtained by Using the Monaco TPS for the Composite Adaptive Plan, Across Two Scenarios in Three Independent Workflow Simulations.

Abbreviations: ATP, adapt-to-position; ATS, adapt-to-shape.
Table 5 presents the dose measurement results obtained with the ArcCHECK phantom alongside the dose calculation results for the composite adaptive plans. When both PTV_sub1 and PTV_sub2 adopted the ATP workflow, the passing rate for the measurement to the TPS calculation was 94.6%, with the 2 mm/3% criterion. When PTV_sub1 follows the ATS workflow and PTV_sub2 follows the ATP workflow, the passing rate for the measurement to the TPS calculation was 96.4%. For the field overlap region, the average gamma pass rate was 95.50%.
Measurement Results Obtained by Using the ArcCHECK Phantom and Calculation Results Obtained by Using the Monaco TPS for the Composite Adaptive Plan, Across Two Scenarios in Three Independent Workflow Simulations.

Abbreviations: ATP, adapt-to-position; ATS, adapt-to-shape.
Figure 7 presents the dose verification result of the field overlap region. The measurement was compared with the dose calculations from TPS.

The Dose Verification Results of the Field Overlap Region. Red and Blue Points Show the Failed Detector Points with High- and Low-Dose Measurements, Respectively.
Statistics of Treatment Time
Table 6 displays the time spent on each step of the MRIgART workflow with an in-house-made phantom, when PTV_sub1 and PTV_sub2 followed the ATS and ATP workflow, respectively. As shown in Table 6, the entire radiotherapy process takes a total of 61 min. The time-consuming steps include radiotherapy plan design, structure delineation, and beam delivery.
Statistics of Time Spent When PTV_sub1 and PTV_sub2 Followed the ATS and ATP Workflow, Respectively, for Long Continuous PTVs Using an in-House-Made Phantom.

Abbreviations: MR, magnetic resonance; PTV, planning target volume.
Discussion
There are two primary reasons why MRIgART imposes limitations on the PTV length. First, it is due to the constraint of the field size in the superior–inferior direction. Second, the MR scan center aligns with the treatment center and an MR scan range is limited to 30 cm. The present study incorporated modifications in the MR scan center and developed a viable new MRIgART workflow. We conducted a comprehensive test of the adaptive workflow on the Unity MR-Linac and confirmed its feasibility. The effective PTV length that can be treated using our proposed workflow is 40 cm minus the length of the field overlap region, as detailed in Equation (1). The present study employed a 4.5-cm field overlap region, whereas Myers et al 18 and Chuter et al 11 utilized a 2-cm field overlap region. Myers et al 18 suggested that elongating the overlap volume can mitigate the dose discrepancies arising from the positioning errors, albeit at the expense of a reduction in the treatable PTV length. The determination of the field overlap region length hinges on the following considerations: interplay between the PTV and OARs, factors related to ease of dose evaluation. In the present study, if the field overlap region is 2 cm, the treatable PTV length extends to 38 cm. Conversely, a 5-cm field overlap allows a treatable PTV length of 35 cm. The method proposed can extend the treatment length to nearly 40 cm, considerably enhancing the treatment options for patients with long PTVs.
In the present study, the long PTV was divided into two sub-target volumes. PTV_sub1 followed the current MRIgART workflow, whereas PTV_sub2 used both the offline and online Monaco TPS for the optimization of on-the-day reference and adaptive plans, respectively. A “bias dose” approach improved the dose homogeneity in the overlap region. A composite dose evaluation was established to ensure the dose accuracy. Additionally, Placidi et al 12 and Chuter et al 11 have demonstrated the dosimetric robustness of dual-isocenter setups under simulated setup deviations, showing maintained dose accuracies and acceptable PTV coverage losses. Their findings support the potential robustness of our workflow under similar conditions. To further validate this, we conducted a similar robustness analysis. The comparison of target coverage (Vp), PTV D1cc, and the mean dose (Dmean) of OARs under isocenter shifts of ±0.2 mm, ±0.5 mm, and ±1 mm for both isocenters, and shifts of ±3 mm and ±5 mm applied only to the isocenter of PTV_sub2 in the superior and inferior directions can be found in Supplemental Material 4. For the Unity MR-linac, the quality control requirement for couch positioning accuracy in the superior and inferior direction is 1 mm. As shown in Supplementary Table 1, within the quality control (QC) tolerance, the shifts of isocenters impact on the PTV and OARs was minimal, with differences within 1%. However, when the treatment couch positional error exceeded the QC tolerance, the dose impact on the planning target volumes and OARs became significant. For example, with a 3 mm backward shift of isocenter of PTV_sub2, the coverage of PTV error exceeds 3%. The results of our study for the isocenter position error was accordance with Chuter et al 11 . Their results and ours indicate that a shift of 1 mm within the QC tolerance would be clinically acceptable for intrafraction motion, whereas larger deviations warrant careful monitoring due to their potential impact on the composite dose distribution. Safety and reliability are the two main characteristics of treating long, continuous PTVs.
The present study involved four dose verifications to ensure the dose accuracy of MRIgART. First, the ArcCHECK phantom dose measurements validated the dose of the reference plans. Second, Monte Carlo dose verification was used for the two online adaptive plans. Third, the ionization chamber and ArcCHECK phantom measurements confirmed the dose accuracy in the overlap region. As showed in Table 3, with the 2 mm/3% criterion, the gamma pass rates (ArcCHECK vs TPS) of the reference plan for PTV_sub1 and PTV_sub2 were 99.6% and 99.8%, respectively. The average gamma pass rates (ArcherQA vs TPS) of the adaptive plans for PTV_sub1 and PTV_sub2 were above 95%. In addition, the ionization chamber measurements and the calculated doses of the composite adaptive plans, presented in Table 4, showed discrepancies smaller than 2%. Table 5 presents the ArcCHECK phantom measurements for the composite adaptive plans, where the average gamma pass rates in the overlap region was 95.5% under the 2 mm/3% criterion. To ensure safety of the radiotherapy, quality control was implemented at the following three stages: after the reference plan design and before and after the execution of the online adaptive plan.
Compared to the conventional single isocenter MRIgART workflow, the workload of the daily MR image scans and plan designs is doubled. Although some steps can be streamlined, as shown in Figure 1, the overall treatment time remains longer. Treatment time may further increase depending on plan complexity. Therefore, future studies should focused on streamlining the MRIgART workflow of the long, continuous PTVs.
Conclusion
The present study developed an MRIgART workflow for treating long, continue PTVs and demonstrated its excellent dose accuracy and feasibility. Compared to conventional MRIgART, the method extends the treatable PTV length from 20 cm to nearly 40 cm when the field overlap volume is utilized. This advancement considerably expands the treatment options for patients with long, continuous PTVs.
Supplemental Material
sj-docx-1-tct-10.1177_15330338251408324 - Supplemental material for Development and Validation of a Magnetic Resonance Imaging-Guided Adaptive Radiotherapy Workflow for Long, Continuous Planning Target Volumes
Supplemental material, sj-docx-1-tct-10.1177_15330338251408324 for Development and Validation of a Magnetic Resonance Imaging-Guided Adaptive Radiotherapy Workflow for Long, Continuous Planning Target Volumes by Lingling Yan, NingYu Wang, Ke Zhang, Wensheng Nie, Shirui Qin, Xiufen Li, Deqi Chen, Qi Fu, Jianrong Dai and Kuo Men in Technology in Cancer Research & Treatment
Footnotes
Abbreviations
Acknowledgments
This work was supported by the CAMS Innovation Fund for Medical Sciences (CIFMS), National Natural Science Foundation, National High Level Hospital Clinical Research Funding and Cooperation Fund of CHCAMS Beijing & Langfang & SZCH, Cancer Research Program of National Cancer Center, Special Research Fund for Central Universities, Peking Union Medical College, (grant number 2023-I2M-C&T-B-076, 7222149, CFA202503015, NCC202422004, 3332025089).
Ethics Statement
All procedures performed in this study only involved the phantom data, and there were no animal and human participants involved.
Authors’ Contributions
JD and KM designed the study; LY and NW contributed to the investigation, data analysis, and wrote the original draft; LY, NW and KZ involved in validation of workflow; WN and SQ contributed to the method of MR scan; XL, DC, and QF provided the clinical support; JD and KM provided the manuscript revision. All authors approved the final version of the manuscript.
Funding
The authors disclosed receipt of the following financial support for the research, authorship, and/or publication of this article: This work was supported by the CAMS Innovation Fund for Medical Sciences (CIFMS), National Natural Science Foundation, National High Level Hospital Clinical Research Funding and Cooperation Fund of CHCAMS Beijing & Langfang & SZCH, Cancer Research Program of National Cancer Center, Special Research Fund for Central Universities, Peking Union Medical College, (grant number 2023-I2M-C&T-B-076, 7222149, CFA202503015, NCC202422004, 3332025089).
Declaration of Conflicting Interests
The authors declared no potential conflicts of interest with respect to the research, authorship, and/or publication of this article.
Supplemental Material
Supplemental material for this article is available online.
References
Supplementary Material
Please find the following supplemental material available below.
For Open Access articles published under a Creative Commons License, all supplemental material carries the same license as the article it is associated with.
For non-Open Access articles published, all supplemental material carries a non-exclusive license, and permission requests for re-use of supplemental material or any part of supplemental material shall be sent directly to the copyright owner as specified in the copyright notice associated with the article.