
Abstract
Objective
To assess the efficiency of extracellular volume (ECV) derived from equilibrium computed tomography (CT) in predicting recurrence-free survival (RFS) and overall survival (OS) after R0 resection of pancreatic ductal adenocarcinoma (PDAC).
Methods
This retrospective study included 83 patients who underwent CT and R0 resection between January 2016 and September 2023. The pattern of tumor recurrence and prognosis were recorded for each patient. Tumor recurrence was classified into three groups: isolated local recurrence group, distant recurrence group and censored group. The associations between the CT-ECV and clinicopathological features and recurrence pattern of PDAC were evaluated by chi-squared test. Multivariable Cox proportional-hazards models were conducted to evaluate the effects of clinical factors, CT features and CT-ECV on RFS and OS.
Results
The median RFS and OS were 10.7 and 17.1 months, respectively. On multivariate analysis, the CT-ECV and adjacent organ invasion were found to be associated with RFS (HR, 0.968, P = .017; HR, 0.453; P = .006), and only the CT-ECV was an independent prognostic factor for OS (HR, 0.968; P = .022). Low CT-ECV group was significantly associated with elevated CA19-9, larger tumor size, G3 (tumor grade) and II/III (AJCC tumor stage) (P < .05). In the recurrence pattern analysis, the CT-ECV did not exhibit an association between local recurrence and non-local recurrence groups (P = .455), while patients in the low CT-ECV group were more inclined to experience distant recurrence after curative surgery (P = .037).
Conclusions
CT-ECV determined by equilibrium contrast-enhanced CT was a useful imaging biomarker for predicting distant recurrence and survival in resectable PDAC patients, which may facilitate further risk stratification and personalized care.
Keywords
Introduction
Pancreatic ductal adenocarcinoma (PDAC) is a highly lethal disease with a 5-year survival of less than 9%. 1 Radical resection is the only treatment option, but still has a 5-year survival of only 20%. 2 Even some stage I patients with small primary tumor recur after a short recurrence-free interval and quickly progress to death. The current clinical practice for prognostic evaluation of PDAC largely relies on the tumor-node-metastasis (TNM) staging system. 3 However, even patients with the same disease stage experienced much variability in outcomes, 4 reflecting the inadequate predictive value provided by the present approach. Hence, identifying a reproducible, biologically meaningful, and clinically relevant prognostic factor for PDAC patients is necessary that may facilitate risk stratification and therapeutic decisions at initial diagnosis.
PDAC is characterized by abundant fibrotic stroma encasing malignant epithelial cells and typically composes 60%-90% of the tumor bulk.5–7 Microscopically, the proliferation of pancreatic stellate cells and the excessive deposition of collagen proteins are the basis of fibrosis of pancreatic cancer cells, which results in the expansion of extravascular extracellular volume (ECV).8,9 The ECV represents the sum of the intravascular and extravascular volume fractions and can be quantified with equilibrium contrast-enhanced computed tomography (CT). In the equilibrium phase, the iodinated contrast material is evenly distributed between intravascular and extravascular spaces, tumor ECV can be calculated from absolute enhancements of the tumor and aorta between unenhanced and equilibrium phases CT images corrected by the hematocrit value.8,10
Previous studies have shown that the CT-ECV can be used as a noninvasive quantitative biomarker for evaluating the pancreas-related events. Fukukura9,11 and Wang 12 et al reported that the CT-ECV can predict the survival outcomes or chemotherapy responses in advanced PDAC patients. However, the CT-ECV has not been used to assess the recurrence pattern and prognosis in resectable PDAC patients. While the majority of individuals with PDAC experience postoperative distant metastasis, 20% of patients only exhibit local recurrence with a more favorable prognosis.3,13 Repeated resection or radiation therapy for local recurrence is beneficial.14,15 Preoperative prediction of local recurrence or distant metastasis might improve postoperative follow-up and guide individual treatment.
Therefore, the aim of this study was to evaluate whether the CT-ECV determined by equilibrium contrast-enhanced CT predicts the recurrence patterns and survival in patients with resectable PDAC.
Materials and Methods
Patients
170 patients who underwent preoperative pancreatic CT and radical resection from January 2016 to september 2023 were retrospectively and consecutively screened from our institutional database. All patient details were de-identified. Inclusion criteria were as follows: (a) histologically confirmed PDAC and resectable tumor determined on preoperative CT within 15 days, (b) age ≥18 years. Exclusion criteria were as follows: (a) preoperative neoadjuvant chemotherapy use, (b) no preoperative CT with equilibrium phase images within 15 days, (c) coexisting other malignancies within 5 years prior to the PDAC, and (d) incomplete clinical or follow-up information. Finally, data from a total of 83 patients (median age, 61 years; interquartile range, 54-68 years; 58 men) were included for analysis in our study (Figure 1).

Flow Chart.
CT Examination
Multiphasic CT was conducted using two CT scanners (SOMATOM Definition Flash, Siemens Healthineers and Discovery CT 750HD, GE Medical Systems). All patients underwent pancreatic parenchymal phase, portal venous phase, and equilibrium phase CT scans before surgery. After obtaining plain CT images, 1.2 mL/kg of nonionic contrast material (Iopamiro 370, Bracco Healthcare; or Ultravist 370, Bayer Healthcare) was administered intravenously, using a power injector, via the antecubital vein, at 3.0-5.0 mL/s. Arterial and portal venous phase scans were delayed 8 s and 35 s after enhancement of the descending aorta to 150 HU, respectively. Equilibrium phase scan was performed with a fixed scan delay of 3-5 min.
The acquisition parameters included tube voltages of 120 kVp, and automatic tube current modulation was used, collimation of 128 × 0.6 mm, gantry rotation time of 0.5 s, and spiral pitch of 1.0 (for SOMATOM Definition Flash) or 0.7 (for SOMATOM Force). All images were reconstructed with a thickness of 1 mm and increment of 0.8 mm.
Data Collection and Follow-up
Patient baseline characteristics and pathological variables were recorded based on a review of the patient medical records: age, sex, bilirubin, albumin, lymphocytes, and serum CA 19-9 levels, surgery types, tumor location, tumor size, tumor grade, and tumor stage. All biochemical variables were routinely measured within 15 days before surgery. Surgery type was categorized based on the International Study Group for Pancreatic Surgery consensus. 16
In our institution, all patients were followed up with contrast-enhanced CT every 3 months postoperatively in the first year and then every 3-6 months thereafter until November 2024. MRI, PET/CT or biopsy was performed if necessary to clarify tumor recurrence. Recurrence patterns were categorized as isolated local recurrence group, distant recurrence group and censored group. Censored patients were defined as non-isolated local recurrence or non-distant recurrence, respectively, in the recurrence analysis. Recurrence-free survival (RFS) and overall survival (OS) were recorded for each patient, defining RFS as the time from surgery to tumor recurrence, death, or last follow-up examination (censored) and OS as the interval from surgery to either death or last follow-up examination (censored).
CT Image Analysis
Radiologists 1 and 2 (with 4 and 6 years of experience in abdominal radiology, respectively), who were blinded to the clinical and surgery data, independently drew the regions of interest (ROIs) on the non-enhanced images and equilibrium-phase images in the PACS workstation. For each patient, ROIs were placed in the primary PDAC to measure the CT values (HU) of the tumor (HUtumor), taking care to avoid blood vessels and pancreatic ducts. To minimize the variations in image scanning time, circular ROIs were placed in the aorta at the PDAC level to measure the HU of the aorta (HUaorta). Absolute enhancements of the tumor (ΔHUtumor) and aorta (ΔHUaorta) were calculated from the difference in HUs between the unenhanced and equilibrium-phase CT images, respectively. Subsequently, the ECV within the tumor was calculated as follows:

All measurements were taken twice by two radiologists, and the mean values were used for analysis.
Based on the PDAC radiology reporting template proposed by the Society of Abdominal Radiology and the American Pancreatic Association, 17 the CT variables included tumor margins (well circumscribed vs ill defined), peripancreatic tumor infiltration (present vs absent), contact with superior mesenteric vein/portal vein (SMV/PV) [present versus absent, based on the ≤180° tumor-vessel circumferential contact], adjacent organ invasion (defined as involving the stomach, small bowel, transverse colon, kidneys, adrenal glands, spleen, and other organs). The CT characteristics were reviewed by the above two radiologists. After independent image analysis, inter-reader agreement was evaluated and any discrepant results were resolved by the senior radiologist (with 28 years of experience in abdominal imaging).
Statistical Analysis
Patients were divided into low and high CT-ECV groups based on the median tumor ECV fraction. Survival curves of RFS and OS were plotted using the Kaplan-Meier method and compared by the log-rank test. The effects of age, sex, surgical type, tumor location, tumor size, AJCC tumor stage, serum CA 19-9 level, CT variables, postoperative adjuvant therapy and CT-ECV on RFS and OS were assessed using univariable and multivariable Cox proportional-hazards models. Variables with P < .05 in the univariate analysis were included in the multivariable analysis with a stepwise, backward selection (P ≤ .05 for entry and P > .10 for removal). The results are presented as odds ratios (ORs) with 95% confidence intervals (CIs). The associations between the CT-ECV and clinicopathological features were compared by chi-squared test. Chi-square test was also used to determine if CT-ECV had the potential to predict the recurrence patterns. Interobserver variability assessment and intraobserver agreement in CT-ECV measurements were evaluated by the intraclass correlation coefficient (ICC). All statistical analyses were performed by SPSS software (version 26.0; IBM Cor, 2013), setting significance at P < .05.
Results
Patient Characteristics
Among the 83 patients with PDAC included this study, there were 58 male and 25 female.The median age of the patients was 61.0 (range, 54.0-68.0) years. Lesions were located in the head (n = 64), body or tail (n = 19) of the pancreas. The mean primary tumor size was 2.8 cm. Based on the AJCC classification, 58 patients were in Stage IA or IB, 23 patients were in Stage IIA or IIB, 2 patients were in Stage III. 73 patients underwent standard pancreatic resection surgery, and 10 patients underwent extended pancreatic resection surgery. Overall, 47 patients received adjuvant chemoradiotherapy after surgery, whereas 36 patients did not receive it. The main characteristics of the patients are summarized in Table 1.
Patient Characteristics.

CA19-9, carbohydrate antigen 19-9; ECV, extracellular volume; AJCC, American Joint Committee on Cancer. Note.—Unless otherwise indicated, data are medians, with IQR in parentheses. *Data are means ± standard deviation. †Data are numbers, with percentages in parentheses.
Inter- and Intraobserver Reliability of Individual CT-ECV
High inter- and intraobserver agreement was observed for CT-ECV, with ICC values of 0.790 and 0.872, respectively. Therefore, further analysis was performed using the mean value of CT-ECV calculated by the two radiologists.
Survival
The Follow-up duration in the entire study sample ranged from 4.2 to 93.3 months (median, 17.1 months). During follow-up, tumors recurred in 55 of 83 (66.3%) patients between 1.1 and 84.3 months (median, 7.4 months), and 66 (79.5%) patients experienced tumor-related death between 4.2 and 87.6 months (median, 14.1 months). The median RFS and OS of all patients were 10.7 months (IQR, 5.0-38.0) and 17.1 months (IQR, 9.6-40.3), respectively.
Univariate and Multivariate Analyses
The results of univariate and multivariate analyses for RFS and OS are presented in Tables 2 and 3, respectively. Univariate analysis revealed that type of pancreatic surgery (hazard ratio [HR], 2.256; 95% confidence interval [CI]: 1.135, 4.485; P = .020), CA 19-9 (HR, 1.001; 95% CI: 1.000, 1.002; P = .045), tumor location (HR, 1.910; 95% CI: 1.038, 3.516; P = .038), T stage (HR, 1.757; 95% CI: 1.047, 2.951; P = .033), adjacent organ invasion (HR, 0.595; 95% CI: 0.361, 0.982; P = .042) and CT-ECV (HR, 0.966; 95% CI: 0.945, 0.988; P = .002) were significantly associated with OS. Meanwhile, the univariate analysis indicated that type of pancreatic surgery (HR, 2.347; 95% CI: 1.127, 4.886; P = .023), T stage (HR, 2.254; 95% CI: 0.688, 2.491; P = .008), adjacent organ invasion (HR, 0.515; 95% CI: 0.299, 0.887; P = .017) and CT-ECV (HR, 0.966; 95% CI: 0.944, 0.988; P = .003) were significantly associated with RFS. In the multivariate analysis, the CT-ECV (HR, 0.968; 95% CI: 0.942, 0.994; P = .017) and adjacent organ invasion (HR, 0.453; 95% CI: 0.257, 0.796; P = .006) were found to be associated with RFS, and only the CT-ECV (HR, 0.968; 95% CI: 0.942, 0.995; P = .022) was an independent prognostic factor for OS. Increasing the CT-ECV was associated with a positive effect on RFS and OS.
Univariate Analysis for RFS and OS in Patients with PDAC.

PDAC, pancreatic ductal adenocarcinoma; RFS, recurrence-free survival; OS, overall survival; CA19-9, carbohydrate antigen 19-9; ECV, extracellular volume. Numbers in parentheses represent 95% confidence intervals. The bold value means significant difference (P < .05).
Multivariate Analysis for RFS and OS in Patients with PDAC.

PDAC, pancreatic ductal adenocarcinoma; RFS, recurrence-free survival; OS, overall survival; CA19-9, carbohydrate antigen 19-9; ECV, extracellular volume. Numbers in parentheses represent 95% confidence intervals. The bold value means significant difference (P < .05).
The median CT-ECV was 35.4% (IQR, 29.0-43.2%). The Kaplan-Meier curves showed worse OS and RFS in patients with low CT-ECV group than in patients with high CT-ECV group (OS, 12.2 months [IQR, 9.0-15.4 months] vs 27.9 months [IQR, 16.6-39.2 months], P = .021; RFS, 8.3 months [IQR, 4.4-12.2 months] vs 14.7 months [IQR, 8.7-20.7 months], P = .047), when stratified by the median value (Figure 2).
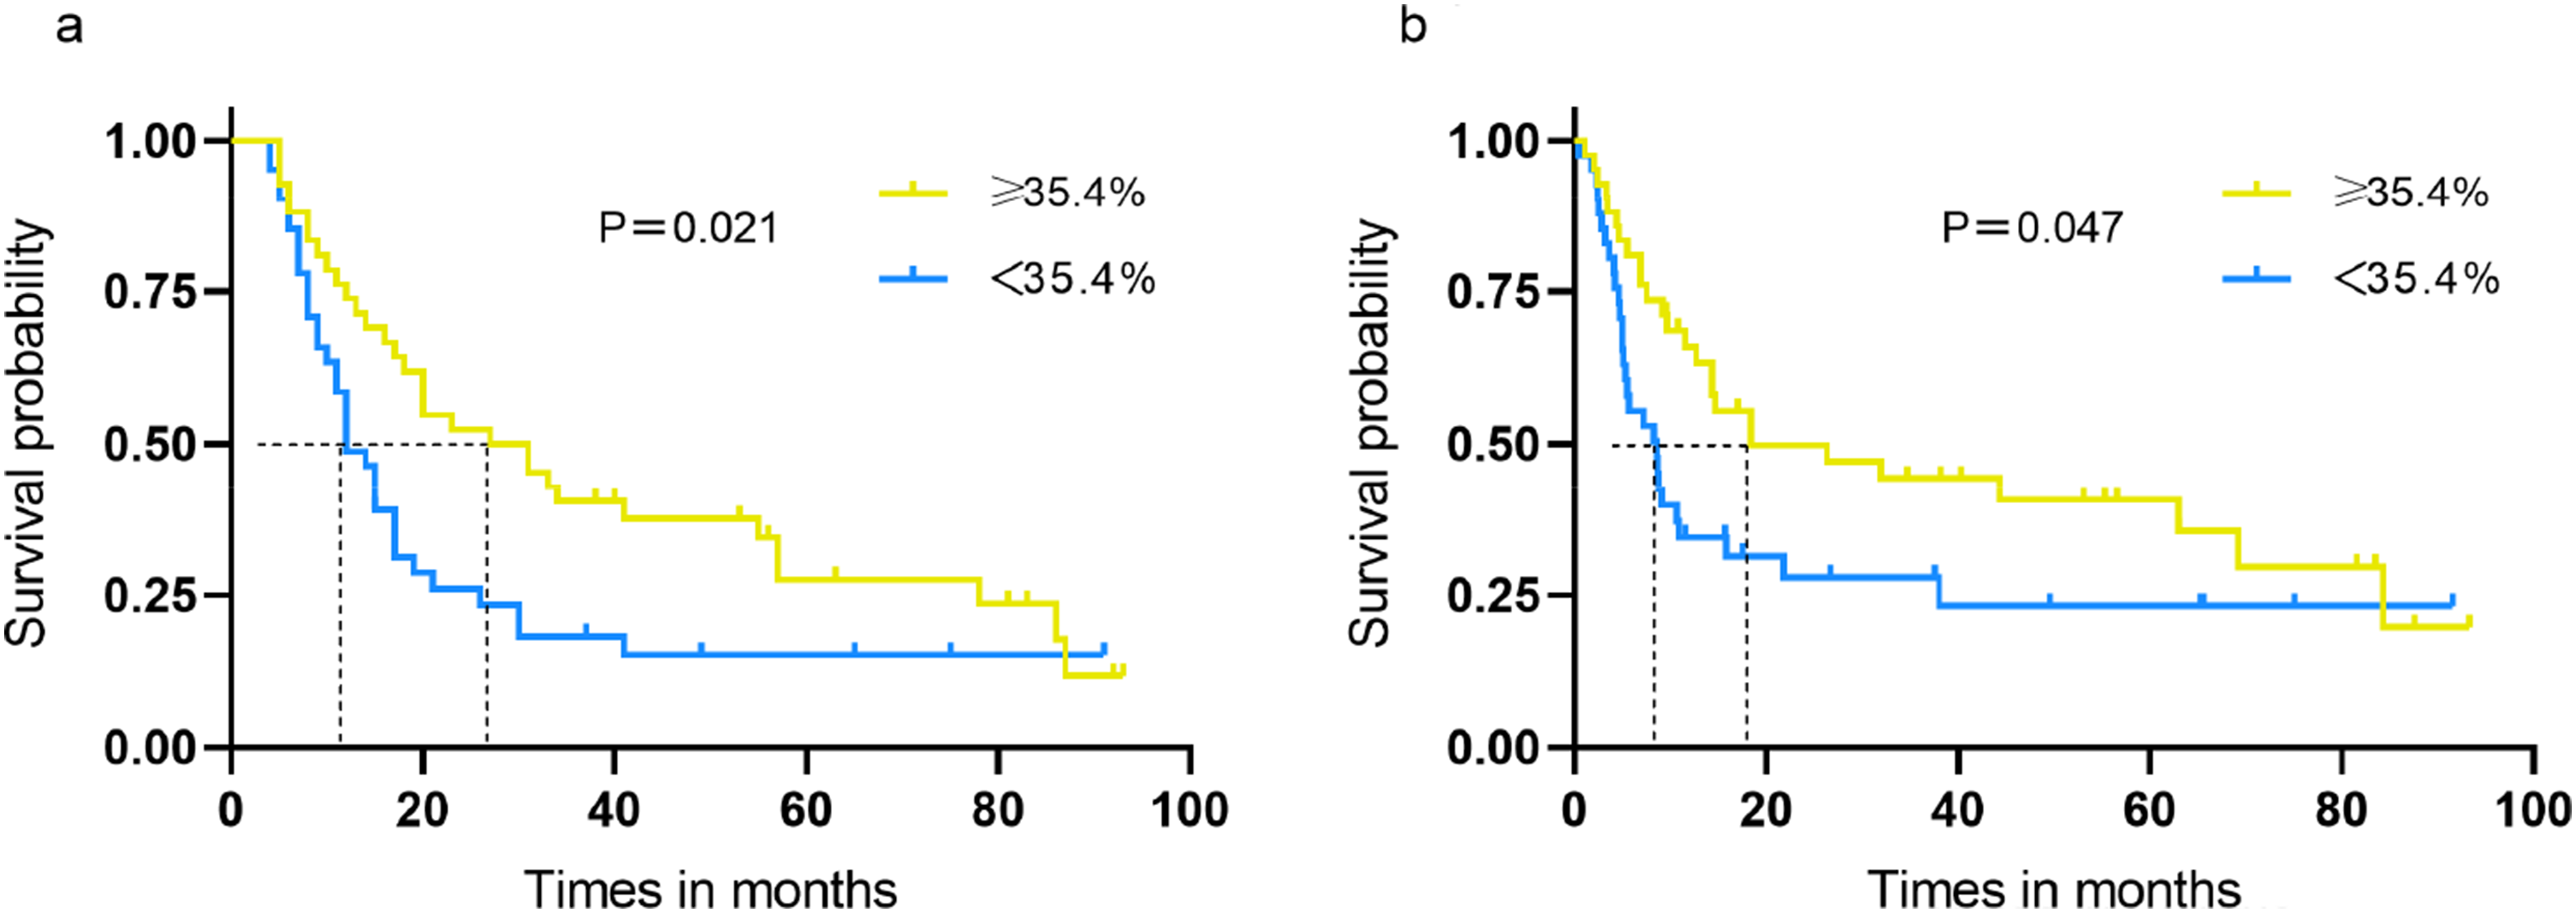
Kaplan-Meier Survival Analysis Disaggregated by CT-ECV (<35.4% vs ≥35.4%) in Subgroups of Resectable PDAC Patients. The Kaplan-Meier Curves Showed Better OS (a) and RFS (b) in Patients with High CT-ECV Group of ≥35.4% Compared to that in Patients with Low CT-ECV Group of <35.4% (OS, 27.9 Months [IQR, 16.6-39.2] vs 12.2 Months [IQR, 9.0-15.4], P = .021, HR:0.968 [0.942, 0.995]; RFS, 14.7 Months [IQR, 8.7-20.7] vs 8.3 Months [IQR, 4.4-12.2], P = .047, HR:0.968 [0.942, 0.994]).
Association between CT-ECV and Clinicopathological Features
Low CT-ECV group was significantly associated with elevated CA19-9, larger tumor size, G3 (tumor grade), and II/III (AJCC tumor stage) (P < .05; Table 4). Representative cases are shown in Figures 3 and 4.
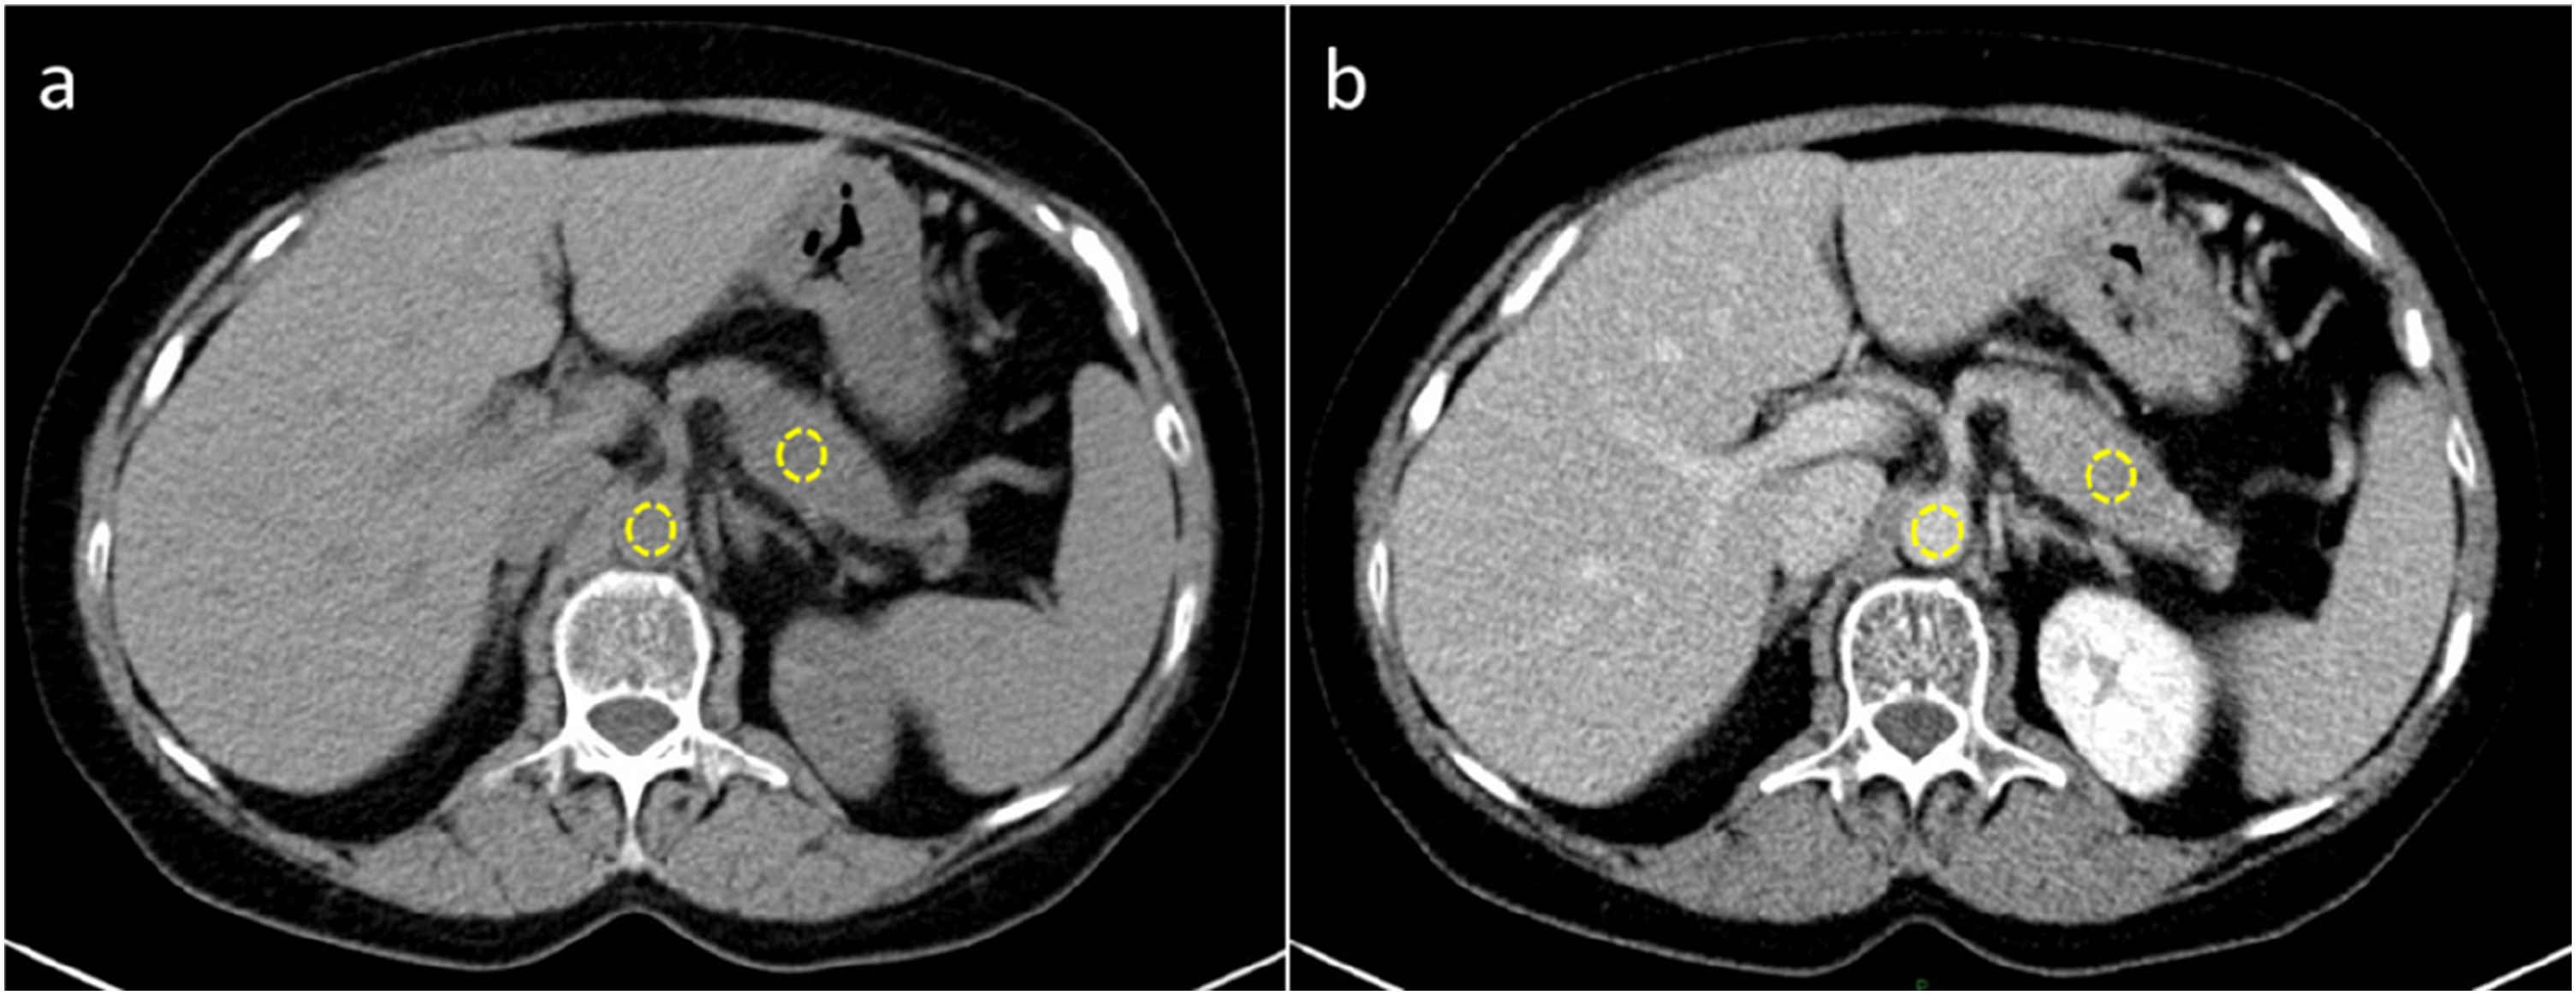
CT Images in a 58-year-Old Woman with Resectable Pancreatic Ductal Adenocarcinoma. Axial Unenhanced (a) and Equilibrium-phase (b) Images Show Regions of Interest (in white) Placed on Tumor in the Pancreatic Head and the Aorta. The CT-ECV was 37.7%. After Standard Distal Pancreatectomy, Patient had Recurrence-free Survival of 63 months and Overall Survival of 92.3 Months.

CT Images in a 54-year-Old Woman with Resectable Pancreatic Ductal Adenocarcinoma. Axial Unenhanced (a) and Equilibrium-phase (b) Images Show Regions of Interest (in white) Placed on Tumor in the Pancreatic Head and the Aorta. The CT-ECV was 12.5%. After Pancreaticoduodenectomy, Patient had Recurrence-free Survival of 7.2 Months and Overall Survival of 19.5 Months.
Association Between CT-ECV and Clinicopathological Features.

ECV, extracellular volume; CA19-9, carbohydrate antigen 19-9. Data are numbers, with percentages in parentheses. The bold value means significant difference (P < .05).
Association between CT-ECV and Tumor Recurrence Pattern
In our study cohort, 13 patients had isolated local recurrence, 42 patients experienced disease progression with distant metastases, and the remaining 28 patients had no recurrence during follow-up. Of the 42 patients with distant recurrence, 20 experienced multiple-site recurrence, followed by liver only (n = 18), bony only (n = 2), or intestine only (n = 2) recurrence. The CT-ECV did not show a significant difference between local recurrence and non-local recurrence groups in isolated local recurrence analysis (P = .455). Patients in low CT-ECV group were more inclined to experience distant recurrence in our analysis of distant recurrence (P = .037). Table 5 presents the detailed information.
Association Between CT-ECV and Tumor Recurrence Pattern.

ECV, extracellular volume. Data are numbers, with percentages in parentheses. The bold value means significant difference (P < .05).
Discussion
In the current study, we measured the CT-ECV using unenhanced and equilibrium contrast-enhanced CT images. We demonstrated that the CT-ECV was an independent prognostic factor for OS and RFS in patients with resected PDAC. Patients were further stratified into high CT-ECV and low CT-ECV groups with significantly different prognosis. Moreover, patients in low CT-ECV group were more inclined to experience distant recurrence after tumor resection. As equilibrium-phase CT images can be easily integrated into routine examinations, the CT-ECV is expected to become a potential prognostic biomarker for risk stratification and treatment guidance in patients with PDAC.
The stroma is now considered fundamental for regulating the initiation and progression of tumors, 18 and the interaction between the tumor epithelium and stroma also plays an important role in shaping tumor architecture and mediating tumor immunity, metabolism, and possibly prognosis.6,19,20 Our study indicated that the CT-ECV was an independent prognostic factor for patients with PDAC, consistent with the results of previous studies.11,12 Moreover, when stratified patients into high and low CT-ECV groups based on the median CT-ECV. Patients in the high CT-ECV group had significantly prolonged OS and RFS compared with those in the low CT-ECV group. The mechanism underlying the association between CT-ECV and prognostic impact is unclear. Several possible explanations are available for this result. Low stromal content and weakened stromal barriers in tumors may promote the infiltration of inflammatory and immune cells, which may directly participate in the formation of intratumoral necrosis. 5 Intratumoral necrosis has been proven to be associated with unfavorable prognosis in patients with PDAC.21,22 In addition, CT contrast agents can freely cross between the intravascular and extravascular extracellular spaces but cannot pass through the intact cell membrane. 6 Therefore, higher CT enhancement is expected in tumors with a higher CT-ECV, in line with Mori's study that demonstrated that resected PDAC with higher tumor enhancement tended to be more fibrotic. 23 As stated previously, PDAC showing higher CT enhancement exhibited lower tumor cellularity and better prognosis than those with PDAC showing lower enhancement. 24
Some researchers have reported that the clinicopathological factors and CT findings of PDAC (ie, tumor stage, peripancreatic tumor infiltration, and adjacent organ invasion) are prognostic factors.24–26 In our study, however, only adjacent organ invasion (HR, 0.453; P = .006) was found to be associated with RFS, except for the CT-ECV in multivariate analysis. This discrepancy may be attributed to the difference in the study populations. Another study also reported that perineural or duodenal invasion is associated with reduced postoperative survival in resectable PDAC patients, in agreement with our results. 26 CA 19-9 is one of the well-known clinical survival predictors for PDAC, with high levels being related to advanced tumor stage and poor outcomes. 27 In our study, however, CA 19-9 was not the prognostic factor in resected PDAC patients. We speculate that some patients have biliary obstruction, which may confuse the prognostic significance of CA 19-9. Moreover, we evaluated the association between the CT-ECV and clinicopathological features. We found that low CT-ECV group was significantly associated with elevated CA19-9, larger tumor size, higher tumor grade and TNM stage, all of which were adverse prognostic factors for PDAC.
Most PDAC patients experience recurrence after surgery due to the presence of micrometastases at the time of resection. 28 However, approximately 20% of patients only show local recurrence and exhibit better prognosis, and adjuvant radiotherapy or repeat resection for these patients can be beneficial.14,15 Detecting a biomarker capable of predicting the recurrence pattern is therefore important. Recent studies indicates that the stroma of PDAC is primarily composed of collagen deposition driven by the activation of pancreatic stellate cells (PSCs), and the degree of PSC activation is associated with tumor aggressiveness. A low CT-ECV may suggest a loose tumor stromal structure and a decline in stromal barrier function, which could facilitate tumor cells detaching from the primary site and metastasizing through the blood or lymphatic systems.7,22 These findings agree with our observation that patients in low CT-ECV group were more inclined to experience distant recurrence after tumor resection. While the CT-ECV did not exhibit a predictive role in local recurrence group, which may be limited by the small sample size. Stephan Skornitzke reported in the study that the iodine concentration and CT values in the venous phase of dual-energy CT (DECT) have potential value in predicting local recurrence of PDAC after surgery and non-specific postoperative soft tissue formation. 29 Yuki Fujiwara constructed an SMA scoring model by combining the distance between PDAC and the superior mesenteric artery (SMA) measured on preoperative CT images with serum CA19-9 levels, which can effectively predict the risk of local recurrence after PDAC surgery. 30 In future research, it is necessary to further investigate local recurrence of postoperative PDAC by leveraging the advantages of DECT and incorporating imaging parameters.
The stromal component can be assessed not only using radiology but also using pathology. Earlier studies have indicated a good correlation between the radiological and pathological measurements of the stromal component, and high stromal component exhibited longer survival time.5,22 The advantage of the CT-ECV is that it can stratify patients based on imaging-based features at the point of care before therapy. More importantly, it applies to both localized and metastatic PDAC patients who receive neoadjuvant therapy but cannot undergo resection. A future direction of this work is to prospectively validate our findings in a phase IV clinical trial for advanced unresectable PDAC patients receiving neoadjuvant chemotherapy, which may provide further evidence that the CT-ECV may help predict the benefits from neoadjuvant treatment.
Our study had limitations. First is the intrinsic limitations of any single-center retrospective study. Further prospective studies with larger data sets are needed to validate and generalize our findings. Second, the CT-ECV was only derived by a single CT technique, and the prognostic value of CT-ECV based on dual-energy CT for postoperative PDAC should be further explored. Third, the CT-ECV was measured on the 3-min equilibrium-phase images. Three minutes may not have reached the sufficient equilibrium state to calculate CT- ECV. However, one recent study showed that there was no statistically significant difference in the CT-ECV measured at 3 and 10 min in assessing the fibrosis grade of the liver. 31 Moreover, the median follow-up time is relatively short for long-term survival analysis, it would be beneficial to include a larger sample size and extend the follow-up period.
Conclusions
In conclusion, we identified a prognostic biomarker on pretherapy, standard-of-care CT images to predict the survival outcomes in patients with resectable PDAC. The CT-ECV, which stratified patients into distinct prognosis groups, would enable more rational risk stratification and personalized care.
Footnotes
Abbreviations
Ethical Considerations and Consent to Participate
The study was approved by the ethics committee of the First Affiliated Hospital of Chongqing Medical University (K2023-356). Owing to its retrospective nature, the institutional review board of the institution provided a waiver of informed consent. The reporting of this study conforms to STROBE guidelines, which is included in Supplemental Materials.
Consent for Publication
All the authors have consented to the publication of this manuscript.
Author Contributions/CRediT
Study Concepts: HWL. Data Acquisition: JX and HTL. Study monitoring: MCJ and YFL. Manuscript Preparation: HWL and XJ. Manuscript Editing and Reviewing: ZWZ and YML. All authors read and approved the final manuscript.
Funding
The author(s) disclosed receipt of the following financial support for the research, authorship, and/or publication of this article: This work was supported by the Chongqing medical scientific research project (Joint project of Chongqing Health Commission and Science and Technology Bureau, grant number: 2025MSXM043).
Conflicting Interests
The author(s) declared no potential conflicts of interest with respect to the research, authorship, and/or publication of this article.