
Abstract
Background
Breast cancer is a prevalent public health concern affecting numerous women globally and is associated with palmitoylation, a post-translational protein modification. Despite increasing focus on palmitoylation, its specific implications for breast cancer prognosis remain unclear. The work aimed to identify prognostic factors linked to palmitoylation in breast cancer and assess its effectiveness in predicting responses to chemotherapy and immunotherapy.
Methods
We utilized the “limma” package to analyze the differential expression of palmitoylation-related genes between breast cancer and normal tissues. Hub genes were identified using the “WGCNA” package. Using the least absolute shrinkage and selection operator (LASSO) Cox regression analysis, we identified a prognostic feature associated with palmitoylation and developed a prognostic nomogram with the “regplot” package. The predictive values of the model for chemotherapy and immunotherapy responses were assessed using immunophenoscore (IPS) and the “pRophetic” package.
Results
We identified 211 differentially expressed genes related to palmitoylation, among which 44 demonstrated prognostic potential. Subsequently, a predictive model comprising eleven palmitoylation-related genes was developed. Patients were classified into high-risk and low-risk groups based on the median risk score. The findings revealed that individuals in the high-risk group exhibited lower survival rates, while those in the low-risk group showed increased immune cell infiltration and improved responses to chemotherapy and immunotherapy. Moreover, the BC-Palmitoylation Tool website was established.
Conclusion
This study developed the first machine learning-based predictive model for palmitoylation-related genes and created a corresponding website, providing clinicians with a valuable tool to improve patient outcomes.
Introduction
Breast cancer, surpassing lung cancer, has become the most prevalent cancer globally, with an estimated 2.3 million new cases each year. 1 It remains the leading cause of cancer-related morbidity and mortality among women worldwide. The etiology of breast cancer is complex, influenced by genetic mutations, hormonal factors, lifestyle choices, and environmental exposure. 2 Advances in molecular typing, diagnostics, and therapeutic strategies have significantly improved breast cancer management. Treatment primarily involves local therapies, including surgery and radiation, and systemic therapies, including chemotherapy, endocrine therapy, targeted therapy, and immunotherapy. 3 Despite significant progress in immunotherapy for breast cancer, its application is currently restricted to patients with triple-negative breast cancer, and its effectiveness as a solitary treatment option remains limited. There is still a need for new prognostic assessment methods that can further predict the clinical prognosis and efficacy of immunotherapy for breast cancer patients.
Palmitoylation, a post-translational modification, plays a crucial role in numerous cellular processes, including protein transport, membrane localization, and signal transduction. 4 It is increasingly recognized as a contributor to the incidence and progression of breast cancer, 5 regulating essential proteins such as estrogen receptor alpha (ERα) 6 and caveolin-1, 7 which are essential for the dynamics of breast cancer. 8 Moreover, palmitoylation is associated with drug resistance, metastasis, and recurrence in breast cancer.9,10 Specifically, the palmitoylation of mTOR by ZDHHC22 inhibits the malignant proliferation of breast cancer cells and increases their sensitivity to tamoxifen endocrine therapy. 9 The inhibition of PD-L1 palmitoylation enhances the T cell immune response against breast cancer, thereby reducing tumor growth. 11 Therefore, targeting palmitoylation presents a promising approach for overcoming tumor immune evasion and addressing challenges such as drug resistance, recurrence, and metastasis in breast cancer. Despite its importance, reliable predictive biomarkers for palmitoylation in breast cancer remain scarce. The development of a model related to palmitoylation could hold clinical significance for predicting the prognosis of breast cancer patients undergoing chemotherapy and immunotherapy.
This novel investigation explored differential expression patterns of genes associated with palmitoylation in breast cancer and normal tissues. Weighted gene co-expression network analysis (WGCNA) was utilized to identify hub genes, followed by enrichment analysis to elucidate their biological functions. A prognostic model was developed using the least absolute shrinkage and selection operator (LASSO) Cox regression analysis based on 11 palmitoylation-related genes for the first time. This model shows strong predictive capacity for survival time, chemotherapy response, and immunotherapy efficacy in breast cancer patients. To enhance prognostic accuracy, the risk score was integrated with relevant clinical characteristics, constructing a prognostic nomogram capable of predicting the survival rate at 1, 3, and 5 years for breast cancer patients. Notably, the BC-Palmitoylation Tool, a web application, has been developed to provide clinicians with prognostic information for breast cancer patients. Although still in its initial stages of deployment, this tool has the potential to enhance personalized treatment strategies for breast cancer significantly. The workflow of this study is illustrated in Figure 1.

Workflow of the study.
Materials and Methods
Data Source and Processing
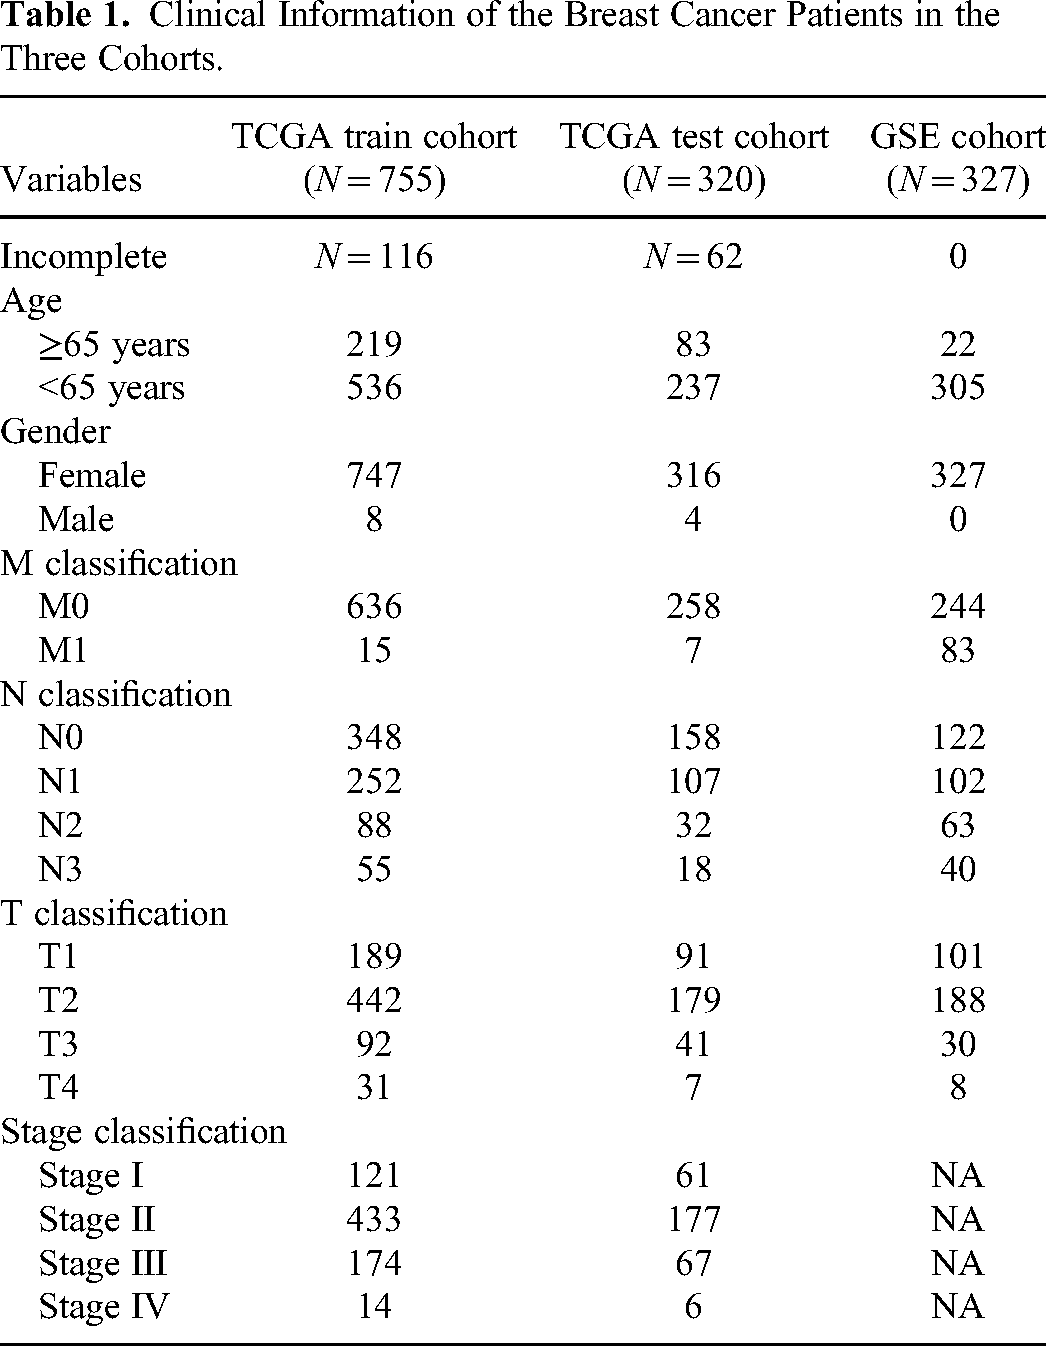
A total of 2239 genes associated with palmitoylation were retrieved from GeneCards (https://www.genecards.org/Search/Keyword?queryString=Palmitoylation). Molecular data relevant to breast cancer patients, such as somatic mutations and gene expression profiles, along with clinical characteristics including gender, age, stage, and survival times, were obtained from the GDC TCGA BRCA (https://xenabrowser.net/datapages/). Ensembl IDs in the gene expression matrix were converted to gene symbols using probe annotation information. The expression matrix was then subjected to quantile normalization through the normalizeBetweenArrays function of the “limma” package. Information for 1075 breast cancer patients was obtained after normal tissue and duplicate samples were excluded. Ultimately, breast cancer patients in the TCGA cohort were divided into a training cohort (n = 755) and a test cohort (n = 320) at a 7:3 ratio using stratified random sampling. The dataset GSE20685 was sourced from the Gene Expression Omnibus (GEO) database (https://www.ncbi.nlm.nih.gov/geo/query/acc.cgi?acc=GSE20685, including 327 breast cancer tissue samples). The details of all cohorts are shown in Table 1.
Clinical Information of the Breast Cancer Patients in the Three Cohorts.
Identification of Palmitoylation-Related Hub Genes
Differential Gene Expression Analysis
Our analysis used the “limma” package in R to conduct differential gene expression analysis between breast cancer and normal samples from the TCGA dataset, applying stringent criteria of |logFC| > 1 and P < 0.05. 12 The comprehensive approach enabled by “limma” included several essential functions: lmFit was utilized to model gene expression, makeContrasts defined group comparisons, contrasts.fit applied these contrasts, eBayes moderated statistical errors, and topTable ranked the differentially expressed genes (DEGs).
Applying WGCNA to Uncover the Hub Palmitoylation Module
The WGCNA algorithm was utilized to establish a co-expression network that identifies palmitoylation-related genes in breast cancer samples. 13 Hierarchical clustering analysis was conducted using the Hclust function from the “WGCNA” package. The pickSoftThreshold function was employed to select an appropriate soft threshold, followed by using the adjacency function to create the neighbor-joining matrix. The TOMsimilarity function computed the Topological Overlap Matrix (TOM) from this matrix, transforming the adjacency matrix into a topological overlap matrix. Gene modules were detected and visualized within the network using the cutreeDynamic function. Ultimately, the correlation between module feature genes and breast cancer was calculated, identifying the most pertinent modules for subsequent analysis.
Enrichment Analyses of Biological Functions
Intersections were made between selected module genes and DEGs. Enrichment analyses were performed on these genes across Kyoto encyclopedia of genes and genomes (KEGG), 14 gene ontology (GO), 15 and disease ontology (DO) 16 domains. The function and pathway terms were retrieved for further visualization in R software.
Construction of a Palmitoylation-Related Prognostic Signature for Breast Cancer
A palmitoylation-related prognostic signature for breast cancer was developed and validated through LASSO Cox regression.
17
Univariate Cox regression analysis using the “survival” package was conducted to determine the prognostic value of these palmitoylation-related genes for overall survival (OS). Prognosis-related genes were identified using a significance threshold of P < 0.01. Cross-validation was performed using the cv.glmnet function to determine the optimal penalty parameter (lambda) for the LASSO model, ensuring robustness and reducing overfitting. A Cox proportional hazards model was subsequently developed using the selected genes to evaluate their impact on patient survival times. Forward and backward stepwise selection methods were employed to refine the model, retaining only the most significant predictors. Risk scores for predicting the risk of adverse outcomes were calculated for each patient using the final Cox model. The risk scores were calculated using the following formula:
Analysis of the Tumor Microenvironment
Gene set enrichment analysis (GSEA) 18 and gene set variation analysis (GSVA) 19 were conducted utilizing gene sets from the “c2.cp.kegg.v7.4.symbols.gmt” available through the MSigDB database (https://www.gsea-msigdb.org/gsea/msigdb/index.jsp). GSEA was performed to compare biological functions between high-risk and low-risk groups using the R packages “limma,” “GSEABase,” “GSVA,” and “pheatmap.” Concurrently, GSVA was employed to quantify variations in gene set activity among different risk groups, utilizing the packages “limma,” “org.Hs.eg.db,” “clusterProfiler,” and “enrichplot.”
We utilized the “estimate” package to assess the stromal and immune cell infiltrates in the tumor microenvironment (TME) by calculating ESTIMATE scores from the normalized expression data. 20 We performed single-sample gene set enrichment analysis (ssGSEA) using the “GSVA” package to derive immune activity scores from the expression data against predefined immune gene sets. These scores were then merged with TME scores and cancer risk data, and visualized using a heatmap to depict variations in immune activity across different risk groups. Immune cell infiltration analysis was conducted using the CIBERSORT tool, 21 which quantified the relative abundances of various immune cell types within the TME across high- and low-risk groups. We performed correlation analyses to understand further the relationship between immune cell infiltration and cancer risk scores.
Prediction of Response to Immunosuppressants and Chemotherapy
From the existing literature, 40 genes linked to immune checkpoints were identified and subsequently analyzed for differential expression across distinct risk groups using the R packages “limma” and “reshape2.” The efficacy of immune checkpoint inhibitors was assessed by the immunephenotypescore (IPS), which serves as a dependable predictor of patient responses to CTLA-4 and PD-1 inhibitors, 22 obtained from the TCIA database (https://tcia.at/). Chemosensitivity was predicted by calculating the 50% inhibitory concentrations (IC50) of each sample employing the “pRophetic” package. 23 The Wilcoxon rank-sum test assessed the statistical significance of the differences in IC50 values between the two groups.
Analysis of Gene Regulation
Expression levels of eleven genes were analyzed for differences between breast cancer and normal tissues within the prognostic model, utilizing R version 4.0.3. The differences in promoter methylation and protein expression levels of these genes were further explored via the UALCAN database (http://ualcan.path.uab.edu/index.html). Moreover, the cBioPortal database was employed to evaluate the copy number variations (CNVs) and their correlation with mRNA expression in these genes.
Developing a Prognostic Risk Nomogram
Clinical features, including age, gender, TNM stage, and stage, were integrated with risk score to construct a prognostic nomogram using univariate and multivariate Cox regression analyses. 24 The “regplot” package was used to visualize this nomogram. To evaluate the predictive accuracy of the nomogram relative to other prognostic factors, ROC curve analysis and decision curve analysis (DCA) were performed using the “timeROC” and “ggDCA” packages, respectively.
Statistical Analysis
Statistical analyses were conducted using R software (versions 4.0.3, 4.1.3 and 4.2.2). The Wilcoxon test was utilized to assess differences between the two groups. Correlation analysis was performed using the Pearson test. Survival curves were created using the Kaplan–Meier method and compared via the log-rank test. A significance threshold was set at P < 0.05.
Results
Hub Genes Associated with Palmitoylation
Differential gene expression analysis identified 211 palmitoylation-related DEGs (Figure 2A). WGCNA was conducted on palmitoylation-associated genes, which categorized 663 genes into five modules (Figure 2B and C). Intersection analysis between the hub genes from the turquoise module, as defined by Pearson correlation coefficients, and the DEGs resulted in a set of 58 significant genes (Figure 2D). KEGG, GO, and DO enrichment analyses were performed to investigate the biological functions of these intersecting genes. KEGG enrichment analysis indicated a pronounced enrichment of these genes in biological pathways related to metabolism and cellular regulation, particularly within the PPAR signaling, regulation of lipolysis in adipocytes, AMPK signaling, and adipocytokine signaling pathways (Figure 2E). GO enrichment analysis further revealed these genes’ potential roles in biological processes such as lipid metabolism and storage, as well as their localization to cellular structures like lipid droplets and the sarcolemma, and activity in molecular functions involving the catalysis of lipid catabolism (Figure 2F). DO enrichment analysis associated these genes with metabolic disorder diseases, such as familial hyperlipidemia, obesity, and type 2 diabetes (Figure 2G).

Identification of palmitoylation-related hub genes. (A) Heatmap of the palmitoylation-related differentially expressed genes (DEGs) between breast cancer and normal tissues. (B) Clustering dendrogram of genes; various colors represent different modules. (C) Relationships between the five modules and sample tissue type. (D) Venn diagram of DEGs and hub genes intersections. (E) Kyoto encyclopedia of genes and genomes (KEGG) enrichment analyses. (F) Gene ontology (GO) enrichment analyses. (G) Disease ontology (DO) enrichment analyses.
Construction of a Palmitoylation-Related Prognostic Signature for Breast Cancer
Univariate Cox regression analysis was conducted with a P-value threshold of <0.01, identifying 44 palmitoylation-related genes associated with clinical outcomes. Subsequently, genes possessing the highest prognostic value were selected through a LASSO Cox regression model, resulting in the choice of 11 candidate genes (PCMT1, KLRB1, DAXX, PDP1, PTPN18, LEF1, CPT1A, DLG3, WLS, ELOVL2, and CBR1) for constructing the model (Figure 3A–D). Risk scores were calculated using coefficients in the formula below:

Construction of a palmitoylation-related prognostic signature for breast cancer. (A) Partial likelihood deviance of the least absolute shrinkage and selection operator (LASSO) regression. (B) LASSO coefficient profiles based on logarithmic (lambda) sequences. (C) Univariate Cox analysis of 11 survival-related genes. (D) Lollipop chart showing the LASSO coefficient of the 11 genes in the model. The distribution of the LASSO coefficients of the genes in the signature. (E–H) In the TCGA train, TCGA test, TCGA all and GEO test datasets, distribution of the patient's risk score, patients’ overall survival time along with their risk score, Kaplan–Meier OS curves, and time-dependent ROC curves for breast cancer patients at 1, 3, and 5 years.
Risk score = PCMT1 × 0.3576917 + KLRB1 × (−0.43603077) + DAXX × (−0.362550914) + PDP1 × 0.254808915 + PTPN18 × (−0.319773106) + LEF1 × (−0.177420729) + CPT1A × 0.214187141 + DLG3 × 0.380288463 + WLS × (−0.189086763) + ELOVL2 × (−0.118885307) + CBR1 × (−0.220853695).
In the TCGA train cohort, the Kaplan–Meier survival curve demonstrated that patients in the low-risk group exhibited significantly higher survival rates and longer survival times than those in the high-risk group. Additionally, ROC curve analysis of this cohort revealed that the predicted AUC values for 1, 3, and 5 years were 0.697, 0.761, and 0.764, respectively, indicating that the model accurately predicts patient survival outcomes (Figure 3E). Consistency in survival curves was observed across the TCGA test cohort, the TCGA all cohort, and the GEO test cohort, with most datasets exhibiting AUC values exceeding 0.7 in ROC curve analyses (Figure 3F–H). The accuracy of this model in predicting patient prognoses was further validated through internal and external cohorts.
Characteristics of the Tumor Microenvironment in the High- and Low-Risk Groups
GSEA and GSVA were employed to identify enriched gene sets across different risk groups. Enrichment in gene sets related to DNA replication, homologous recombination, mismatch repair, protein export, and steroid biosynthesis was observed in the high-risk group. In contrast, the low-risk group was characterized by enriched pathways associated with primary immunodeficiency, T-cell receptor signaling, hematopoietic cell lineage, cytokine–cytokine receptor interaction, and chemokine signaling (Figure 4A). GSVA indicated significant enrichment of pathways related to protein and lipid anabolism in the high-risk group, whereas the low-risk group demonstrated notable enrichment in immune response-related signaling pathways (Figure 4B).

The landscape of immune infiltration. (A) Plots of gene set enrichment analysis for the high- and low-risk groups. (B) Heatmap of gene set variation analysis results for the high- and low-risk groups. (C) Violin plots of the estimate score, immune score, stromal score, and tumor purity in the two groups. (D) Heatmap to evaluate the levels of immune infiltration in the high- and low-risk groups. (E) The proportions of immune cells in the two groups (*P < 0.05, **P < 0.01, ***P < 0.001). (F) Relevance analysis between the risk score and the level of 11 infiltrating immune cells.
The ESTIMATE analysis revealed that the stromal score, immune score, and estimate score were higher in the low-risk group compared to the high-risk group, while the tumor purity showed the opposite trend (Figure 4C). The immune infiltration levels in the high-risk and low-risk groups were assessed, and a heatmap was generated to depict the abundance levels of 29 immune-related cells and molecules (Figure 4D). Further analysis of immune cell infiltration indicated that the low-risk group exhibited more extensive infiltration, including naive B cells, plasma cells, CD8+ T cells, activated memory CD4+ T cells, regulatory T cells (Tregs), γδ T cells, resting natural killer (NK) cells, activated NK cells, and resting dendritic cells; conversely, a higher infiltration of resting memory CD4+ T cells, as well as M0 and M2 macrophages, was observed in the high-risk group (Figure 4E). Correlation analysis demonstrated that risk scores were negatively associated with naive B cells, resting dendritic cells, activated NK cells, plasma cells, CD8+ T cells, γδ T cells, activated memory CD4+ T cells, and regulatory T cells (Figure 4F).
Assessing the Model's Ability to Predict Immunotherapy and Chemotherapy Effectiveness
The expression levels of 36 immune checkpoint-related genes were compared between different risk groups, revealing that all genes were significantly upregulated in the low-risk group (Figure 5A). To evaluate the potential clinical efficacy of immune checkpoint inhibitors (ICIs), we utilized IPS scores to analyze immune infiltration in the tumors of both groups. The results demonstrated that IPS scores based on CTLA-4 or PD-1 status were higher in the low-risk group, suggesting that patients in this group may exhibit better therapeutic responses to ICIs (Figure 5B). Furthermore, differences in sensitivity to common chemotherapeutic agents and targeted drugs between the two groups were investigated. Compared to patients in the high-risk group, those in the low-risk group exhibited relatively lower IC50 values for drugs such as gemcitabine, doxorubicin, docetaxel, vinblastine, vinorelbine, paclitaxel, methotrexate, and gefitinib (Figure 5C). These findings indicate greater sensitivity to chemotherapeutic drugs in the low-risk group.

Predicting responsiveness to immunotherapy and chemotherapy. (A) Expression of 36 immune checkpoint genes in the high- and low-risk groups. (B) The immunophenoscore (IPS) was based on the presence of CTLA-4 or PD-1. (C) Anticipating drug responsiveness in high- and low-risk groups.
Expression, Methylation, and Genetic Mutation Analysis of Prognostic Model Genes
The expression levels of 11 genes in the prognostic model were analyzed, revealing that the expression levels of PCMT1, DAXX, PTPN18, LEF1, and DLG3 were significantly higher in breast cancer tissues compared to normal tissues, while the expression levels of KLRB1, PDP1, and WLS were lower in breast cancer (Figure 6A). Promoter methylation plays a crucial role in regulating gene expression during the initiation and progression of tumors. Consequently, the methylation levels of these genes’ promoters were analyzed and compared between breast cancer tissues and normal tissues (Figure 6B). In breast cancer, only the promoter methylation level of DLG3 was significantly lower, whereas those of WLS, ELOVL2, PTPN18, LEF1, and CBR1 were notably higher, with no significant differences observed in the remaining five genes. Subsequently, the protein expressions of these 11 genes were analyzed, revealing that in breast cancer, the protein expression of PCMT1, PDP1, PTPN18, WLS, and CBR1 was significantly reduced, whereas that of DLG3 was markedly increased (Figure 6C).

Expression and methylation analysis of prognostic model genes. (A) The expression distribution of 11 genes in breast cancer tissue and normal tissue. *P < 0.05, **P < 0.01, ***P < 0.001, −P no statistically significant. (B) Promoter methylation levels of WLS, ELOVL2, DLG3, PTPN18, LEF1, and CBR1 in breast cancer. (C) The protein levels of PCMT1, DLG3, PDP1, PTPN18, WLS, and CBR1 in breast cancer.
The mutation frequencies of 11 genes in breast cancer were analyzed, uncovering that PDP1 and CPT1A exhibited the highest mutation frequencies, followed by ELOVL2, KLRB1, WLS, PCMT1, DAXX, CBR1, LEF1, PTPN18, and DLG3 (Supplementary Figure S1A and S1B). Apart from PTPN18 and DLG3, which primarily presented mutations, most mutations were identified as amplifications. A correlation analysis was conducted between CNVs and gene expression to explore their association. As shown in Supplementary Figure S1C, the expression levels of PCMT1, DAXX, PDP1, PTPN18, CPT1A, WLS, and CBR1 were significantly influenced by copy number changes, whereas the expression of KLRB1, LEF1, DLG3, and ELOVL2 showed minimal correlation with copy number changes (no statistical difference in P-values).
Building a Predictive Probability Nomogram
To investigate the independence of the model's effect, a Cox analysis was performed on the TCGA dataset, integrating the risk score with clinical characteristics such as age, gender, and stage. Univariate Cox analysis revealed significant associations between M, N, T, age, stage, and the risk score with OS in breast cancer patients (Figure 7A). However, in the multivariate Cox analysis, only age and the risk score emerged as independent prognostic factors (Figure 7B, all P < 0.001). Subsequently, a nomogram was developed to predict the 1-year, 3-year, and 5-year survival rates of breast cancer patients (Figure 7C). Calibration plots demonstrated the excellent predictive accuracy of the nomogram, as it closely approximated the ideal curve and exhibited high stability (Figure 7D). Furthermore, according to ROC analysis, the nomogram showed greater accuracy in predicting OS compared to other features (Figures 7E–G). DCA also indicated that the net benefit of the nomogram surpassed that of any single clinical feature alone (Figures 7H–J). Therefore, our nomogram demonstrates significant predictive value and may have practical implications for clinical decision-making.

Construction of the nomogram. (A) Univariate forest plot for clinical features and the risk score. (B) Multivariate forest plot for clinical features and the risk score. (C) Establishment of a nomogram to predict prognostic risk. (D) The nomogram calibration curve. (E–G) Receiver operating characteristic (ROC) analysis of the nomogram, clinical features, and risk score at 1, 3, and 5 years. (H–J) Decision curve analysis (DCA) of the nomogram for predicting 1-, 3-, and 5-year overall survival.
Website Application
The final prognostic nomogram model was implemented within a web-based application. The primary purpose of this application is to provide a visual representation and prognostication of the OS rates of breast cancer patients over 1-, 3-, and 5-year periods. To achieve this, the application incorporates various input parameters, including the patient's gender, age, stage, TNM stage, and gene expression levels associated with prognostic characteristics. Furthermore, the tool can predict the responses of individuals to chemotherapy and immunotherapy. The application offers valuable insights into the expected treatment responses by leveraging these parameters. For convenient access, the application is available online at the following URL: http://demo.dlhwg.com/cox-h/cox-h.html (Figure 8). Users can readily access and utilize its features through this platform.

Website application of the BC-palmitoylation tool.
Discussion
According to data from the International Agency for Research on Cancer (IARC) of the World Health Organization (WHO), breast cancer became the most common cancer worldwide for the first time in 2020. Breast cancer also remains the leading cause of cancer-related deaths among women. 1 Despite advances in medical technology, the treatment of breast cancer presents a significant challenge in the field of oncology due to its phenotypic and genotypic heterogeneity, which often leads to drug resistance, metastasis, and recurrence. Palmitoylation is a post-translational modification that plays a crucial role in various cellular processes, including membrane localization, protein transport, and signal transduction. There is growing evidence that palmitoylation significantly impacts breast cancer development and progression, as well as drug resistance, metastasis, and recurrence. For instance, Huang et al reported that ectopic expression of ZDHHC22 inhibits the malignant proliferation of breast cancer cells and restores their sensitivity to tamoxifen treatment by palmitoylating mTOR. 9 PD-L1, known for its role in the immune evasion strategy of cancer cells, plays a key role in suppressing the immune response. Yao et al reported that targeted inhibition of PD-L1 palmitoylation enhances the immune response of T cells to breast cancer, thereby inhibiting tumor growth. 11 Palmitoylation modifications exert regulatory control over T-cell activation and tumor immunity through their impact on the stability, cellular localization, and function of PD-L1. Furthermore, the retention of CD44 palmitoylation within lipid rafts, which decreases its binding to the migration binding partner ezrin, was found to exert an inhibitory effect on the migration of breast cancer cells. 10 Despite recognizing the crucial role of palmitoylation in breast cancer, the molecular markers associated with palmitoylation are still not fully understood. In this study, we aimed to address this gap by developing a predictive model for the survival of breast cancer patients in the TCGA cohort. The predictive accuracy of the model was internally validated using TCGA data and externally validated using GEO data (GSE20685). We generated an alignment diagram that included age, gender, TNM stage, stage, and risk score. The results consistently demonstrate the model's high performance and potential clinical utility.
GSEA was performed between the high- and low-risk groups, revealing significant enrichment of DNA replication, homologous recombination, mismatch repair, protein export, and steroid biosynthesis in the high-risk group. In contrast, the chemokine signaling pathway, cytokine–cytokine receptor interaction, hematopoietic cell lineage, primary immunodeficiency, and T-cell receptor signaling pathway were enriched in the low-risk group. Notably, the chemokine signaling pathway plays a crucial role in immune system function, as it regulates the recruitment and activation of immune cells in response to infections or inflammation. 25 Similarly, the T-cell receptor signaling pathway is pivotal in the adaptive immune response. 26 Compared to the high-risk group, the low-risk group exhibited higher immune scores, stromal scores, and estimate scores, as well as lower tumor purity. The infiltration of immune cells such as B cells, CD8+ T cells, CD4+ T cells, γδ T cells, NK cells, and dendritic cells increased in the low-risk group, and the infiltration of these cells was negatively correlated with the risk score. Immune cells, critical components of the TME, can either inhibit or promote tumor growth. 27 NK cells and CD8+ T cells are the primary effector cells of the antitumor immune response and can kill tumor cells. 28 Nevertheless, the depletion of CD8+ T cells in tumors leads to the loss of killing effects. 29 CD4+ T cells, previously thought to primarily assist in regulating the function of other immune cells such as CD8+ T cells, have now been shown to possess direct antitumor activity. 30 Although a small subgroup, γδ T cells exhibit the strongest tumor-killing effect among T cells and can recognize and destroy tumors earlier. 31 B cells can exert their antitumor effect through antibody-mediated cytotoxicity and complement activation. 32 Dendritic cells are the most powerful antigen-presenting cells and can stimulate T-cell proliferation and activation to kill tumor cells. 33 M2 macrophages, a major component of the TME, promote tumor cell growth, invasion, metastasis, and angiogenesis through various pathways, participate in tumor immune escape, and inhibit the antitumor effect of T cells. 34 In this research, the infiltration of M0 and M2 macrophages was greater in the high-risk group than in the low-risk group. Furthermore, we investigated the correlation between the risk score and the response to immune checkpoint inhibitors and chemotherapy drugs. Our findings indicate that the low-risk group is more responsive to immunotherapy and chemotherapy than the high-risk group, potentially due to their enhanced antitumor immune activity.
Through this study, a comparative analysis was performed on the mRNA and protein expression levels of 11 palmitoylation-related genes (PDP1, CPT1A, ELOVL2, KLRB1, WLS, PCMT1, DAXX, CBR1, LEF1, PTPN18, and DLG3) in breast cancer tissues compared to normal tissues. In addition, the promoter methylation levels and CNVs of these genes were investigated. The objective was to identify potential biomarkers and therapeutic targets for breast cancer. Furthermore, the analyses of promoter methylation and CNVs provided deeper insights into the molecular mechanisms underlying the development and progression of breast cancer.
CPT1A, essential for fatty acid metabolism, is implicated in the progression of several malignancies, including breast cancer, prostate cancer, and lymphoma. 35 Elevated CPT1A levels, as demonstrated in this study, correlate with poorer breast cancer outcomes, substantiating its role in cancer prognosis. DLG3, encoding a protein in the membrane-associated guanylate kinase (MAGUK) family, 36 is posited as a tumor suppressor. Its overexpression has been shown to inhibit malignant cell proliferation, invasion, and migration. 37 PDP1 is critical for regulating cellular metabolism through the dephosphorylation and activation of the pyruvate dehydrogenase complex. PCMT1, an essential enzyme for protein repair, is significantly more expressed in breast cancer cells than in normal cells, and its overexpression correlates with enhanced growth and migration. 38 ELOVL2, essential for synthesizing very long-chain fatty acids, acts as a tumor suppressor by reducing breast cancer metastasis and endocrine therapy resistance.39,40 Our analysis revealed that methylation levels of the ELOVL2 promoter are higher in breast cancer tissues compared to normal tissues. Nevertheless, no significant differences in mRNA and protein expression levels were detected between the two groups. This suggests that the tumor-suppressive function of ELOVL2 is epigenetically regulated rather than via transcriptional or translational mechanisms. KLRB1, also known as CD161, encodes the protein killer cell lectin-like receptor subfamily B member 1, which is expressed on NK cells and some T cells and plays a role in immune recognition and activation. 41 In our analysis, KLRB1 expression was significantly reduced in breast cancer tissues compared to normal breast tissue. Notably, higher KLRB1 expression was associated with improved prognosis in breast cancer patients. WLS, encoding a protein crucial for the Wnt signaling pathway, which governs cell growth, differentiation, and development, is dysregulated in various diseases, including cancer.42,43 This investigation demonstrated that both mRNA and protein levels of WLS were significantly lower in breast cancer tissues compared to adjacent non-cancerous tissues, potentially linked to promoter hypermethylation. DAXX, a multifunctional protein, participates in DNA repair, apoptosis, and transcription regulation. 44 Our findings indicate significantly higher mRNA levels in cancerous tissues, with no notable differences in protein levels or promoter methylation between the tissues. PTPN18, a gene involved in cell growth and differentiation, has been shown to inhibit breast cancer metastasis. 45 We assessed mRNA expression and promoter methylation of PTPN18 in breast versus normal tissues, finding significantly higher levels in cancerous tissues with lower protein levels. LEF1, a protein in the Wnt signaling pathway, influences cell proliferation, differentiation, and survival. 46 Associated with breast cancer, LEF1 may enhance tumor growth and metastasis. In this investigation, increased mRNA expression and promoter methylation levels of LEF1 were observed in breast cancer tissues compared to normal tissues, while protein levels showed no significant difference. CBR1 encodes an enzyme critical for metabolizing various drugs and exogenous substances. 47 This study found higher CBR1 promoter methylation and lower protein levels in breast cancer tissues, with no significant differences in mRNA expression compared to normal tissues.
These insights collectively enhance our understanding of the molecular mechanisms involved in breast cancer, offering potential targets for therapeutic intervention and improving prognostic assessments. However, this study has some limitations, mainly the retrospective nature of the analysis and reliance on public datasets such as TCGA and GEO. The retrospective design limits our ability to establish causality and might affect the extrapolation of the results to broader clinical practices. Furthermore, the public datasets predominantly feature more prevalent or better-documented subtypes, potentially introducing biases that skew our analysis and affect the generalizability of our model across less common subtypes. While we have strived to mitigate these issues by conducting rigorous statistical analyses, the inherent limitations of the data source cannot be completely overcome. Recognizing these factors is crucial for interpreting the results accurately and applying our findings in clinical settings.
Conclusion
In summary, this study significantly advances our understanding of the prognostic implications of palmitoylation-related genes in breast cancer, highlighting the potential of these molecular markers to predict clinical outcomes and guide personalized treatment strategies. A robust prognostic model has been developed and integrated into a nomogram, effectively predicting survival and treatment responses. This model is accessible through the BC-Palmitoylation Tool, facilitating its clinical application. Despite its reliance on retrospective data, the findings offer a promising direction for improving clinical management and patient outcomes in breast cancer. Prospective studies and more diverse datasets are required to validate these findings further and ensure their applicability across various demographic and genetic backgrounds.
Supplemental Material
sj-doc-1-tct-10.1177_15330338241263434 - Supplemental material for Insights into a Machine Learning-Based Palmitoylation-Related Gene Model for Predicting the Prognosis and Treatment Response of Breast Cancer Patients
Supplemental material, sj-doc-1-tct-10.1177_15330338241263434 for Insights into a Machine Learning-Based Palmitoylation-Related Gene Model for Predicting the Prognosis and Treatment Response of Breast Cancer Patients by Hongxia Zhu, Haihong Hu, Bo Hao, Wendi Zhan, Ting Yan, Jingdi Zhang, Siyu Wang, Hongjuan Hu and Taolan Zhang in Technology in Cancer Research & Treatment
Footnotes
Author Contributions
All authors participated in data acquisition. T.-L.Z., H.-J.H., H.-X.Z., and H.-H.H. contributed to the conception and design of the study. T.-L.Z., H.-J.H., H.-X.Z., H.-H.H., B.H., W.-D.Z., T.Y., S.-Y.W. and J.-D.Z performed the data analysis and interpretation. T.-L.Z., H.-J.H., H.-X.Z. and H.-H.H. contributed to the drafting and revision of the manuscript. All authors have read and agreed to the published version of the manuscript.
Data Availability Statement
All raw data used in this work can be obtained from the GEO with accession number GSE20685 (https://www.ncbi.nlm.nih.gov/geo/). Additional data and materials are available from the University of California, Santa Cruz (UCSC) Xena browser (![]() ).
).
Declaration of Conflicting Interests
The authors declared no potential conflicts of interest with respect to the research, authorship, and/or publication of this article.
Funding
The authors disclosed receipt of the following financial support for the research, authorship, and/or publication of this article: The present study was supported by the National Natural Science Foundation of China (grant number 82003802), the Natural Science Foundation of Hunan Province (grant number 2019JJ50542 and 2023JJ50156), the Science and Technology Program of Hunan Health Commission (grant number 20201978), the China Scholarship Council (grant number 201808430085), Clinical Research 4310 Program of the First Affiliated Hospital of the University of South China (grant number 20224310NHYCG04), the Science and technology innovation Program of Hengyang City (grant number 202250045223).
Informed Consent Statement
Given that our research exclusively entailed the analysis of de-identified patient data, the requirement for individual patient consent was waived.
Institutional Review Board Statement
The need for ethical review and approval was waived due to the nature of our research, which solely encompassed the analysis of anonymized patient data without employing any identifiable individual information.
Supplemental Material
Supplemental material for this article is available online.
References
Supplementary Material
Please find the following supplemental material available below.
For Open Access articles published under a Creative Commons License, all supplemental material carries the same license as the article it is associated with.
For non-Open Access articles published, all supplemental material carries a non-exclusive license, and permission requests for re-use of supplemental material or any part of supplemental material shall be sent directly to the copyright owner as specified in the copyright notice associated with the article.