
Abstract
Introduction
The age-normalized incidence rate of nasopharyngeal carcinoma (NPC) in southern China, Southeast Asia, and North Africa ranges from 4 to 25 cases per 100,000 people. This rate is approximately 50 to 100 times higher than that observed in other regions of the world. Radiotherapy stands as a primary treatment for nasopharyngeal carcinoma.1,2 However, the early side effects of radiotherapy, such as xerostomia, can significantly impact the quality of life of patients. Despite advancements in radiotherapy technology, the salivary glands remain particularly susceptible to radiation compared to other organs. The decrease in salivary secretion induced by radiation to the salivary glands is the predominant factor contributing to xerostomia during radiotherapy. Approximately 63% to 93% of patients will have irreversible salivary gland damage. 3 The common symptoms of salivary gland injury include dry mouth, oral discomfort, and taste change, among other symptoms. The early identification and treatment of xerostomia can reduce the discomfort of patients during treatment to improve long-term survival and future quality of life. 4 As the largest salivary gland, the parotid gland produces approximately 60% of saliva, which plays an important role in the secretion of saliva. 5 Therefore, damage to the parotid gland during radiotherapy will lead to acute irradiation-induced xerostomia. 6 Thus, it is important to evaluate the changes in the parotid gland during radiotherapy and the acute irradiation-induced xerostomia. It has been reported that the salivary secretion of the parotid gland is closely associated with the morphological and vascular changes induced by radiotherapy. 7 These changes may be due to the loss of acinar cells and the replacement of adipose tissue components.8,9
Due to the advantages of non-invasiveness, imaging techniques such as computed tomography (CT) and magnetic resonance imaging (MRI) have been employed to investigate radiation-induced damage to human salivary glands. With ongoing advancements in imaging technology, the iodine map has emerged as a novel CT scanning procedure within the realm of energy spectrum CT. By decomposing the image with iodine as the basis, contrast agents concentrate within the blood vessels to quantify iodine concentration. Consequently, this approach can offer valuable assistance in clinical diagnosis. 10 Therefore, the purpose of this study was to use normalized iodine concentration (NIC) of energy spectrum CT iodine maps to evaluate the changes in the parotid gland during radiotherapy and the occurrence of acute irradiation-induced xerostomia during radiotherapy.
Materials and Methods
Patients
This is a single-center prospective study with complete follow-up and no missing data. The reporting of this study conforms to STROBE guidelines. 11 From October 2021 to March 2022, the follow-up tracking time is from the start of hospitalization to the completion of radiation therapy. Patients are randomly selected and willingly participate in this energy spectrum CT examination project. They have confirmed verbal and written informed consent. Simultaneously, we have omitted the identification of detailed information for all patients. We analyzed the energy spectrum CT iodine maps of 28 patients with nasopharyngeal carcinoma who were first diagnosed by the radiotherapy department of our hospital and obtained data on the parotid gland iodine concentration of the selected patients. This study included 19 males and 9 females. The 28 patients received 4 stages of energy spectrum CT iodine maps (0 fraction, 10 fraction, 20 fraction, and 30 fraction). Patient characteristics are summarized in Table 1. Fujian Medical University Affiliated Union Hospital Ethics Committee has approved this research. Ethics Approval Number for Research Project: 2022KY197. Flow diagram can be seen in Figure 1.
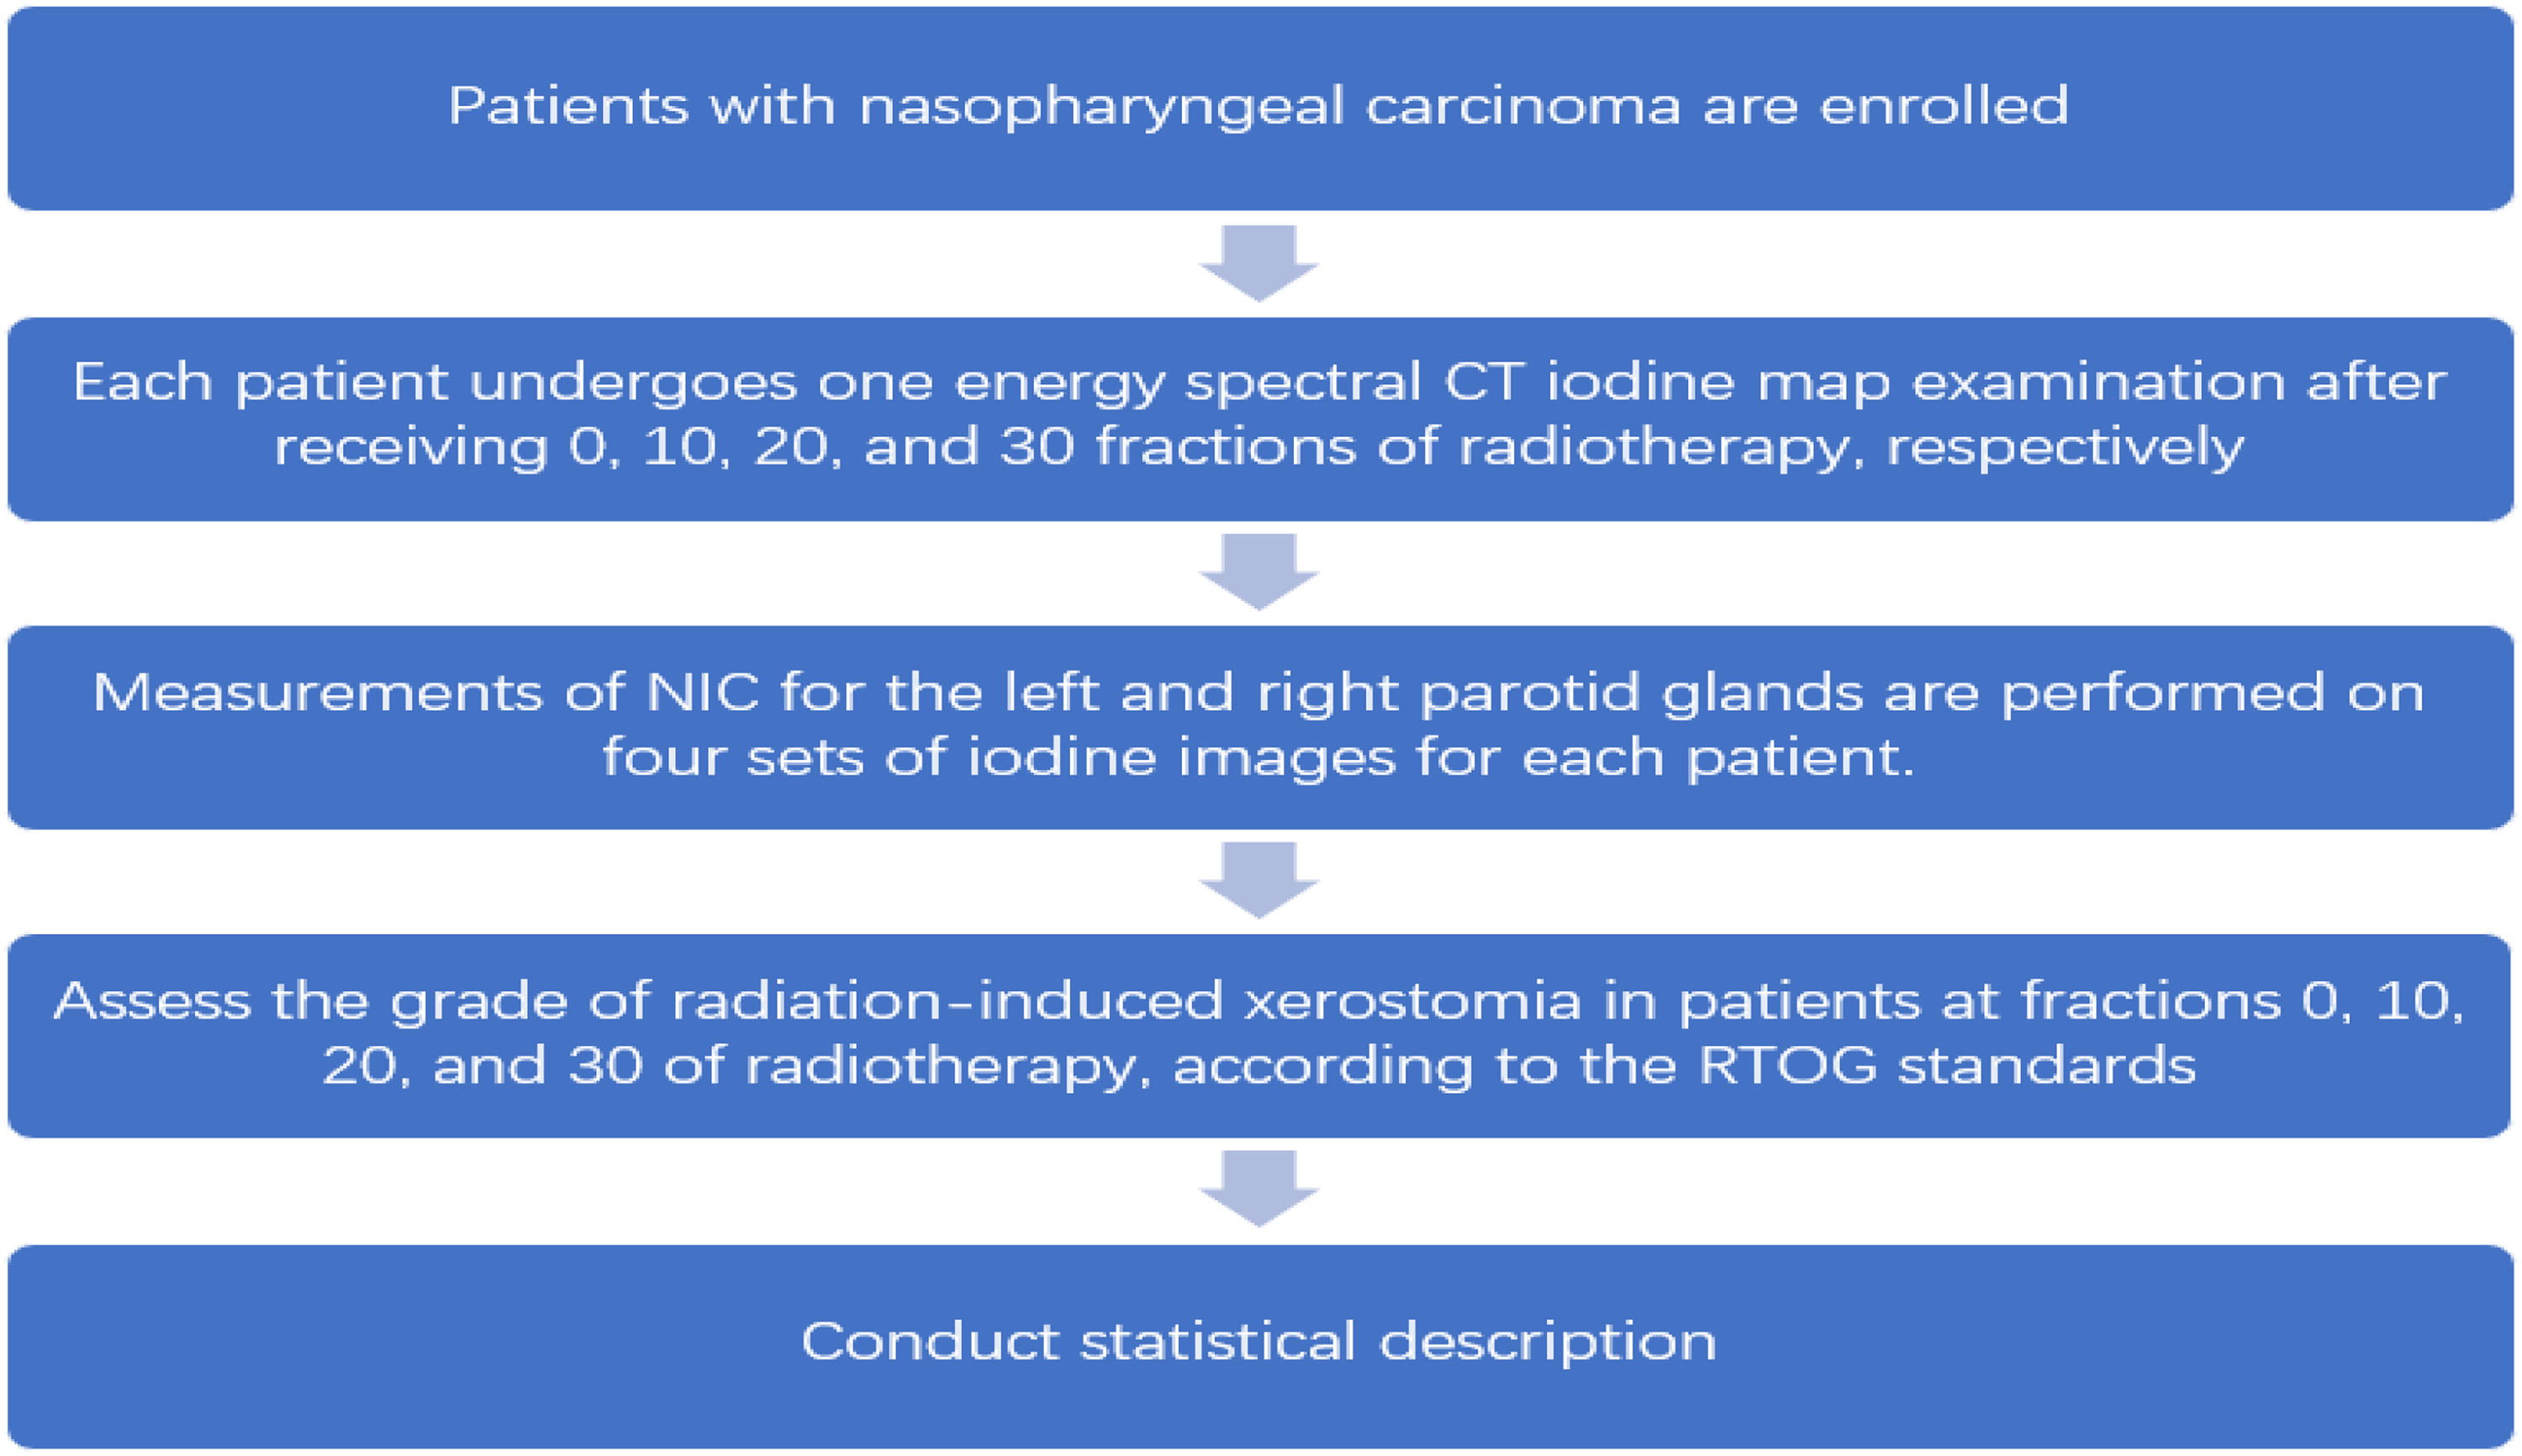
Flow diagram.
Basic Characteristics of Patients.

Image Acquisition
All the patients had 4 groups of CT images collected at the 0 fraction, 10 fraction, 20 fraction, and 30 fraction during radiotherapy. The CT examinations were performed on energy spectrum CT (Revolution CT, GE Healthcare, Milwaukee, USA). The nonionic contrast agent loverol (60 ml at 350 mg/ml) was injected into the median cubital vein through a double barrel high-pressure syringe (Medrad, Stellant, Bayer) at the expected flow rate of 4 ml/s, after which 30 ml normal saline was injected. The scanning range included the area from the apex of lungs to the top of the skull. Enhanced scanning utilized the energy spectrum (GSI) mode at 80 kVp/140 kVp instantaneous switching. For scanning parameters, the tube current was 275 mA, the detector width was 80 mm, the pitch was 0.9:1, and the rotation time was 0.8 s; in addition, the SFOV selected the large body, the DFOV was 20 cm, the iterative reconstruction was ASIR-V40%, and MAR (metal artefact reduction) technology was used to remove artefacts. The scanning was monitored by the threshold trigger technology, and the region of interest (ROI) was set at the ascending aorta level. When the monitoring threshold reached 150 HU, scanning was delayed for 5 s to obtain the data at the parotid artery phase, after which the data at early venous phase and late venous phase were collected at 45 and 65 s, respectively. Then another set of data was recorded in the 120 s delay phase. The 4 groups of scanning data were reconstructed in order to obtain the NIC, and the reconstruction layer thickness/layer spacing was 1.25 mm.
In total, we collect 4 groups of data, each corresponding to a specific radiotherapy fraction (0, 10, 20, and 30). Within each group, the data contains 4 measurements from artery phase, early venous phase, late venous phase 65 s, and delay phase.
Delineation and the Dose to Target Volumes and Organs at Risk
GTV-T was defined as the primary tumor area of the nasopharynx that was clinically and radiologically observed, and GTV-N was defined as the enlarged lymph node that was clinically and radiologically observed. PGTV-T is a GTVnx that extends outwards by 3 mm, and PGTV-N is a GTVnd that also extends outwards by 3 mm. CTV 1 is defined as a high-risk clinical target area, and CTV 2 is defined as a low-risk clinical target area. Furthermore, each CTV extends 3 mm to the corresponding planned target volume (PTV) while ensuring that the edge is at least 1 mm from the skin. The radiotherapy plan is customized on the Eclipse planning system, which is divided into 33 fractions with a total of 68 Gy. Moreover, PTV1 and PTV2 accept 60 and 54 Gy, respectively. OAR uses the following dose limits: Brain Stem D max < 54 Gy, Lens D max < 10 Gy, Optic Nerve D max < 54 Gy, Spinal Cord D max < 45 Gy, Temporomandibular Joint D max < 60 Gy, Inner Ear D max < 60 Gy, Parotid Gland V30 < 50%, and Oral Cavity V40 < 30%.
Grades 0, 1, 2, 3, and 4 were assigned according to the radiation therapy oncology group (RTOG) acute irradiation-induced xerostomia evaluation standards. The grade 0 standard is no change; The grade 1 standard is mild mouth dryness/slightly thickened saliva/may have such as metallic taste/these changes not reflected in alteration in feeding behavior; The grade 2 xerostomia refers to mild to complete xerostomia/thicky, sticky saliva/markedly altered taste in taste; grade 3 xerostomia is further exacerbated; The grade 4 xerostomia is acute necrosis of the salivary glands.
Iodine Concentration Measurement Method
The GSI software of the AW4.7 workstation was used to process the original image to obtain the energy spectrum attenuation curve, and the iodine map. All the ROI measurements were performed at the maximum diameter of the parotid gland cross-section. Moreover, the ROI area was approximately 2/3 of the area of the parotid gland largest layer. Two radiologists took measurements separately, and if the results were different, it would be decided by the higher-level radiologist. The ROI iodine concentration on the iodine map was measured 3 times, avoiding the adjacent blood vessels and the average concentration was calculated (Figure 2). The iodine concentration ratio of the arterial phase and vein was calculated to eliminate the bias caused by other factors, with the NIC calculated as iodine concentration (ROI)/iodine concentration (adjacent blood vessels). These operations can be replicated by other radiotherapy centers.

The measurement process of patient iodine concentration. One parotid gland is shown as an example. One patient had the iodine value of the parotid gland measured at the arterial phase, early venous phase, late venous phase, and delayed phase. The ROI was as large as possible, which accounted for approximately 2/3 of the parotid gland. The iodine value is provided by the postprocessing workstation.
Statistics
SPSS (IBM SPPS statistics for Windows version 26.0, Armonk, NY, USA, IBM Corporation) and R.4.2.1 were used to perform the statistical analysis.
In this study, we conducted the analysis separately for the left, right, and both parotid glands, in which we took the sum of NIC at both grands as the overall NIC in the analysis of both parotid glands. The NIC values were evaluated at 4 different enhancement phases (arterial phase, early venous phase, late venous phase, and delayed phase). At the first step, we selected the phase that had the most significant reduction in iodine concentration when comparing the measurements at the 0 fraction and the 30 fraction. For each phase, a one-sample Wilcoxon test was conducted on the paired differences of the iodine measurements to examine whether the amount of decrement was different from zero. The phase with significant test result (P < .001) was selected, and we consider this specific phase with a better ability to detect xerostomia in this study.
Building on the data from the selected phase, we further investigated the relationship between the NIC and the number of radiotherapy fractions. For each patient, we calculated the 3 NIC differences defined as


Further, we analyzed the correlation between NIC and the grades of xerostomia by the Spearman's rank correlation coefficient to verify the change of xerostomia during radiotherapy treatments. The coefficient was calculated separately for the left and the right parotid gland.
At the final step, we separately built a logistic regression model for the left, right, and both parotid glands based on the pooled data measured at the all the 4 fractions, where xerostomia (with a RTOG grade larger than 0) was used as the binary response, and the iodine concentration was the predictor. A suggested iodine concentration value to identify xerostomia was selected from the receiver operating characteristic (ROC) curve by the Youden's rule.
Results
The summary statistics for NIC of the 28 patients at 0 fraction, 10 fraction, 20 fraction, and 30 fraction are listed in Table 2.
Normalized Iodine Concentration.

Among the paired differences between 0 fraction and 30 fraction of the 4 enhancement phases, the one-sample Wilcoxon test of the early venous phase and late venous phase were statistically significant (P < .001) (Table 3).
One-Sample Wilcoxon Test Results on the Paired Differences of NIC Between 0 Fraction and 30 Fraction for the 4 Enhancement Phases.

Reported are the P-values.
We further compared the amount of reduction in NIC measured at the early venous and the late venous period. The change in the iodine concentration in the late venous period was greater than that in the early venous period (Figure 3). Therefore, this study recommended using the NIC data from the late venous period.

Statistical testing of normalized iodine concentrations in late and early venous phase. The 4 enhancement phases of the NIC of the left, right, and both parotid glands are shown in this figure. NIC was statistically significant in the early venous phase and the late venous phase (P < .001), but the box diagram shows that the difference between the NIC of the late venous phase of the left and right parotid glands is more obvious.
Based on the observed data of the late venous phase, the reduction in NIC was most significant during the 10 to 20 fraction radiotherapy as compared to the other 2 periods (P < .001) (Table 4). There was no significant difference in the reduction between 0-10 fraction radiotherapy and the 20-30 fraction radiotherapy.
Wilcoxon Signed Rank Test Results on Paired Differences of NIC Sequences from the 4 Fractions (0, 10, 20, and 30).

Reported are the P-values.
The RTOG grade was observed to change with the number of radiotherapy treatments (Table 5). With the development of radiotherapy treatments, the RTOG grade increased gradually.
Radiotherapy Fraction and RTOG Xerostomia Grade.

The Spearman rank sum correlation coefficient analysis showed that the NICs of the left, right, and both parotid glands were significantly negatively correlated with the grade of xerostomia (left parotid glands P < .001, r = −0.46; right parotid glands P < .001, r = −0.45; both parotid glands P < .001, r = −0.47).
According to the ROC curve, the AUC (area under the ROC curve) values of the left, right, and both parotid glands were 0.73, 0.75, and 0.75, respectively, as shown in Table 6. Based on the Youden's rule, the threshold values of NIC were 0.175, 0.185, and 0.345 mg/ml for the left, right, and both parotid glands (Figure 4).
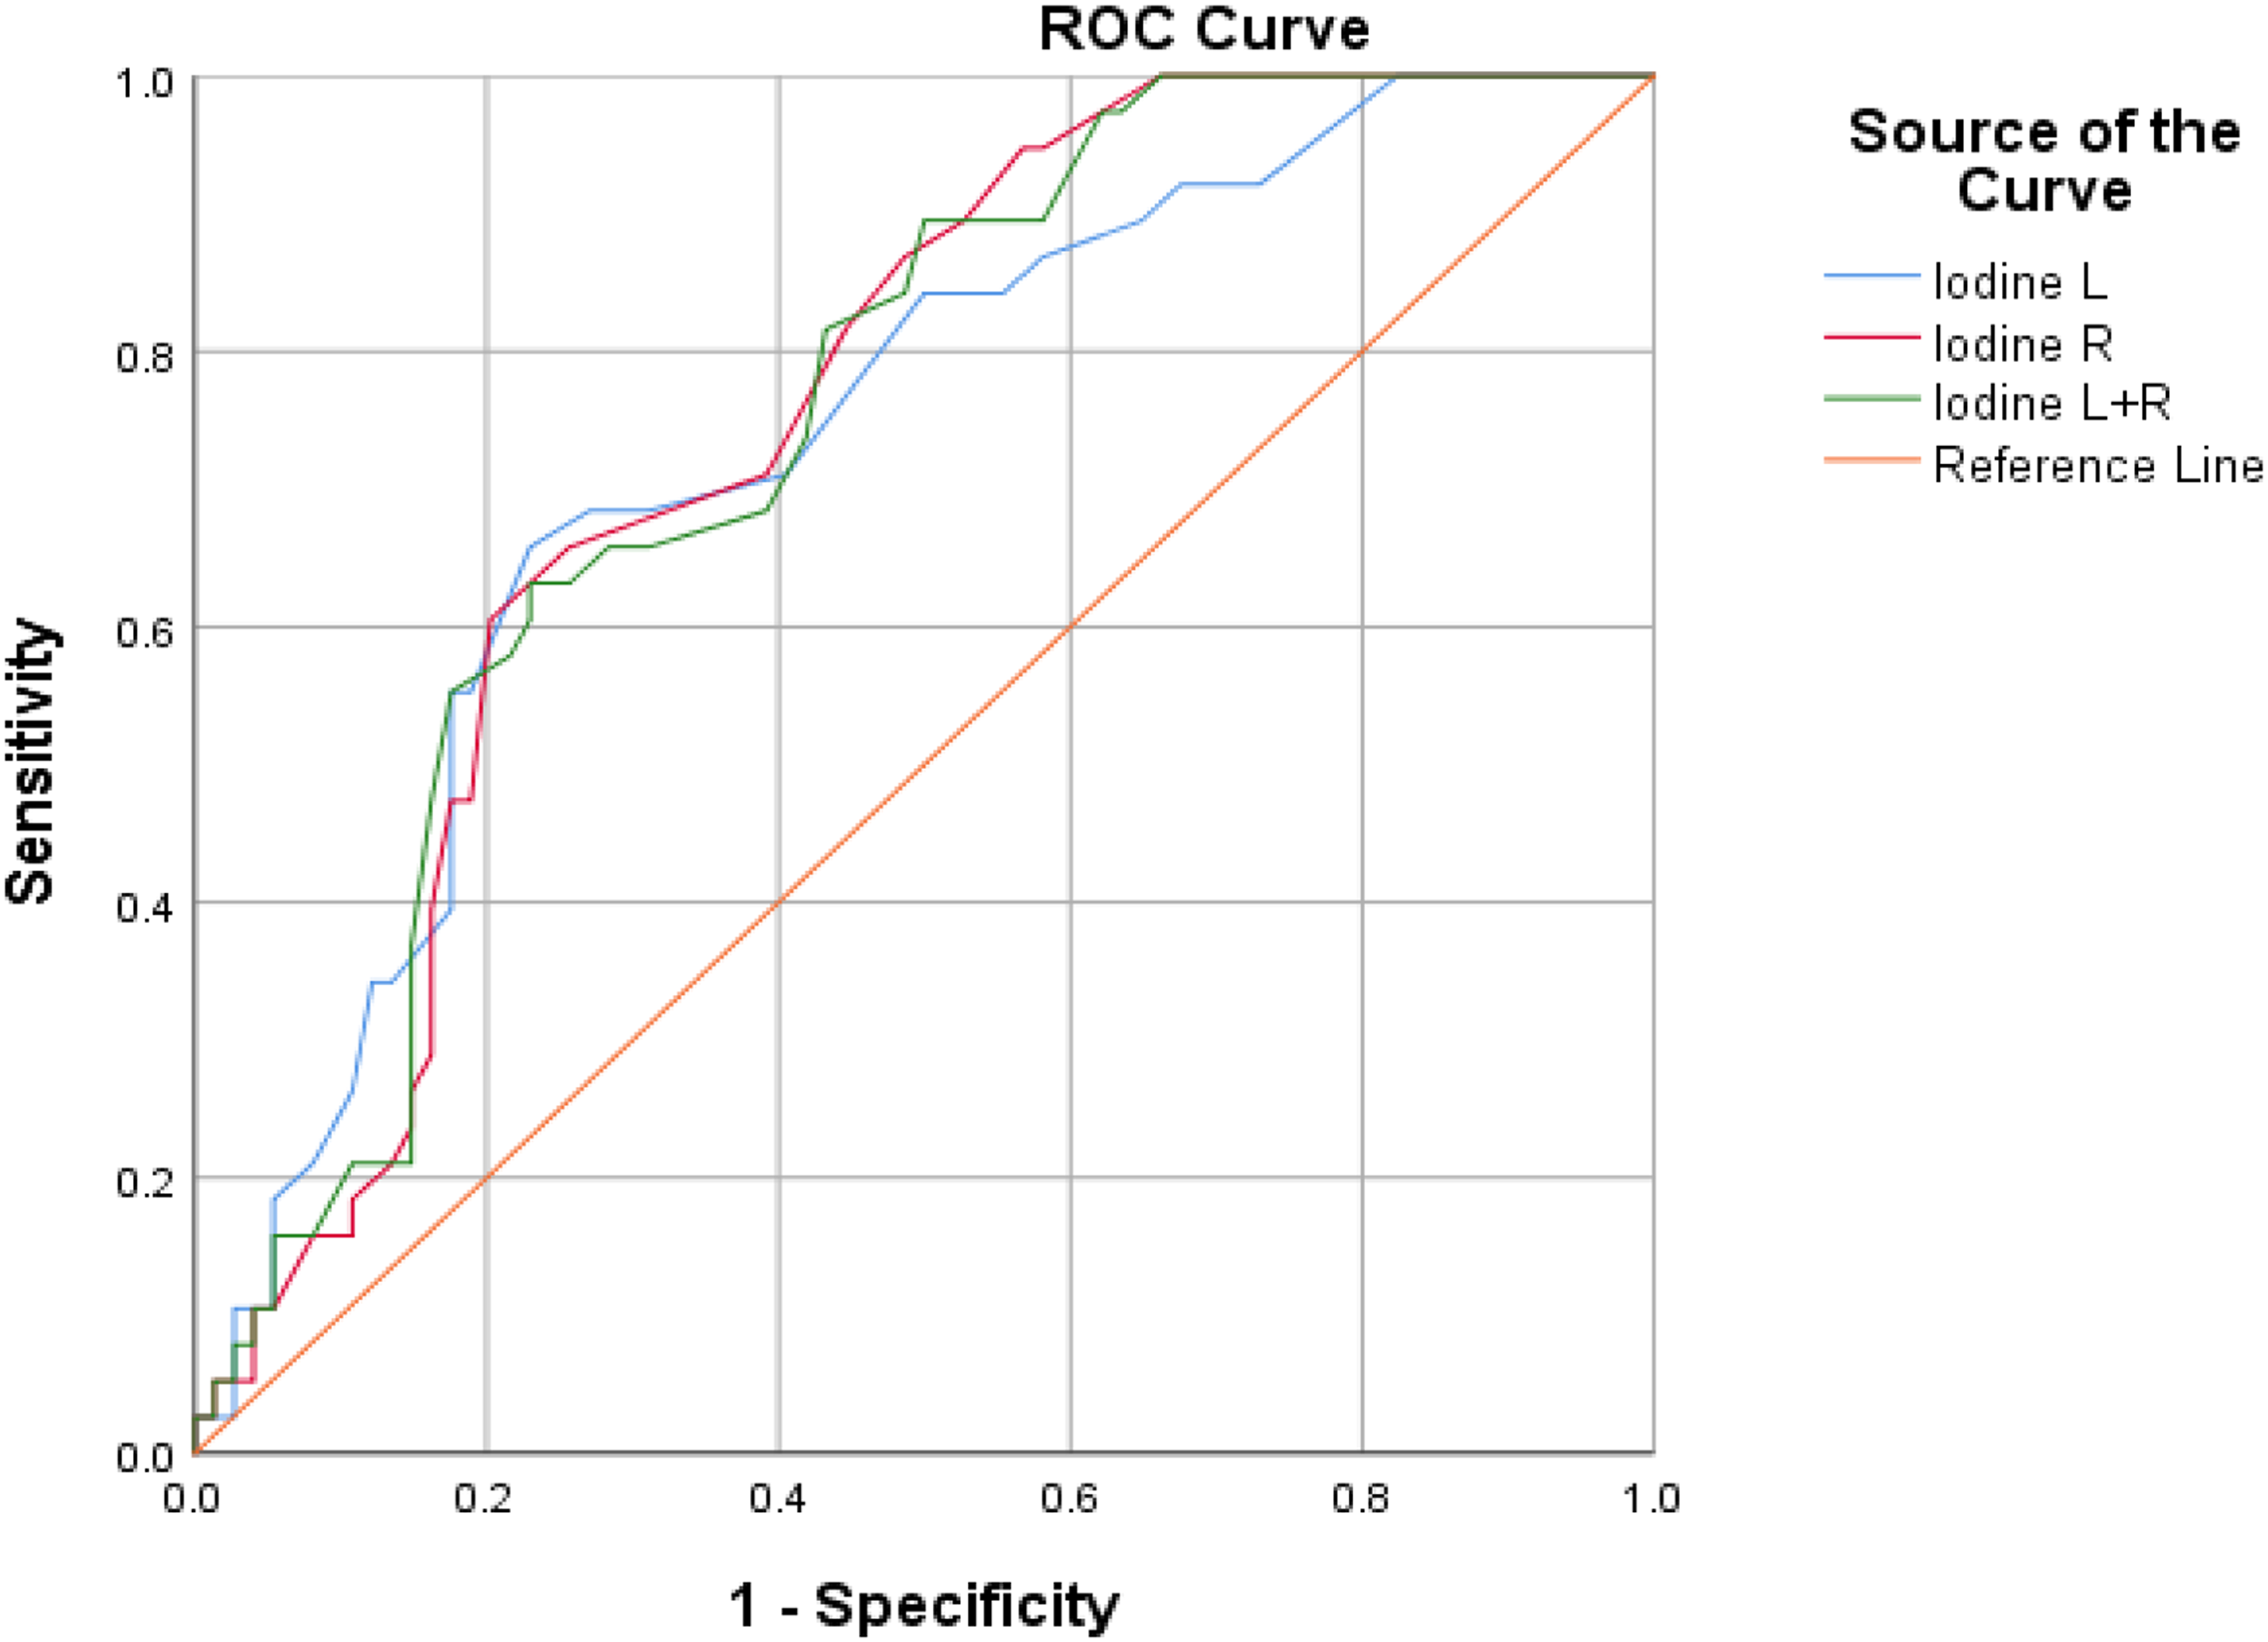
ROC curve of normalized iodine concentrations for left, right, and both parotid glands. To determine the cut-off values of the late venous phase NIC for evaluating the occurrence of acute radiation xerostomia at the left and right parotid glands, the ROC curve was calculated. The AUC values for the left and right parotid were 0.73 and 0.75, respectively, and the cut-off values were 0.175 and 0.185 mg/ml, respectively. After combining the NIC from both sides of the parotid glands, the AUC value for both parotid gland is 0.75, with a cut-off value of 0.345 mg/ml.
Area Under Normalized Iodine Concentration ROC Curve.

The test result variable(s): Normalized iodine concentration L, Normalized iodine concentration R, Normalized iodine concentration R + L has at least one tie between the positive actual state group and the negative actual state group. Statistics may be biased.
a Under the nonparametric assumption.
b Null hypothesis:true area = 0.5.
Discussion
One of the primary treatments for nasopharyngeal carcinoma is radiotherapy. With the ongoing advancements in radiotherapy technology, there has been an increasing focus on researching ways to ensure a higher quality of life post-radiotherapy. 12 Xerostomia is one of the most common complications of radiotherapy for nasopharyngeal carcinoma and often affects the quality of life of patients after radiotherapy. Parotid gland injury during radiotherapy often leads to the occurrence of acute irradiation-induced xerostomia. Su L et al evaluated the differential diagnosis of energy spectrum CT in benign and malignant parotid tumors. They concluded that iodine concentration serves as a quantitative parameter reflecting blood supply. 13 Moreover, the study by Wang L et al showed that energy spectrum CT can accurately predict the iodine concentration in iodine solutions of various proportions. 14 The iodine concentration map is intricately linked to inflammation and the formation of new blood vessels. Additionally, it can serve as an indicator of the activity in both tumors and normal tissues. Therefore, in this study, the NIC obtained through energy spectrum CT iodine maps was employed to evaluate alterations in both sides of the parotid glands during radiotherapy. This approach aimed to explore and evaluate acute xerostomia during the course of radiotherapy. We further determined the normalized critical iodine concentration for acute irradiation-induced xerostomia, these threshold values may serve as useful guidance to assist in the clinical diagnosis of acute irradiation-induced xerostomia and to provide timely intervention.
To the best of our knowledge, this is the first study to evaluate the changes in parotid gland function and irradiation-induced xerostomia with energy spectrum CT iodine map technology. MRI examination takes a long time to perform and has more contraindications than CT examination. Furthermore, PET quantitative studies are typically conducted monthly to observe chronic xerostomia post-radiotherapy.15,16 In contrast, energy spectrum CT can track the variation in NIC during radiotherapy. Compared to conventional CT, the iodine map concentration at each phase of energy spectrum CT enables the quantification of tissue activity. In this study, 4 different CT phases were screened for parameters, and the iodine concentration in the parotid gland was normalized. NIC can reduce the impact of individual cycling on iodine content to more accurately reflect the blood supply of the disease. 17 Therefore, many researchers tend to use NIC as a measurement index. 18 This study demonstrated the changes in parotid gland function during radiotherapy and the limit of NIC when acute irradiation-induced xerostomia occurred.
This study found that the late venous phase was the most statistically significant in NIC change (P < .001); thus, the late venous phase NIC was used as the reference index. This study found that the NIC had the most significant change (P < .001) compared with the NIC in other radiotherapy intervals from the 20 fraction radiotherapy. In terms of the evaluation of xerostomia, this study used the RTOG scoring standard to evaluate the generation and grading of clinical dry mouth.19,20 During the course of our planned radiotherapy, no patient had grade 4 xerostomia, and it was found that the grade of acute irradiation-induced xerostomia gradually increased with increasing interval time during the course of radiotherapy, especially regarding grade 2 irradiation-induced xerostomia (Figure 5). There was a significant negative correlation between NIC and xerostomia. Moreover, it can be observed from the histogram that between the dry mouth grading and the NIC, a higher dry mouth grading corresponded to a more serious attenuation of the NIC (Figure 6).

RTOG xerostomia grade percentage and radiotherapy fraction. The percentage of xerostomia grades and radiotherapy stages showed that with the increase in radiotherapy stages, xerostomia grades 2 and 3 increased, whereas xerostomia grades 0 and 1 decreased.
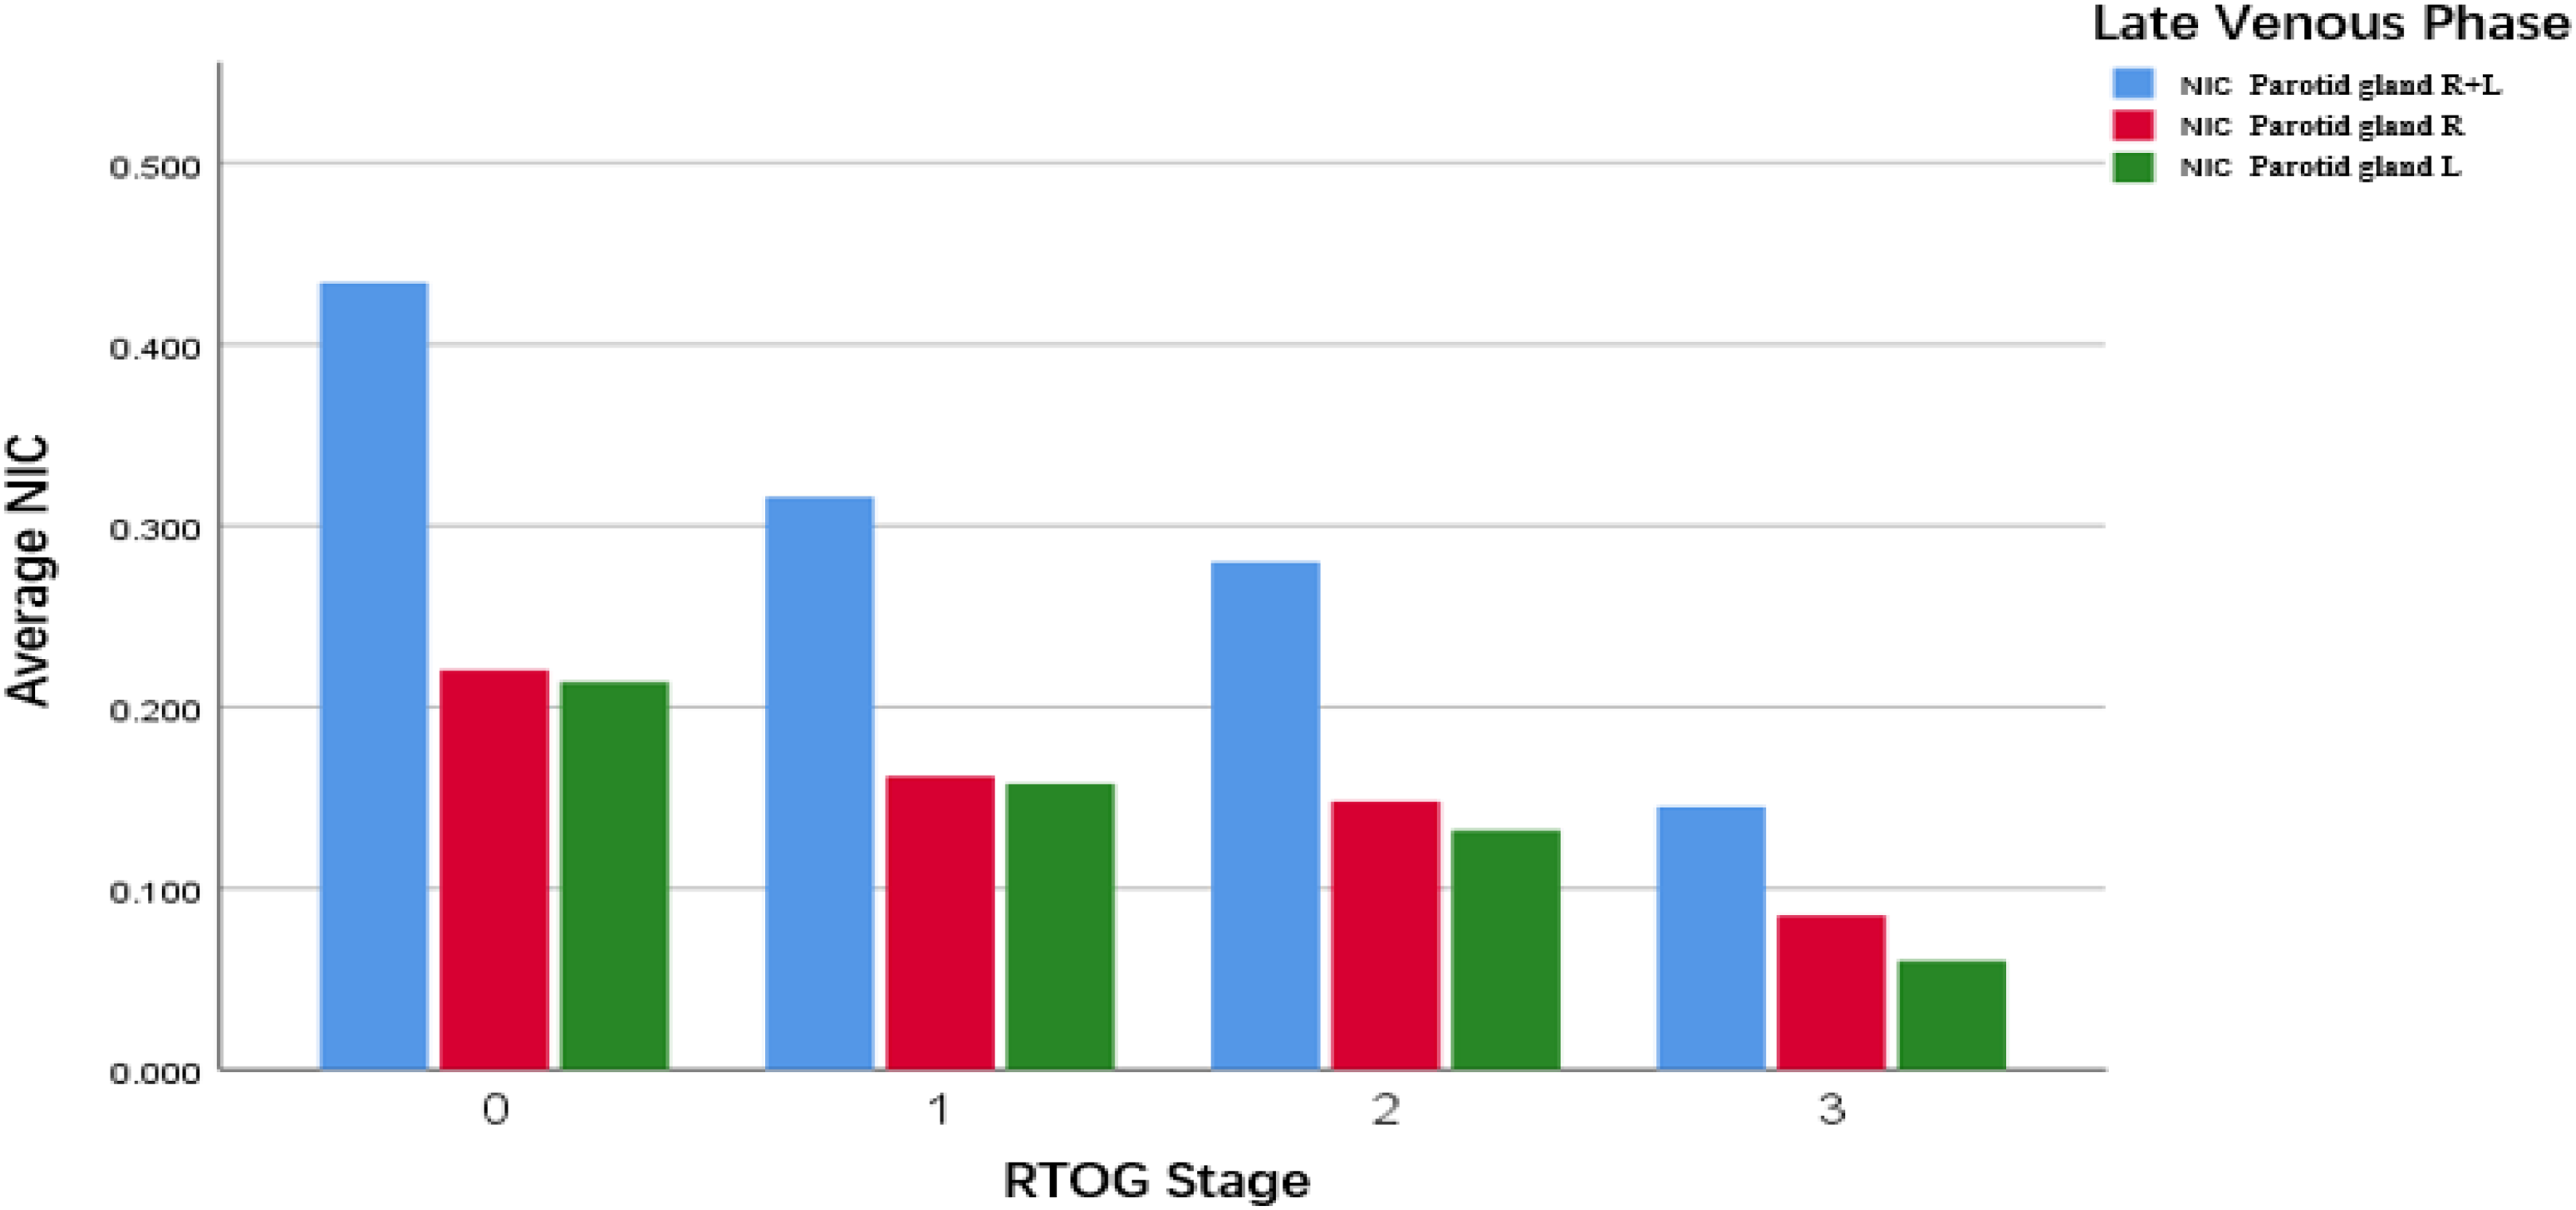
Normalized iodine concentrations and RTOG grade. With the increase in xerostomia grade, the NIC exhibited a downwards trend.
The early change in parotid gland volume and density serves as a crucial predictor of xerostomia. However, it is noted that volume changes may be relatively transient and recoverable compared to alterations in internal functions, 21 highlighting the uncertainty associated with relying solely on volume prediction. Few studies have investigated alterations in the internal function of the parotid gland using CT, and as of now, there is no definitive conclusion on the quantitative study of parotid gland function. This study proposes that NIC may serve as an imaging index for the quantitative assessment of changes in parotid function during radiotherapy. Additionally, based on our sample study, when iodine concentrations fall below 0.175 and 0.185 mg/ml, it suggests that patients may be experiencing acute irradiation-induced xerostomia.
Before this study, many studies used MRI to quantitatively assess the changes in parotid glands and to predict the occurrence of irradiation-induced xerostomia. Their results showed that the apparent diffusion coefficient (ADC) value of the parotid glands was significantly increased after radiotherapy,22,23 but the b values (diffusion sensitive factor) that were used in various studies were different, which affected the repeatability of the results. 24
In addition, the ADC value of the parotid gland may also be affected by various other factors, including pulse sequence, acceleration factor, fat saturation, and organ movement, among other factors,25,26,27 whereas the iodine concentration can avoid these problems. Energy spectrum CT can choose water and iodine as the base material for the absorption measured by physics and solves the density value of the base material pair. The base material pair of water and iodine can more intuitively and quantitatively reflect the tissue composition of the material, thus avoiding unnecessary interference of mixed factors. 28 Compared with CT perfusion imaging, energy spectrum CT iodine maps requires a lower CT dose, has a faster imaging time, is more economical and convenient to perform, and is suitable for clinical application. The irregular vascular structure of the parotid gland post-radiotherapy can result in an augmentation of the capillary bed venous shunt. This, in turn, leads to a reduction in blood flow velocity and an increase in vascular resistance, potentially contributing to the attenuation of NIC. 29 Our study found that the attenuation change in NIC was the most significant at 10 to 20 fractions of radiotherapy (Figure 7). Some clinical research supported the fact that patients with acute irradiation-induced xerostomia had been replanned for 20 fraction radiotherapy and received reduced average doses for the follow-up parotid glands.30,31 Their results provided potential support for NIC attenuation to be significant at the 20 fraction of radiotherapy, thus suggesting the occurrence of acute irradiation-induced xerostomia.
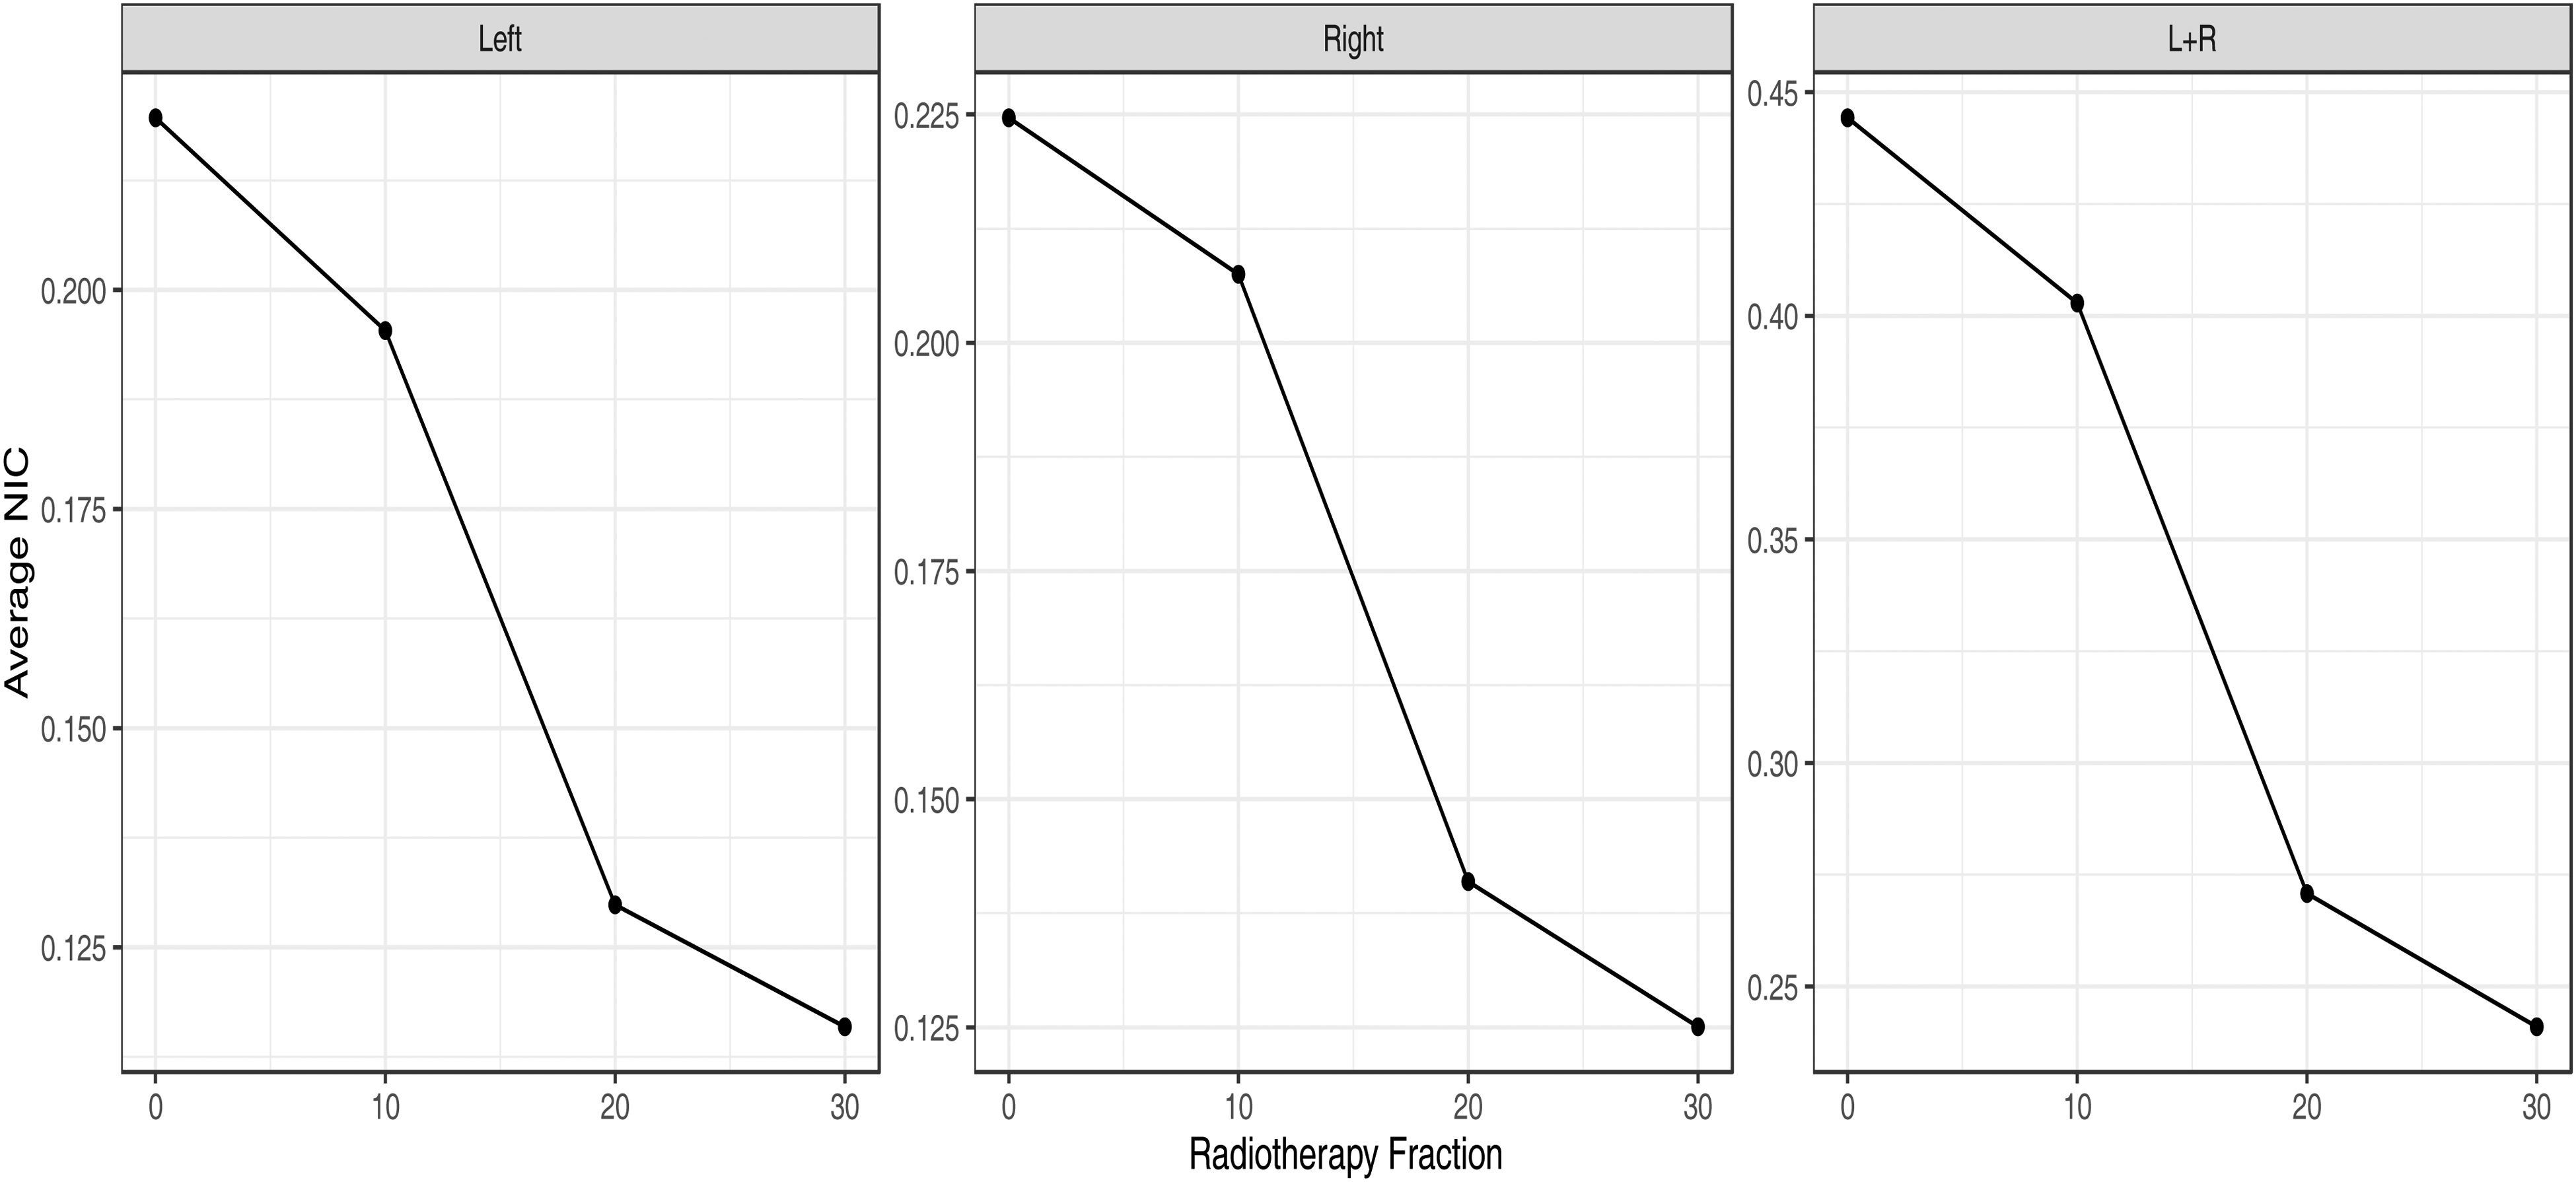
The interval where the average normalized iodine concentrations decays most significantly during radiotherapy. With the increase in radiotherapy stage, the NIC of the left, right, and both parotid glands had the largest attenuation change from the 10 fraction to the 20 fraction.
A limitation of this study is that we are pioneering the use of iodine map concentrations to investigate parotid gland changes during radiotherapy, and there is currently no existing reference from other studies on parotid iodine imaging during radiotherapy. In addition, as an observational study, the sample size in this study may be insufficient. We will consider increasing the sample size in the future experiments. Furthermore, individual variations in the normalized iodine of the parotid gland exist. Very few patients were detected to have NIC that was slightly higher at the 10 fraction time than at the 20 fraction time. The reason for this effect is that the volume of the parotid gland was reduced due to radiotherapy, which led to the convergence and contraction of small blood vessels in the parotid gland, thus affecting the iodine concentration and resulting in increased results.
Conclusions
Our study found that the NIC in the late parotid venous phase may evaluate the occurrence of acute irradiation-induced xerostomia. The left and right parotid gland NIC concentrations were less than 0.175 and 0.185 mg/ml, respectively, or the both parotid glands NIC concentration were less than 0.345 mg/ml, thus indicating the occurrence of acute irradiation-induced xerostomia. The attenuation degree of the NIC of the bilateral parotid glands is the largest when radiotherapy is performed in 10-20 fractions.
Footnotes
Acknowledgment
The authors thank everyone who participated in the research.
Author Contributions
The research was conceived and designed by RFC, JGX, and JMC. The manuscript was written by RFC and JMC. RZ and BHX were in charge of implementation of the trial. YYC, QLL, QZX contributed to the patient management and patient enrollment. LLW and XBL were in charge of radiation treatment programs. The final version for submission was approved by all of the authors.
Declaration of Conflicting Interests
The authors declared no potential conflicts of interest with respect to the research, authorship, and/or publication of this article.
Funding
The authors disclosed receipt of the following financial support for the research, authorship, and/or publication of this article: This work was supported by the Fujian Provincial Health Technology Project, National Natural Science Foundation of China (grant number 2021CXA011, 82173452).
Ethics Statement
This study was approved by the Union Hospital Affiliated to Fujian Medical University Ethics Committee (approval no. 2022KY197) on Month 11, 2022. All participants provided written informed consent prior to enrolment in the study. This research was conducted ethically in accordance with the World Medical Association Declaration of Helsinki.