
Abstract
Keywords
Introduction
Primary squamous cell thyroid carcinoma (PSCTC), which accounts for less than 1% of all thyroid carcinomas, is a rare thyroid malignancy characterized by high aggressiveness and a poor prognosis. 1 This malignant tumor was first reported by von Karst in the 1950s. 2 Similar to other thyroid carcinomas, an anterior neck mass is the most common symptom of PSCTC, followed by difficulty breathing, swallowing, and changing voice quality. 3 The majority of PSCTC patients receive their diagnosis in their 7th decade of life, with a mean age of presentation at 61 years. 4 Nevertheless, PSCTC may occur at any age.5,6 According to preceding research conducted in the United States between 1973 and 2015, the female-to-male ratio in PSCTC is 1.4 to 1. 7 Based on the histology, thyroid cancers can be grouped into follicular thyroid cancer (FTC), papillary thyroid cancer (PTC), anaplastic thyroid cancer, medullary thyroid cancer (MTC), and PSCTC. 8 PSCTC can be diagnosed using ultrasonography, computed tomography (CT), and histopathology. Surgery is the primary treatment and is complemented by radiotherapy and chemotherapy when necessary. 9 In recent years, immunotherapy and targeted therapy have become increasingly popular for treating malignant tumors. Only a few case reports and small sample studies have documented the application of immunotherapy and targeted therapy for treating PSCTC, and the efficacy of immunotherapy and targeted therapy for PSCTC is currently unclear.4,10–12 However, previous studies have shown that even after treatment, the prognosis of PSCTC remains poor. 13 Patients with PSCTC usually die within 1 year after diagnosis, often due to airway obstruction caused by local disease.14,15 Currently, there are no guidelines on the clinical diagnosis and treatment of PSCTC in the world. Studies examining factors affecting the prognosis of PSCTC are very scarce. Therefore, optimizing the clinical decision-making for PSCTC is crucial.
Few clinical studies have focused on PSCTC because of its low incidence. However, many of these studies were based on small sample sizes from a single center or case reports.16,17 To facilitate a thorough investigation, it is necessary to conduct multicenter studies with large sample sizes. Data from 18 cancer registries are compiled in the Surveillance, Epidemiology, and End Results (SEER) database, which covers about 30% of the U.S. population. 18 Thus, SEER is widely recognized as a valuable database when it comes to studying rare tumors. 19 Based on SEER data, 2 studies have been published on prognostic models for PSCTC, which have established a solid basis for further research.20,21 However, the prognosis of the disease should take competing causes of death into consideration, and competing events prevent the occurrence of the ending event of interest, establishing a “competing relationship.” 22 In conventional survival analyses such as the Cox proportional hazards model, competing risks are not properly considered because right-censoring competing risk events increases the probability of the primary event. To date, no study has used a competing risk model to examine factors affecting PSCTC patients’ prognoses. Therefore, a new clinical prognostic model was needed to be developed.
For this study, we explored the clinical characteristics of patients with PSCTC recruited from the SEER database over a long period (from 1975 to 2016). Furthermore, prognostic factors for PSCTC were identified in patients with complete treatment information. The probability of death was evaluated based on the cumulative incidence function (CIF). The CIF differences between subgroups were compared using Gray's test. Based on the Cox proportional regression model and Fine and Gray model, a competing risk nomogram was developed to predict the probability of death in patients with PSCTC.
Materials and Methods
Data Sources
During this study, patients were recruited from the SEER Program of the U.S. National Cancer Institute. A retrospective analysis of the SEER database from 1975 to 2016 was performed in this study. As an authoritative source for cancer incidence, mortality, prevalence, survival, and lifetime risk statistics in the United States, the SEER database provided essential information to the public. Data on patients’ demographics and clinical characteristics were downloaded using the SEER*Stat software (Version 8.3.9). Since the data are public and do not involve patient privacy, the ethical committee review and consent are not required.
In the initial analysis, 204,866 patients with primary thyroid carcinomas were identified between 1975 and 2016. Histological coding (PTC, codes 8050/3, 8052/3, 8130/3, 8260/3, 8340-8344/3, 8450/3, 8452/3; FTC, codes 8290/3, 8330-8332/3, 8335/3; MTC, codes 8345, 8510; ATC, codes 8020-8035; PSCTC, codes 8070/3-8076/3) in this database was inferred from the International Classification of Disease for Oncology, third edition (ICD-O-3). Pathologically confirmed cases were included in the study. The exclusion criteria were survival months = 0 or NA (not available), and duplicate patient ID numbers.
Variable Definitions
The SEER database manual provides detailed definitions of all the variables used in this study. Comparing the cumulative mortality among the subgroups, we divided the age at diagnosis into 4 subgroups by quartiles: ≤35, 36 to 50, 51 to 60, and >60 years.23,24 A binary variable was used for sex (female or male). Race was divided into 3 categories according to frequency distribution: White, Black, or others. Marital status was divided into 4 subgroups according to the frequency distribution: single/unmarried, married, divorced/separated, and widowed/others. Diagnosis refers to the period of case inclusion: 1975-2000, 2001-2010, and 2011-2016. Chemotherapy was evaluated as a binary variable (yes and no). The phenomenon of missing data is very common in both high-quality database research and clinical trial research. In this study, variables with missing data were analyzed using dummy variables, defined as the unknown group.25–27 Radiotherapy was analyzed as a 3-category variable (yes, no, and unknown). We classified the tumor size subgroups following the definitions provided by the AJCC. 28 Tumor size was divided into 4 categories: ≤2 cm, 2 to 4 cm, >4 cm, and unknown. The total number of in situ/malignant tumors for the patient (Number 1) was analyzed as a binary variable [1 and ≥2 (single primary malignancy and greater than or equal to 2 primary malignancies)]. Surgery was considered a 3-category variable (yes, no, and unknown). Surgical methods were divided into 5 categories: total thyroidectomy, subtotal thyroidectomy, lobectomy, others, and none. The SEER database provides data on the AJCC TNM staging of thyroid cancer patients, following the standard of the 7th edition of the AJCC Cancer Staging Manual. 29 In consistency with prior research, patients in this study were classified according to the 7th edition of the AJCC. 30 AJCC stage was divided into 5 categories (I, II, III, IV, and unknown). The AJCC T stage was divided into 5 categories (T1, T2, T3, T4, and Tx). AJCC N stage was divided into 3 categories (N0, N1, and Nx). The AJCC M stage was divided into 3 categories (no, yes, and unknown). Some studies have shown that there are some different clinical characteristics between secondary squamous cell thyroid carcinoma and PSCTC, 31 with secondary squamous cell thyroid carcinoma being more common than PSCTC and having a better prognosis.14,32 Therefore, we included variables such as the first malignant primary indicator (is primary) and sequence number 2 to assess their impact on the prognosis of thyroid carcinoma. The first malignant primary indicator (Is primary) was evaluated as a binary variable (yes and no). Sequence number 2 was evaluated as a binary variable (new onset and prior). Some studies suggest that the grade of thyroid carcinoma is an important prognostic factor.33,34 Patients were divided into 4 subgroups based on grade (I, II, III-IV, and unknown). Primary thyroid carcinoma was categorized into 5 types: PTC, FTC, MTC, ATC, and PSCTC.
When the number of subjects was reduced to the PSCTC cohort, the clinicopathological parameters were combined and grouped according to the actual frequency.
Prognostic Differences of 5 Pathological Types of Thyroid Carcinoma
A total of 198,757 patients with thyroid carcinoma were included in the study following the above inclusion and exclusion criteria. The SEER database enabled population-based studies with multiinstitution participation and reduced selection bias. Analyzing the prognosis of different pathological types of thyroid cancer using the SEER database offered the advantages of large sample size, extensive follow-up periods, and detailed pathological information. Data were analyzed according to the pathological types and other clinicopathological parameters. The survival rates of the different pathological types were compared using Kaplan–Meier survival analysis and the differences in survival among the groups were analyzed using the log-rank test. Furthermore, to assess the effect of various Clinical and pathological characteristics on overall survival (OS) and disease-specific survival (DSS) related to thyroid cancer patients, we used univariate and multivariate Cox proportional hazard regression models.
Analyses of the Prognosis of Patients With PSCTC
The study included 218 PSCTC patients whose data were analyzed based on outcome events and other clinicopathological parameters. Survival curves were estimated using Kaplan–Meier analysis, and OS and DSS among the groups were compared using the log-rank test. To identify prognostic factors related to OS and DSS, univariate and multivariate Cox regression analyses were conducted. In the competing risk analysis, PSCTC-specific death was the study endpoint, non-PSCTC death was considered as the competing event, and surviving patients were censored. To show each prognostic variable, we estimated the CIF for a specific cause and tested the differences using Gray's test. 35
Construction and Validation of a Nomogram Based on the Competing Risks Model
For the analysis of the association between variables and PSCTC-specific death, Fine and Gray competing risk regression was applied. The 24-, 36-, and 72-month time-dependent receiver operating characteristic (ROC) curves were plotted to evaluate the discrimination of each variable in predicting the survival of PSCTC patients at various time points. Predictive factors were screened using the stepwise regression method. We applied forward stepwise model selection to select the model with the smallest Bayesian Information Criterion (BIC). 36 The BIC is defined as BIC = −2l + log(n)d, where l is the maximized value of the log-likelihood for a given model and d is the number of free parameters to be estimated. For a regression model, d is usually equal to the number of estimated coefficients, and n is the number of observations. The BIC difference is defined as ΔBICi = BICi − min(BIC). Based on the final variables, a nomogram was developed. In order to evaluate the discriminatory ability of the nomogram, the concordance index (C-index) and the area under the curve (AUC) of ROC curves were calculated. To evaluate the model's prediction probability, the calibration curve was used. To evaluate model performance, we calculated the Brier scores. The decision curve analysis (DCA) was used to assess the clinical benefit of the nomogram. The decision analysis curves assess the clinical utility of predictive models by the threshold probability that serves as a basis for determining the net benefit. 37 A decision analysis curve is produced by performing a graphical analysis of the net benefit against the threshold probability, which can be utilized to evaluate the net benefit of nomogram-supported decisions at different threshold probabilities, relative to the net benefit of decisions made with the assumption that all or none of the patients are affected by the outcome of interest. 38 In the following step, the performance of the validation set was estimated using 5-fold cross-validation. We adhered to the transparent reporting of a multivariable prediction model for individual prognosis or diagnosis (TRIPOD) guidelines for the development and validation of the model (EQUATOR network: https://www.equator-network.org/reporting-guidelines/tripod-statement/). 39 TRIPOD checklist has been completed.
Statistical Analysis
We converted continuous variables such as age and tumor size into categorical variables. OS and DSS were the primary endpoints for comparison. To compare categorical variables between the groups in this study, the chi-square test or Fisher's exact test was used. Statistic analyses were conducted using R (Version 4.1.0) with packages such as “survival,” “cmprsk,” “rms,” “forestplot,” and “regplot.”40–44 In all analyses, a 2-sided P value <.05 was considered statistically significant.
Results
Prognosis of Patients With Different Pathological Types of Thyroid Carcinoma
A total of 198,757 patients with different pathological subtypes of thyroid cancer (n = 1730, ATC; n = 18,291, FTC; n = 3992, MTC; n = 174,526, PTC; and n = 218, PSCTC) were included in this study. As shown in Supplemental Table 1, age, race, sex, marital, diagnosis, number 1, AJCC stage, grade, radiotherapy, chemotherapy, surgical method, tumor size, is primary, and sequence number 2 were significantly different among the 5 pathological subtypes of thyroid carcinoma (P < .001). The Kaplan–Meier curves for OS and DSS in Figure 1 show that different pathological subtypes of thyroid cancer have different prognoses. PSCTC and ATC had the worst prognosis, whereas PTC had the best prognosis (P < .001). In univariate Cox regression analysis, different pathological types were significantly associated with the survival outcome of patients with thyroid carcinoma. Compared with PSCTC, ATC was associated with a significant decrease in patients’ OS [hazard ratio (HR), 95% confidence interval (CI) = 2.102 (1.804-2.449)], while FTC [HR (95% CI) = 0.084 (0.073-0.098)], MTC [HR (95% CI) = 0.127 (0.108-0.148)], and PTC [HR (95% CI) = 0.046 (0.039-0.053)] were associated with a significant increase in patients’ OS (Supplemental Table 2). According to multivariate Cox regression analysis, compared with PSCTC, FTC [HR (95% CI) = 0.414 (0.356-0.483)], MTC [HR (95% CI) = 0.593 (0.506-0.696)], and PTC [HR (95% CI) = 0.353 (0.304-0.411)] were associated with a significant improvement in patients’ OS (Supplemental Table 2). Through univariate and multivariate COX regression analyses, it was found that the results of DSS were similar to those of OS (Supplemental Table 3). Based on the COX regression analyses with OS and DSS as the outcome, PSCTC and ATC were associated with poor prognoses. The number of studies related to PSCTC is extremely limited. Therefore, PSCTC requires further investigation.
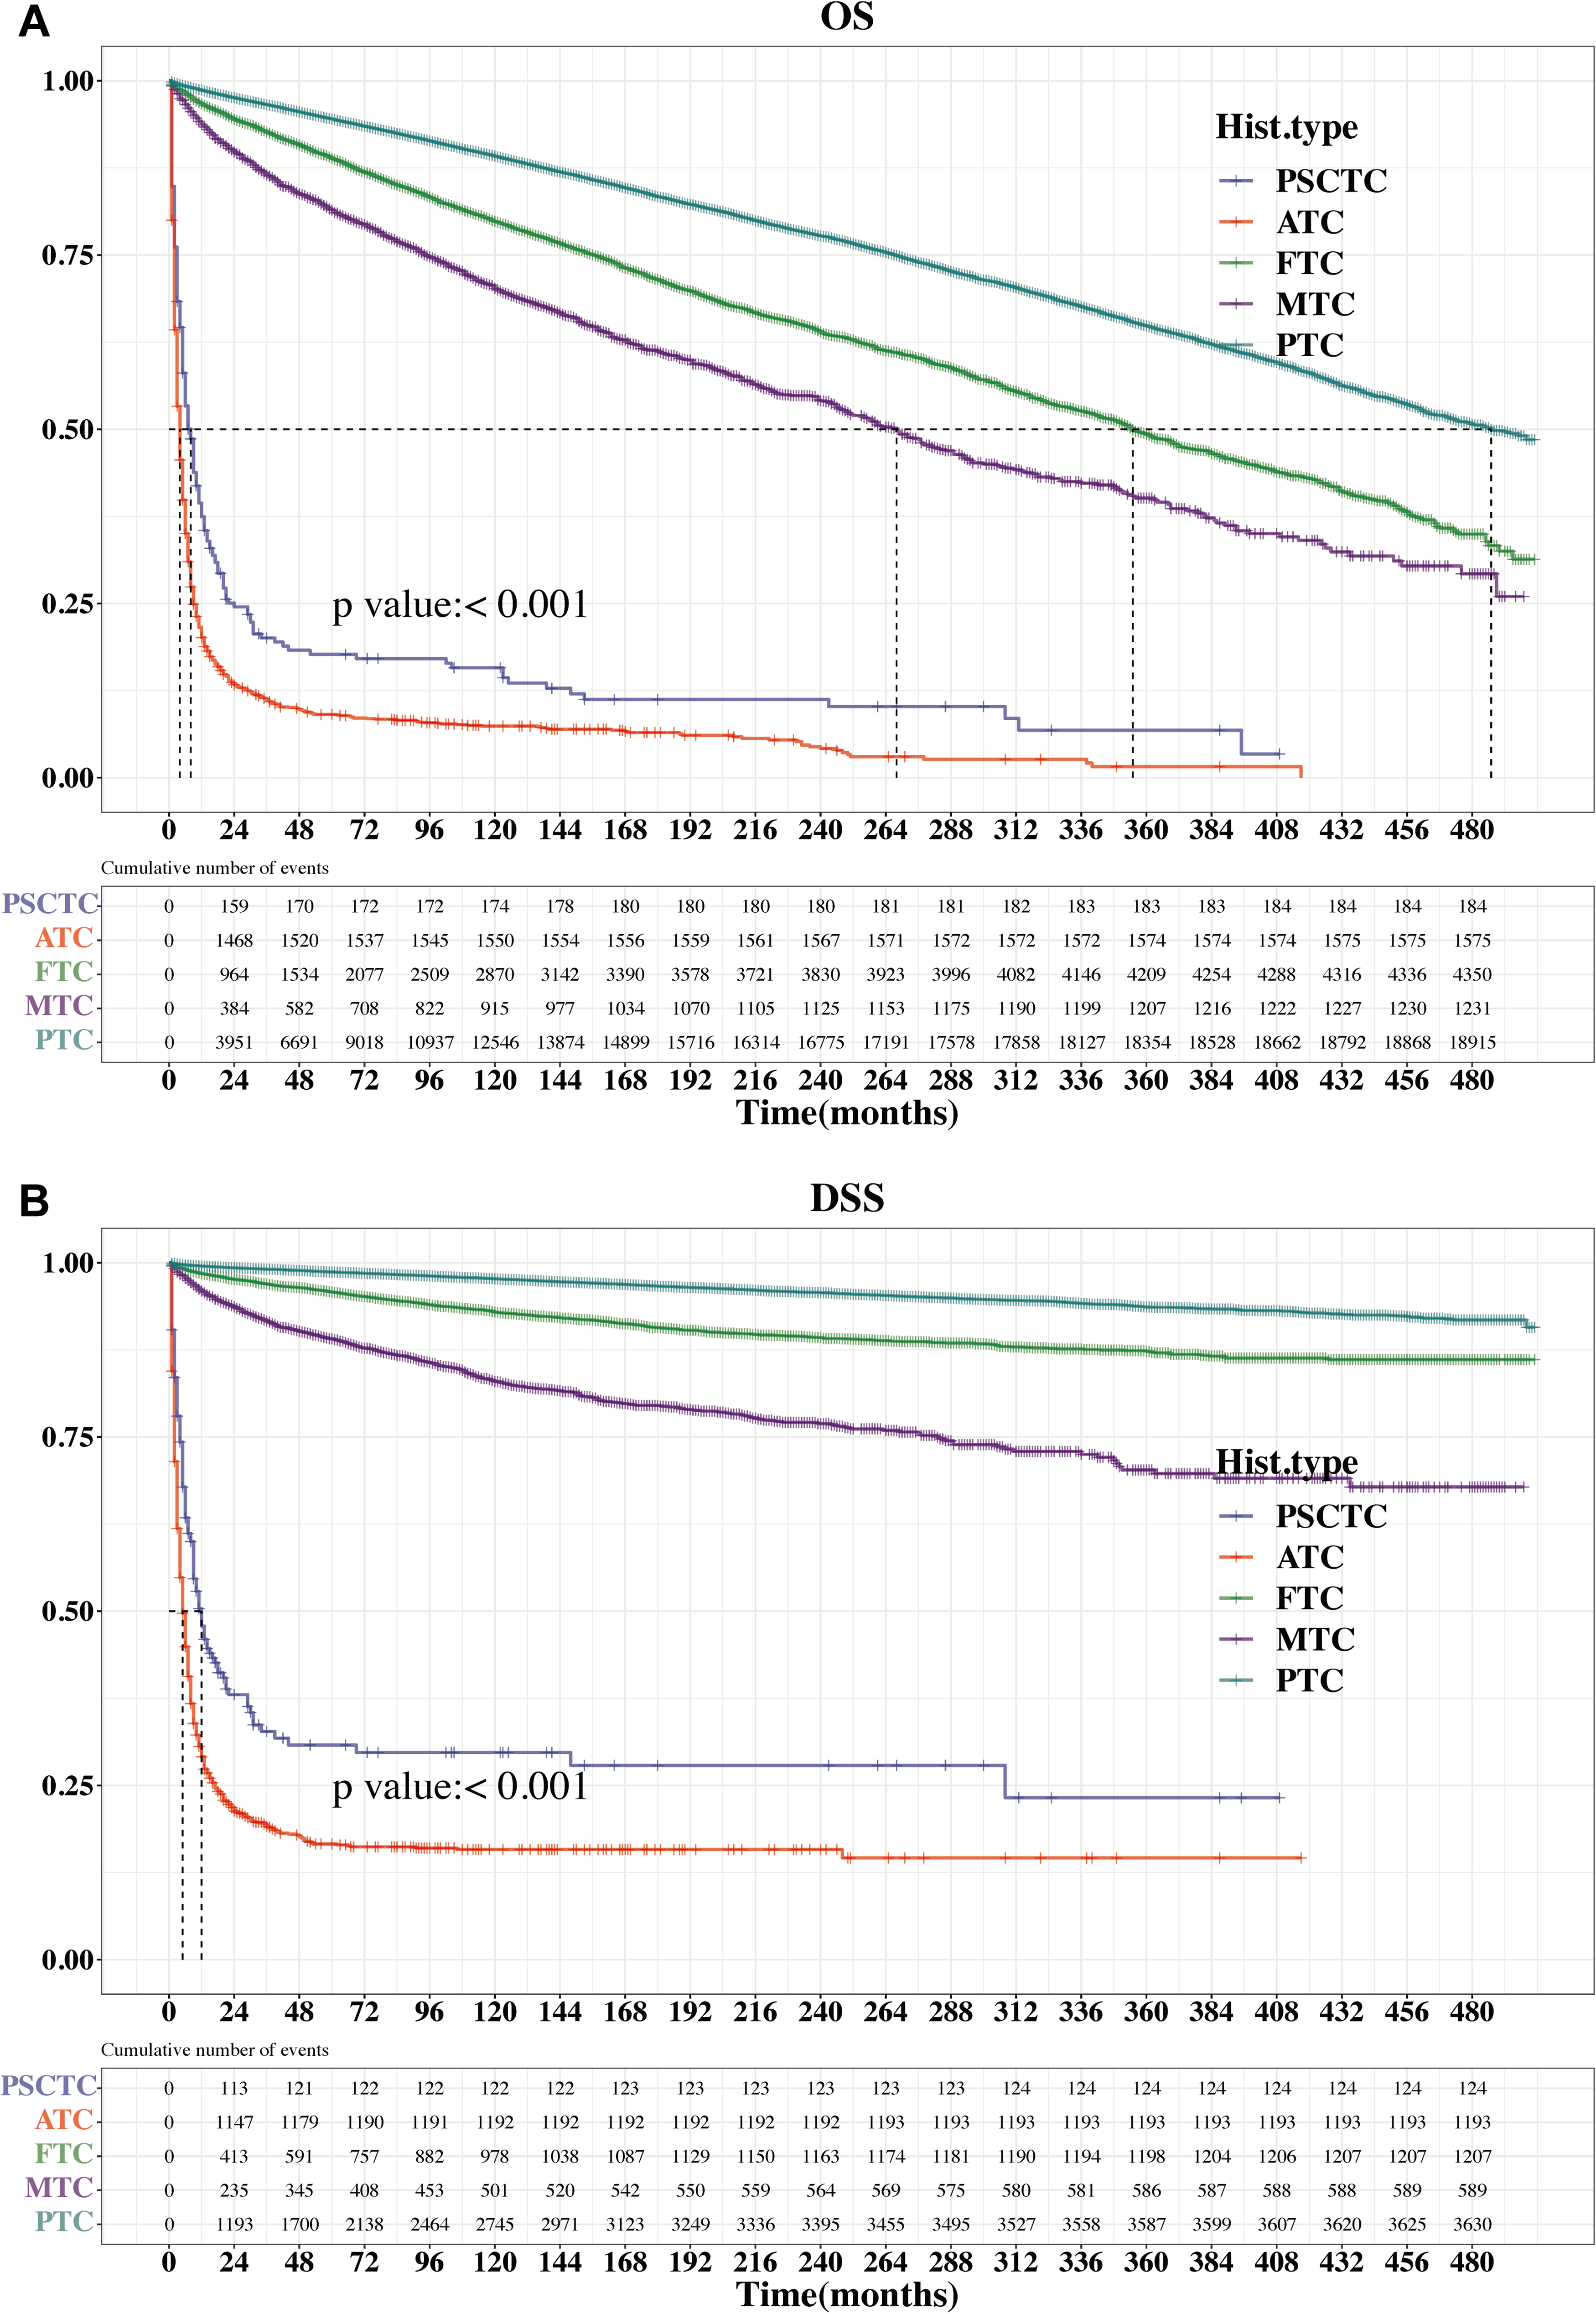
Kaplan–Meier survival curves for the 5 pathological types of thyroid carcinoma. (A) Kaplan–Meier curves of OS according to the five pathological types of thyroid carcinoma. (B) Kaplan–Meier curves of DSS according to the five pathological types of thyroid carcinoma.
Prognostic Analyses of Patients With PSCTC
The study included 218 patients with PSCTC, 34 of whom survived and 184 died. We explored the correlation between clinicopathological parameters and survival outcomes in patients with PSCTC. The distribution of age, diagnosis, AJCC stage, AJCC N stage, grade, and surgery was significantly different between the survival outcome groups (Table 1).
Correlation Between Clinicopathological Parameters and Survival Outcome in Patients With PSCTC.

Abbreviations: PSCTC, Primary squamous cell thyroid carcinoma; M ± SD, M ± SD; Age cat, age categories; AJCC, the American Joint Committee on Cancer stage; AJCC T, the American Joint Committee on Cancer Tumor stage; AJCC N, the American Joint Committee on Cancer Node stage; AJCC M, the American Joint Committee on Cancer Metastasis stage.
The Wilcoxon rank-sum test was used to analyze continuous variables, while the chi-square test or Fisher's exact test was employed for categorical variables. P < .05.
Kaplan–Meier survival curves were used to estimate the OS and DSS of patients with PSCTC and are shown in Figures 2 and 3, respectively. Age (25-70 years), AJCC stages I-III, AJCC N stage (N0), AJCC M stage (M0/Unknown), and Grade (I-II) were associated with significantly better OS and DSS. The AJCC T stage (T4), Number 1 (1), chemotherapy (yes), and radiotherapy (yes) were significantly associated with poorer DSS.
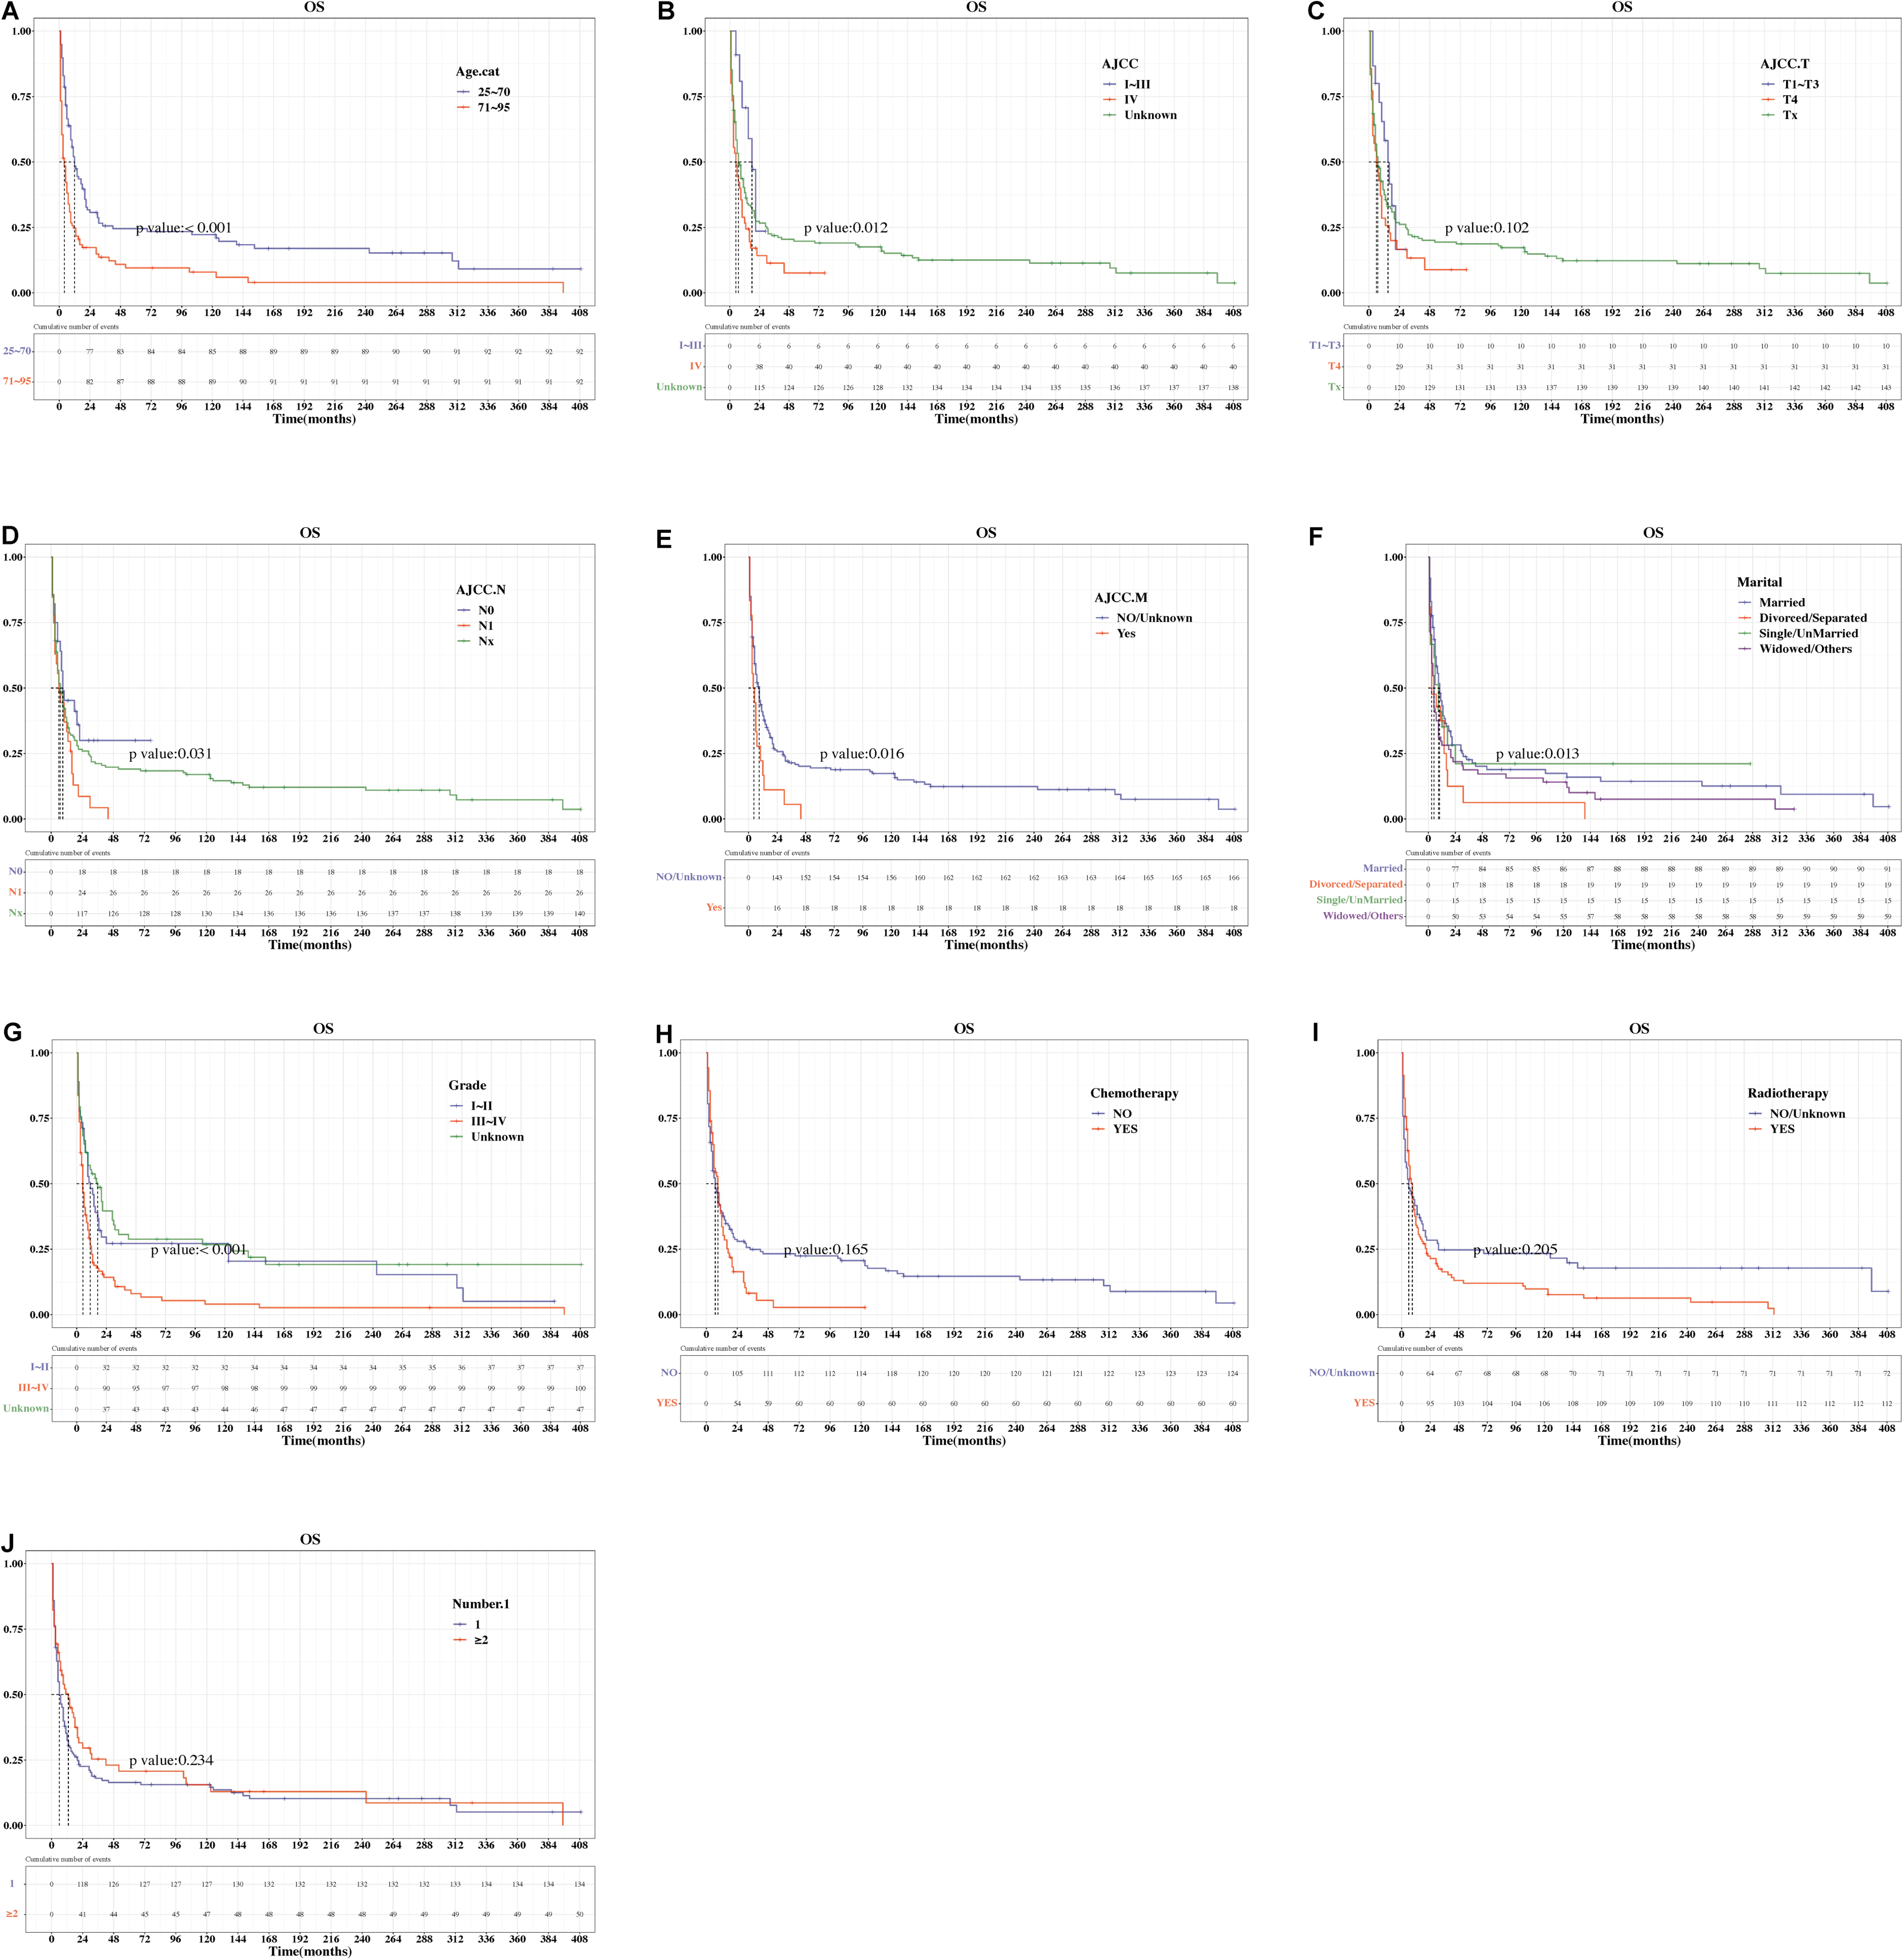
Kaplan–Meier survival analyses of the influence of variables on the OS of PSCTC patients. (A) age; (B) AJCC stage; (C) AJCC T stage; (D) AJCC N stage; (E) AJCC M stage; (F) marital; (G) grade; (H) chemotherapy; (I) radiotherapy; (J) Number 1.

Kaplan–Meier survival analyses of the influence of variables on the DSS of PSCTC patients. (A) age; (B) AJCC stage; (C) AJCC T stage; (D) AJCC N stage; (E) AJCC M stage; (F) marital; (G) grade; (H) chemotherapy; (I) radiotherapy; (J) Number 1.
As shown in Supplemental Tables 4 and 5, Cox regression analysis was performed to identify prognostic factors for patients with PSCTC. In univariate analysis, compared with age (25-70 years), age (71-95 years) group was found to be associated with poor OS [HR (95% CI) = 2.005 (1.497-2.687)] and DSS [HR (95% CI) = 1.673 (1.172-2.388)]. In addition, compared with grade (I-II), grade (III-IV) was associated with worse OS [HR (95% CI) = 1.763 (1.202-2.586)]. In comparison to Number 1 (1), Number 1 (≥2) showed a better DSS [HR (95% CI) = 0.053 (0.017-0.167)]. In multivariate Cox analysis, age (71-95 years) was independently associated with poorer OS [HR (95% CI) = 1.863 (1.347-2.577)] and DSS [HR (95% CI) = 1.688 (1.132-2.518)]. Besides, Number 1 (≥2) was an independent factor for better DSS [HR (95% CI) = 0.063 (0.02-0.201)] in patients with PSCTC.
Competing Risk Analyses to Identify the Prognostic Factors of Patients With PSCTC
The cumulative incidences of PSCTC-specific death and non-PSCTC death among the various variables are shown in Figure 4. Gray's test showed that the mortality risk for PSCTC increased with higher grade (P < .001), and the correlation between grade and mortality risk for non-PSCTC was not significant (P > .05). Moreover, the mortality risk of PSCTC increased as the AJCC stage increased (P < .05), and there was no correlation between AJCC stage and mortality risk of non-PSCTC (P > .05). The mortality risk for PSCTC increased with radiotherapy (P < .01), and no significant correlation was found between radiotherapy and the mortality risk from non-PSCTC (P > .05). It was also found that Number 1 and chemotherapy showed a significant correlation with the mortality risk (P < .05).

Cumulative incidence curves of the effect of variables on the cumulative probabilities for PSCTC-specific death (labeled 1) and non-PSCTC death (labeled 2). (A) age; (B) AJCC stage; (C) AJCC T stage; (D) chemotherapy; (E) diagnosis; (F) grade; (G) Number 1; (H) radiotherapy; (I) sex.
In this study, PSCTC-specific death was the endpoint, whereas non-PSCTC death was the competing event. The Fine–Gray competing risk model was used to calculate the subdistribution hazard ratios (SHR) and 95% CI for PSCTC-specific death. Interestingly, in both the univariate and the multivariate analyses, we found that Number 1 (≥2) was associated with a reduced risk of PSCTC-specific death compared to Number 1 (1) [SHR (95% CI)= 0.034 (0.011-0.105) and 0.034 (0.01-0.117), respectively] (Figure 5). Thus, the Fine–Gray model was performed to demonstrate that Number 1 (≥2) was an independent prognostic factor.

Fine and Gray competing risk analyses of variables for cumulative probabilities of PSCTC-specific death.
Prognostic Ability of Each Variable at Different Time Points
Based on the data of patients with PSCTC, the prognostic ability of each variable was evaluated using time-dependent ROC (AUC value). The AUC values of grade for 24-, 36-, and 72-month OS were 0.669, 0.672, and 0.717, respectively. The AUC values of age for 24-, 36-, and 72-month OS were 0.600, 0.603, and 0.627, respectively. The AUC values of Number 1 for 24-, 36-, and 72-month OS were 0.539, 0.532, and 0.528, respectively. The AUC values of variables at different time points were shown in Supplemental Table 6.
Construction and Validation of Nomogram
A clinical prediction model was constructed based on the competing risk model. A stepwise regression method was used to screen candidate variables. The variables with P < .05 in the multivariate analysis of the Fine–Gray competing risk model, namely Age cat and Number 1, were selected as the determined variables in the prediction model. The diagnosis year was not included in the model variable screening. The other 11 variables were treated as candidate variables and combined with Age cat and Number 1 to construct models. Eleven variables were Race, Sex, Marital, AJCC, AJCC T, AJCC N, AJCC M, Grade, Radiotherapy, Chemotherapy, and Tumor size. The model with the lowest BIC difference between 0 and 2 was selected as the optimal model. Finally, we screened 3 variables: Number 1, Age cat, and Grade. Therefore, a nomogram was developed to integrate Number 1 and other variables, such as Grade and Age cat, which could predict the 24-, 36-, and 72-month prognoses of patients with PSCTC (Figure 6A). Figure 6B illustrated that the 24-, 36-, and 72-month values of AUC regarding the nomogram for prognosis were 0.819, 0.861, and 0.903, respectively. Moreover, the calibration curves in this study were highly reliable, with only minor deviations from the reference line (Figure 6C). The C-index of the nomogram and Brier score were close to the ideal values (C-index: 24 months 0.876, 36 months 0.897, and 72 months 0.921; Brier score: 24 months 0.127, 36 months 0.110, and 72 months 0.098). We conducted a DCA that demonstrated the preferability of applying this model compared to treating all or no patients using this model, considering a range of threshold probability (Figure 6D). The DCA for 24-month survival probability prediction showed that the nomogram offered the best net benefit across 3% to 71% threshold probability. The DCA for 36-month survival probability prediction demonstrated that the nomogram provided the optimal net benefit within the range of 3% to 76% threshold probability. The DCA for the 72-month survival probability prediction reveals that the nomogram yields the maximal net benefit across the threshold probability range of 3% to 81%.
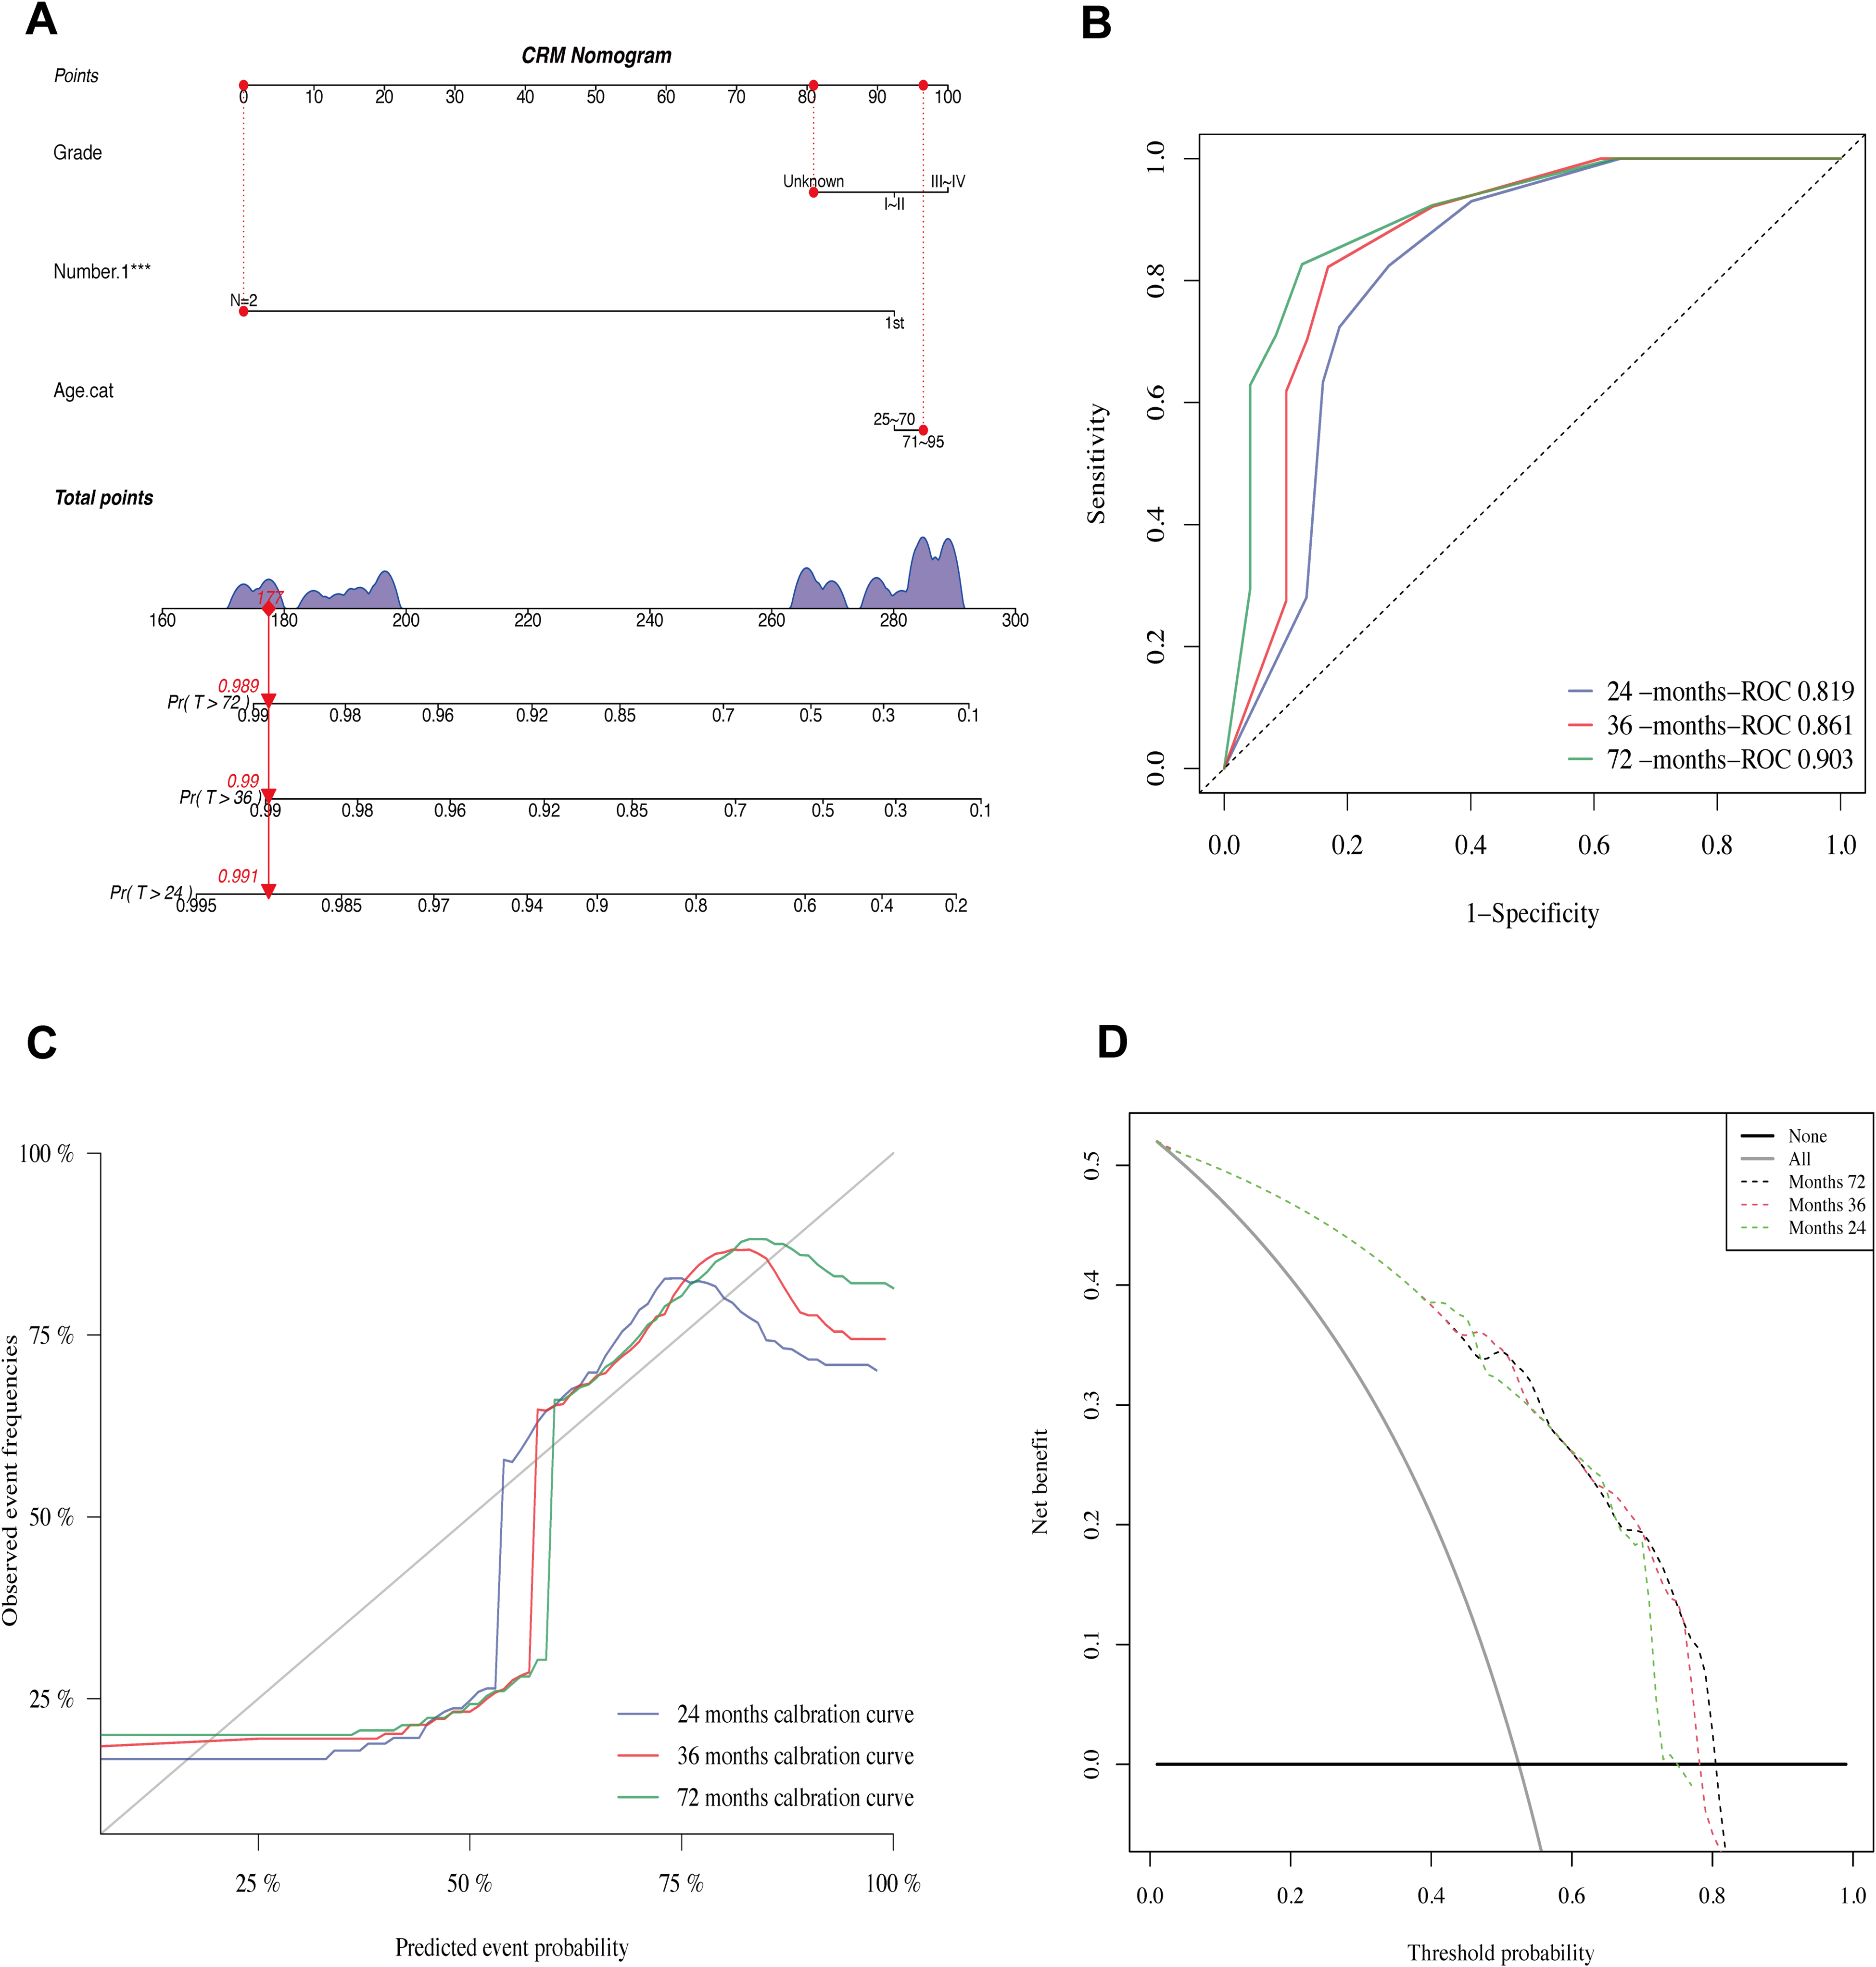
Construction of a competing risk nomogram for prediction of prognosis in PSCTC patients and its performance validation. (A) competing risk nomogram; (B) receiver operating characteristic curve analysis of the nomogram; (C) calibration curves; (D) decision curve analysis of the nomogram.
Validation was conducted using 5-fold cross-validation. The 24-, 36-, and 72-month AUC values for the prognosis nomogram were 0.783, 0.773, and 0.805, respectively (Figure 7A), indicating that the discriminatory ability of the model was relatively high. The calibration curves indicated a good agreement between the actual observations and model predictions (Figure 7B). The C-index and Brier scores were close to the ideal values (C-index: 24 months 0.869, 36 months 0.877, 72 months 0.848; Brier score: 24 months 0.149, 36 months 0.142, 72 months 0.155). Additionally, the threshold probability of the nomogram ranged from 25% to 71% in the DCA, suggesting wide clinical utility (Figure 7C).

Validation of the nomogram using 5-fold cross-validation. (A) receiver operating characteristic curve analysis of the nomogram; (B) calibration curves; (C) decision curve analysis of the nomogram.
Discussion
PSCTCs are extremely rare, accounting for less than 1% of all thyroid cancers. PSCTC patients commonly present with rapidly growing neck mass and swelling. It is virtually impossible to differentiate between PSCTC and anaplastic cancer based on clinical symptoms. 14 Very few studies have described the ultrasonographic imaging findings of PSCTC. 11 Less than one-third of patients can be accurately diagnosed with PSCTC using fine-needle aspiration biopsy.45,46 PSCTC is a thyroid cancer that is highly aggressive and has a poor prognosis. 6 Therefore, further studies on PSCTC are required. In contrast to previous case reports or small-sample studies, we used the SEER database to overcome sample size bias.
In this study, the effects of different pathological types of thyroid carcinomas on prognosis were examined using the SEER database. Previous studies have indicated that the most aggressive types of thyroid cancer, including ATC and PSCTC, have poor prognoses. 47 According to our results, the Kaplan–Meier curves for OS and DSS showed that PSCTC and ATC had the poorest prognoses, whereas PTC had the best prognosis. In accordance with previous research, our results are reliable. Cox regression analysis demonstrated that PSCTC and ATC were associated with poor OS and DSS. PSCTC patients have poor outcomes and lack effective diagnostic and treatment options. Further research is required to improve the outcomes of PSCTC patients.
An analysis of 218 PSCTC patients from the SEER database was conducted in the current study. There were significant differences between the survival outcome groups in terms of age, diagnosis, AJCC stage, AJCC N stage, grade, and surgery. Kaplan–Meier survival analysis in this study showed that the age (25-70 years) group, AJCC stages I-III, AJCC N stage (N0), AJCC M stage (M0/Unknown), and grade (I-II) predicted better OS and DSS, while AJCC T stage (T4), Number 1 (1), chemotherapy (yes), and radiotherapy (yes) predicted poorer DSS. A previous study demonstrated that age was a prognostic factor for PSCTC. 21 Our results are consistent with those of the previous study. The more advanced the AJCC stage of the tumor, the worse the survival outcome. 48 The higher the tumor grade, the worse the patient prognosis. 49 The use of chemotherapy for PSCTC has not been beneficial. 15 In our analysis, chemotherapy had a negative prognostic impact, resulting in a lower DSS. In previous studies, resection of the gross disease was recommended, followed by adjuvant radiotherapy to provide the best local control. 50 However, we found that patients with PSCTC treated with radiotherapy had a poor prognosis. Radiotherapy alone rarely provides adequate local control. 51 Additionally, univariate and multivariate Cox regression analyses showed that age (71-95 years) was an independent risk factor for poor OS and DSS. In numerous studies, age plays an important role in the prognosis of cancer patients.52,53 In contrast, Number 1 (≥2) was an independent protective factor for better DSS.
Competing risk, defined as non-PSCTC death, prevents the occurrence of an event of interest. 54 Some bias may have been introduced by ignoring competing risks. 55 In Gray's test, the mortality risk for PSCTC increased with higher grades, whereas the relationship between grade and mortality risk for non-PSCTC was not significant. As a well-known prognostic factor, tumor grade was an important prognostic factor in our research. To identify prognostic factors in this competing risk setting, Fine and Gray proposed a regression model based on CIF-associated hazards. 56 The competing risks can be handled using the Fine–Gray subdistribution hazards model. Therefore, we conducted Fine–Gray regression analysis, which identified Number 1 (≥2) as an independent protective factor for the prognosis of PSCTC. The results showed that the number of primary malignancies was an independent prognostic factor. Previous research compared survival rates between patients with single and multiple primary tumors, and found that multiple primary tumor patients had a higher overall survival rate than patients with single primary tumors. 57 The research was consistent with our result that Number 1 (≥2) was a protective factor. The reasons why patients with multiple primary tumors may have a better prognosis than those with a single primary tumor are relatively complex. During the diagnostic process for multiple primary tumors, patients tend to exhibit increased concern regarding their health status, which results in a higher frequency of regular check-ups. 58 This facilitates the timely detection and treatment of multiple primary tumors, consequently enhancing treatment efficacy and survival rates. In patients with multiple primary tumors, physicians may implement more targeted and comprehensive treatment strategies, potentially enhancing treatment outcomes and patient survival rates. 59 Certain studies have identified biological distinctions between multiple and single primary tumors, observing that some multiple primary tumors exhibit slower growth and comparatively lower invasiveness, which in turn contributes to improved survival rates. 57 Moreover, patients with multiple primary tumors may be more inclined to focus on adjusting their lifestyle and psychological well-being. Adopting healthy living habits and achieving sound mental health can aid in promoting optimal treatment efficacy and mitigating the risk of tumor reoccurrence. The data of patients with PSCTC were analyzed using time-dependent ROC (AUC value) to assess the prognostic potential of each variable. The results revealed that the grade and age exhibited good predictive abilities. To the best of our knowledge, the use of competing risk models to predict PSCTC mortality has not yet been reported.
In recent years, nomograms have been considered a useful and efficient method of predicting tumor prognosis by researchers.60,61 Zhang et al developed a nomogram to predict the prognosis for PSCTC patients. 20 However, the study did not take into account competing risks of death, and thus prediction model was prone to being biased and may predict too high risks. Considering the primary objective of our study, we constructed a nomogram using the Fine and Gray subdistribution hazard model. The results of time-dependent ROC curves, C-index, calibration curves and DCA confirmed the excellent prognostic value of the nomogram for patients with PSCTC. Additionally, the nomogram we constructed can be used in clinics as a prognostic tool.
Despite this comprehensive analysis of the clinical features and prognostic factors of patients with PSCTC, some limitations remain. First, as a population-based study using the SEER database, some data associated with patient prognoses, such as the mode of resection, chemotherapy strategy, and radiotherapy dose, were missing. Second, owing to the inherent limitations of retrospective studies, our study has certain limitations. Third, to further test our model, an external validation dataset was required. However, because of the small number of cases, no additional PSCTC datasets were available for external validation. For further research, we need to include more cases of PSCTC.
Conclusion
In this study, the Cox regression model and the Fine–Gray competing risk model were employed to identify prognostic factors in patients with PSCTC. Utilizing the Fine–Gray competing risk model, a nomogram was developed to predict the prognosis of PSCTC patients. Our nomogram model is an effective and reliable tool for predicting the prognosis of PSCTC. Clinicians can use the nomogram to provide more accurate prognostic predictions and individualized treatment plans for patients with PSCTC.
Supplemental Material
sj-docx-1-tct-10.1177_15330338241254059 - Supplemental material for A Competing Risk Nomogram for Prediction of Prognosis in Patients With Primary Squamous Cell Thyroid Carcinoma
Supplemental material, sj-docx-1-tct-10.1177_15330338241254059 for A Competing Risk Nomogram for Prediction of Prognosis in Patients With Primary Squamous Cell Thyroid Carcinoma by Ye Tian, Lei He, Bin Zhang, Linfeng Deng and Juan Wang in Technology in Cancer Research & Treatment
Footnotes
Acknowledgments
We acknowledge the efforts of the SEER Program to provide high-quality open resources for researchers.
Data Availability Statement
The raw data supporting the conclusions of this article will be made available by the corresponding author, without undue reservation.
Declaration of Conflicting Interests
The authors declare that the research was conducted in the absence of any commercial or financial relationships that could be construed as a potential conflict of interest.
Ethics Statement
This study, relying solely on data downloaded from the public database and not involving any human participants, did not require ethical approval.
Funding
The authors received no financial support for the research, authorship, and/or publication of this article.
Supplemental Material
Supplemental material for this article is available online.
References
Supplementary Material
Please find the following supplemental material available below.
For Open Access articles published under a Creative Commons License, all supplemental material carries the same license as the article it is associated with.
For non-Open Access articles published, all supplemental material carries a non-exclusive license, and permission requests for re-use of supplemental material or any part of supplemental material shall be sent directly to the copyright owner as specified in the copyright notice associated with the article.