
Abstract
Background
CyberKnife treatment for central lung tumors and mediastinal tumors can be difficult to perform with marker less.
Purpose
We aimed to evaluate a novel tracheobronchial-based method (ie, tracheobronchial tracking) for the purpose of minimally invasive CyberKnife treatment for central lung and mediastinal tumors.
Methods
Five verification plans were created using an in-house phantom. Each plan included five irradiation sessions. The reference plan irradiated and tracked the simulated tumor (using the target tracking volume, TTV). Trachea plans tracked the simulated tracheo-bronchus and irradiated the simulated tumor and included two types of subplans: correlated plans in which the displacement of the simulated tracheobronchial and the simulated tumor were correlated, and non-correlated plans in which these factors were not correlated. Moreover, 15 mm and 25 mm TTVs were evaluated for each plan. The sin waveform and the patient's respiratory waveform were prepared as the respiratory model. Evaluations were performed by calculating the dose difference between the radiophotoluminescent glass dosimeter (RPLD)-generated mean dose values (generated by the treatment planning system, TPS) and the actual absorbed RPLD dose. Statistical analyses were performed to evaluate findings for each plan. Correlation and prediction errors were calculated for each axis of each plan using log files to evaluate tracking accuracy.
Results
Dose differences were statistically significant only in comparisons with the non-correlated plan. When evaluated using the sin waveform, the mean values for correlation and prediction errors in each axis and for all plans were less than 0.6 mm and 0.1 mm, respectively. In the same manner, they were less than 1.1 mm and 0.2 mm when evaluated using the patient's respiratory waveform.
Conclusion
Our newly-developed tracheobronchial tracking method would be useful in facilitating minimally invasive CyberKnife treatment in certain cases of central lung and mediastinal tumors.
Introduction
Stereotactic body radiotherapy (SBRT) is one method for administering external beam radiotherapy (EBRT). The usefulness of SBRT has been reported in the treatment of various regions and cancer types.1-5 The CyberKnife system (Accuray, Sunnyvale, CA) can acquire 2D images every 5 to 150 s by using orthogonal x-ray devices (ie, via a target locating system, TLS), allowing for the delivery of SBRT to a moving target. 6
The CyberKnife system enables two respiratory tracking methods: the Synchrony Respiratory Tracking System (SRTS) and the Xsight Lung Tracking System (XLTS).7,8 The SRTS requires fiducial markers to be placed in or around the target. However, percutaneous placement sometimes causes complications such as pneumothorax and bleeding. 9 In contrast, the XLTS is a fiducial-free non-invasive system that tracks tumors directly10,11 using target tracking volume (TTV). This system matches digitally reconstructed radiograph (DRR) images with the TTV obtained in the TLS using pattern-similarity matching. Following this, a correlation model is generated from tumor locations in various respiratory phases and LED (light-emitting diode) marker signals (based on sensors attached to the body surface). The location of the tumor after 115 ms of treatment is identified using this correlation model. 12 The use of the XLTS is recommended under the following conditions: a tumor diameter of >15 mm in every direction, a tumor location in the peripheral region of the lung, and a tumor location that does not overlap with the vertebral bone (within the TLS). 8 These conditions are due to the fact that XLTS is a method of tracking tumors using contrast differences between the lung and the tumor. First, if the tumor is too small, it is difficult for the operator and the system to recognize it on the TLS. Second, tumors in the hilar region of the lungs tend to overlap with blood vessels and vertebral bone, reducing contrast. Finally, mediastinal tumors cannot be recognized because they are not located in the lungs. These cause the inevitable problem of a difficulty utilizing the TLS for central lung and mediastinal tumors.
To address the problems, we focused on the fact that the tracheo-bronchus contains air and thus shows high contrast in the TLS due to the tracheobronchial wall; hence, we considered a new tracking system using the tracheo-bronchus as basis for the tracking volume in the XLTS of nearby central lung or mediastinal tumors. To the best of our knowledge, no previous studies have evaluated this technique.
The purpose of this study was to develop and evaluate this new method (ie, tracheobronchial tracking) using an in-house phantom. The outcomes evaluated were dose accuracy (obtained using a radiophotoluminescent glass dosimeter, RPLD, Asahi Glass CO., Tokyo, Japan) and tracking accuracy (obtained using log files).
Materials and Methods
Tracheobronchial Tracking
Figure 1 shows a schematic diagram of a typical XLTS at our institution. First, after the planning CT is acquired, the tumor is contoured. Second, the tumor is defined as a TTV. Optimization is then performed, and treatment is performed. Figure 2 shows a schematic diagram of the tracheobronchial tracking methodology evaluated herein. First, to confirm the correlation between respiratory movement of the tumor and the tracheo-bronchus, a four-dimensional computed tomography (4D-CT) image was acquired using a body surface monitoring system (an RPM system, Varian Medical Systems, Palo Alto, CA, USA) under resting respiratory conditions. If there was a correlation, treatment planning was performed using XLTS. Second, the tracheo-bronchus nearby the tumor was contoured as the TTV; the setting depended on the size and location of the tumor. Then, the TTV was confirmed by DRR imaging, and optimization was performed in order to deliver the prescribed dose to the tumor. Finally, treatment was performed using tracheobronchial tracking.

Schematic diagram of the XLTS at our institution.
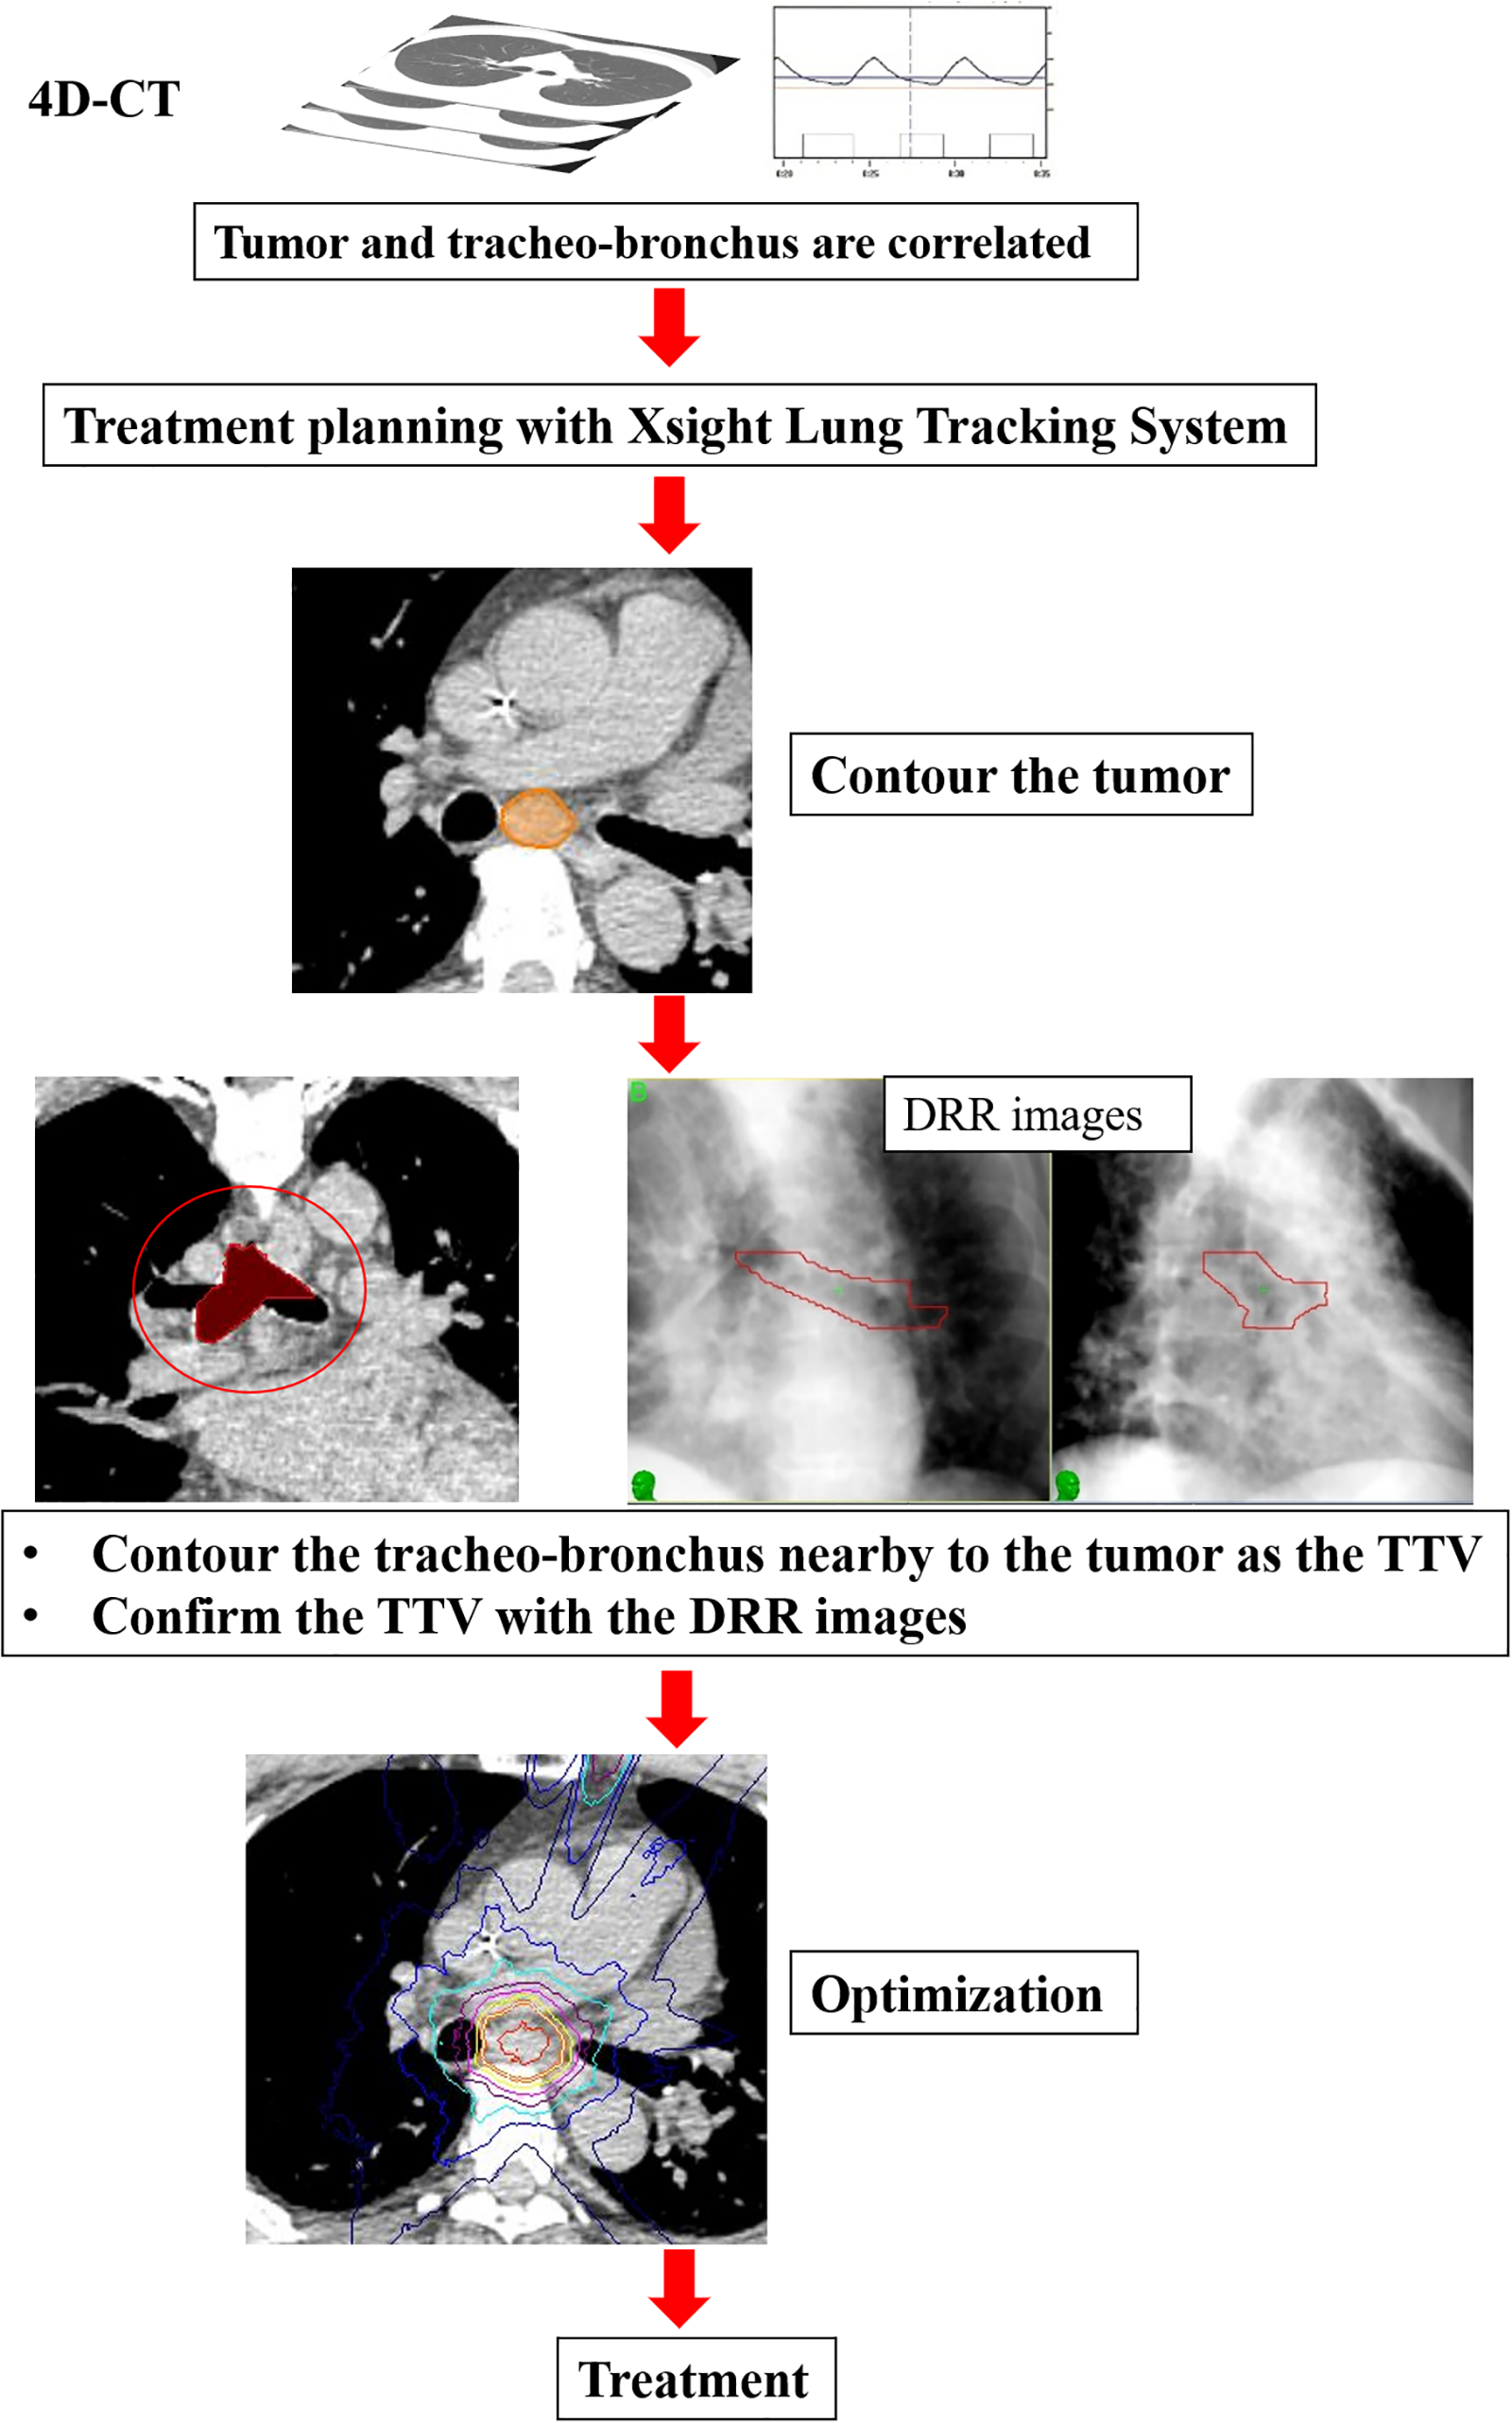
Schematic diagram of the tracheobronchial tracking. The tracheo-bronchus nearby to the tumor was contoured as the TTV. Treatment planning is performed with the Xsight Lung Tracking System.
Radiophotoluminescent Glass Dosimeter
In this study, point doses were evaluated using the RPLD. RPLDs are individual dosimeters that can indirectly measure absorbed doses using radio photo luminescence (RPL), which emits light in proportion to the amount of radiation energy, and thus has few fading phenomena. Silver-activated phosphate glass element containing silver ions with a composition of 31.55% P, 51.16% O, 6.12% Al, 11.00% Na, 0.17% Ag, effective atomic number of 12.039 and density of 12.039 g/cm3. 13 The small size of RPLD makes it suitable for measuring small fields.14,15
Verification Plan
This retrospective study was approved by the institutional review board (IRB) of our hospital (receipt number: 2023-2). The verification plans evaluated herein consisted of a reference plan (Ptumor, with the simulated tumor as the TTV) and a trachea plan (Ptra, with the simulated tracheo-bronchus as the TTV). Moreover, the Ptra consisted of a correlated (Ptra, corr) and a non-correlated plan (Ptra, non−corr); Ptra, corr correlated the displacement of the simulated tracheo-bronchus and the simulated tumor, while Ptra, non−corr did not correlate with this displacement. The Ptra, non−corr were evaluated with the aim of excluding scenarios where they produce the same results as plans with correlations, even in the absence of actual correlation. In standard XTLS, the tumor itself is defined as the TTV (ie, the size approximates the tumor). However, our proposed method used the non-tumor region as the TTV. Therefore, the Ptra defined two sizes for the TTV (15 mm and 25 mm), centered on the tracheal bifurcation as well as in various distributed regions. The 15 mm represents the lower limit under the recommended conditions of the vendor, while 25 mm includes a size sufficient to encompass the diameter of the simulated tumor. To verify the above plans, an experiment was conducted using a dynamic phantom. Figure 3a shows the appearance of the novel dynamic phantom (APEX Medical Inc., Tokyo, Japan), which has two drive systems operating in three axes and was developed jointly with the University of Yamanashi. The accuracy of dynamic phantom is shown in the prior literature. 16 The surrogate part that reproduces respiratory amplitude is attached to the anterior-posterior (AP) axis of Drive-1. Figure 3b shows a 20 mm acrylic simulated tumor and an acrylic box (60 × 70 × 50 mm), which was designed in order to consider x-ray build-up and such that the RPLD could be inserted directly into the center of the simulated tumor. Figure 3c shows the in-house phantom setup for the Ptra. The in-house phantom consists of a dynamic phantom, a simulated tumor, and a simulated tracheo-bronchus (total length: 12.5 cm, outer diameter: 2.5 cm, inner diameter: 1.5 cm, density: 1.14-1.15 g/cm3) created via a 3D printer (Stratasys, Ltd, Eden Prairie, MN, USA) and a thoracic vertebral phantom (Avice Inc., Tokyo, Japan). The simulated tumor was set at the level of the tracheal bifurcation of the simulated tracheo-bronchus, 75 mm from the tracheal bifurcation to the center of the simulated tumor on the right side; the RPLD was set at parallel locations to the left and to the right of the simulated tumor.

(a) Appearance of the dynamic phantom with two drive systems operating in three axes. (b) A 20 mm acrylic simulated tumor and an acrylic box (60 × 70 × 50 mm), which was designed in order to consider x-ray build-up; the RPLD could be inserted directly into the simulated tumor. (c) Experimental set-up of the Ptra. (d) Experimental set-up of the Ptumor.
Figure 3d shows the in-house phantom setup for the Ptumor. If the simulated tumor overlaps the vertebrae in the TLS, it may not be tracked properly, so the placement of the simulated tumor in this study was designed so that it does not overlap the vertebrae in the TLS; the direction of the RPLD was the same in the Ptra.
The simulated displacement of the simulated tracheo-bronchus and the simulated tumor was expressed using the actual displacement of the tracheo-bronchus as measured in lung cancer patients. More specifically, the respiratory displacement of the translational axis at the tracheo-bronchus was calculated from 4D-CT images (Optima CT660; GE Medical Systems, Milwaukee, WI, USA; 120 kV, 200 mA, 1.25 mm slice thickness, 500 mm field of view) in 10 patients who underwent SBRT using XLTS for lung cancer at our institution.
For evaluating the calculation method, CT images of 10 phases were imported into 3D-Slicer ver. 4.11, a free, open source and multi-platform image analysis software widely used for medical, biomedical, and related imaging research (https://slicer.org). The coordinates of the tracheal bifurcation were then obtained for each phase. The minimum values of each axis for the in-house phantom were 0; the other phases were calculated accordingly. The waveforms of one cycle obtained by 4D-CT were divided by 10% intervals (ie, from 0% to 90%).
In the current study, displacement data for a typical sin function was also prepared, and one typical patient's displacement data was simulated from the displacement data of 10 patients. In addition, one respiration cycle was set to 3 s. 17 The in-house phantom requires a value input every 30 ms. Therefore, values for 10 phases were interpolated to 100 points using MATLAB software (MathWorks, Natick, MA, USA). It is necessary to consider whether the volume changes with respiration, because this method defines the tracheobronchial as the TTV.
The tracheobronchial air regions were entered into MIM Maestro Software (Cleveland, OH, USA), including the TTV range defined in this study and using 30% phase images (WW 1500, WL −550). The contours were propagated to each phase using deformable image registration in order to calculate the air volume in each phase. Verification planning was performed using CT images (120 kV, 400 mA, 1.25 mm slice thickness, 500 mm field of view) with the CyberKnife MultiPlan TPS (ver. 3.2.0, Accuray Radiotherapy, Sunnyvale, CA, USA).
The simulated tumor was defined as the target (which also serves as the TTV in the Ptumor) and the RPLD was defined as the target RPLD. As shown in Figure 4a and 4b, the TTV of the Ptra was defined for the 15 mm and 25 mm regions centered on the tracheal bifurcation. As shown in Figure 4c, the TTV of the Ptumor was defined as that for the simulated tumor. All planning was conducted with a collimator of 20 mm, a target-RPLD mean dose of approximately 2 Gy/1fr, and a Monte Carlo simulation (uncertainty: 1%).
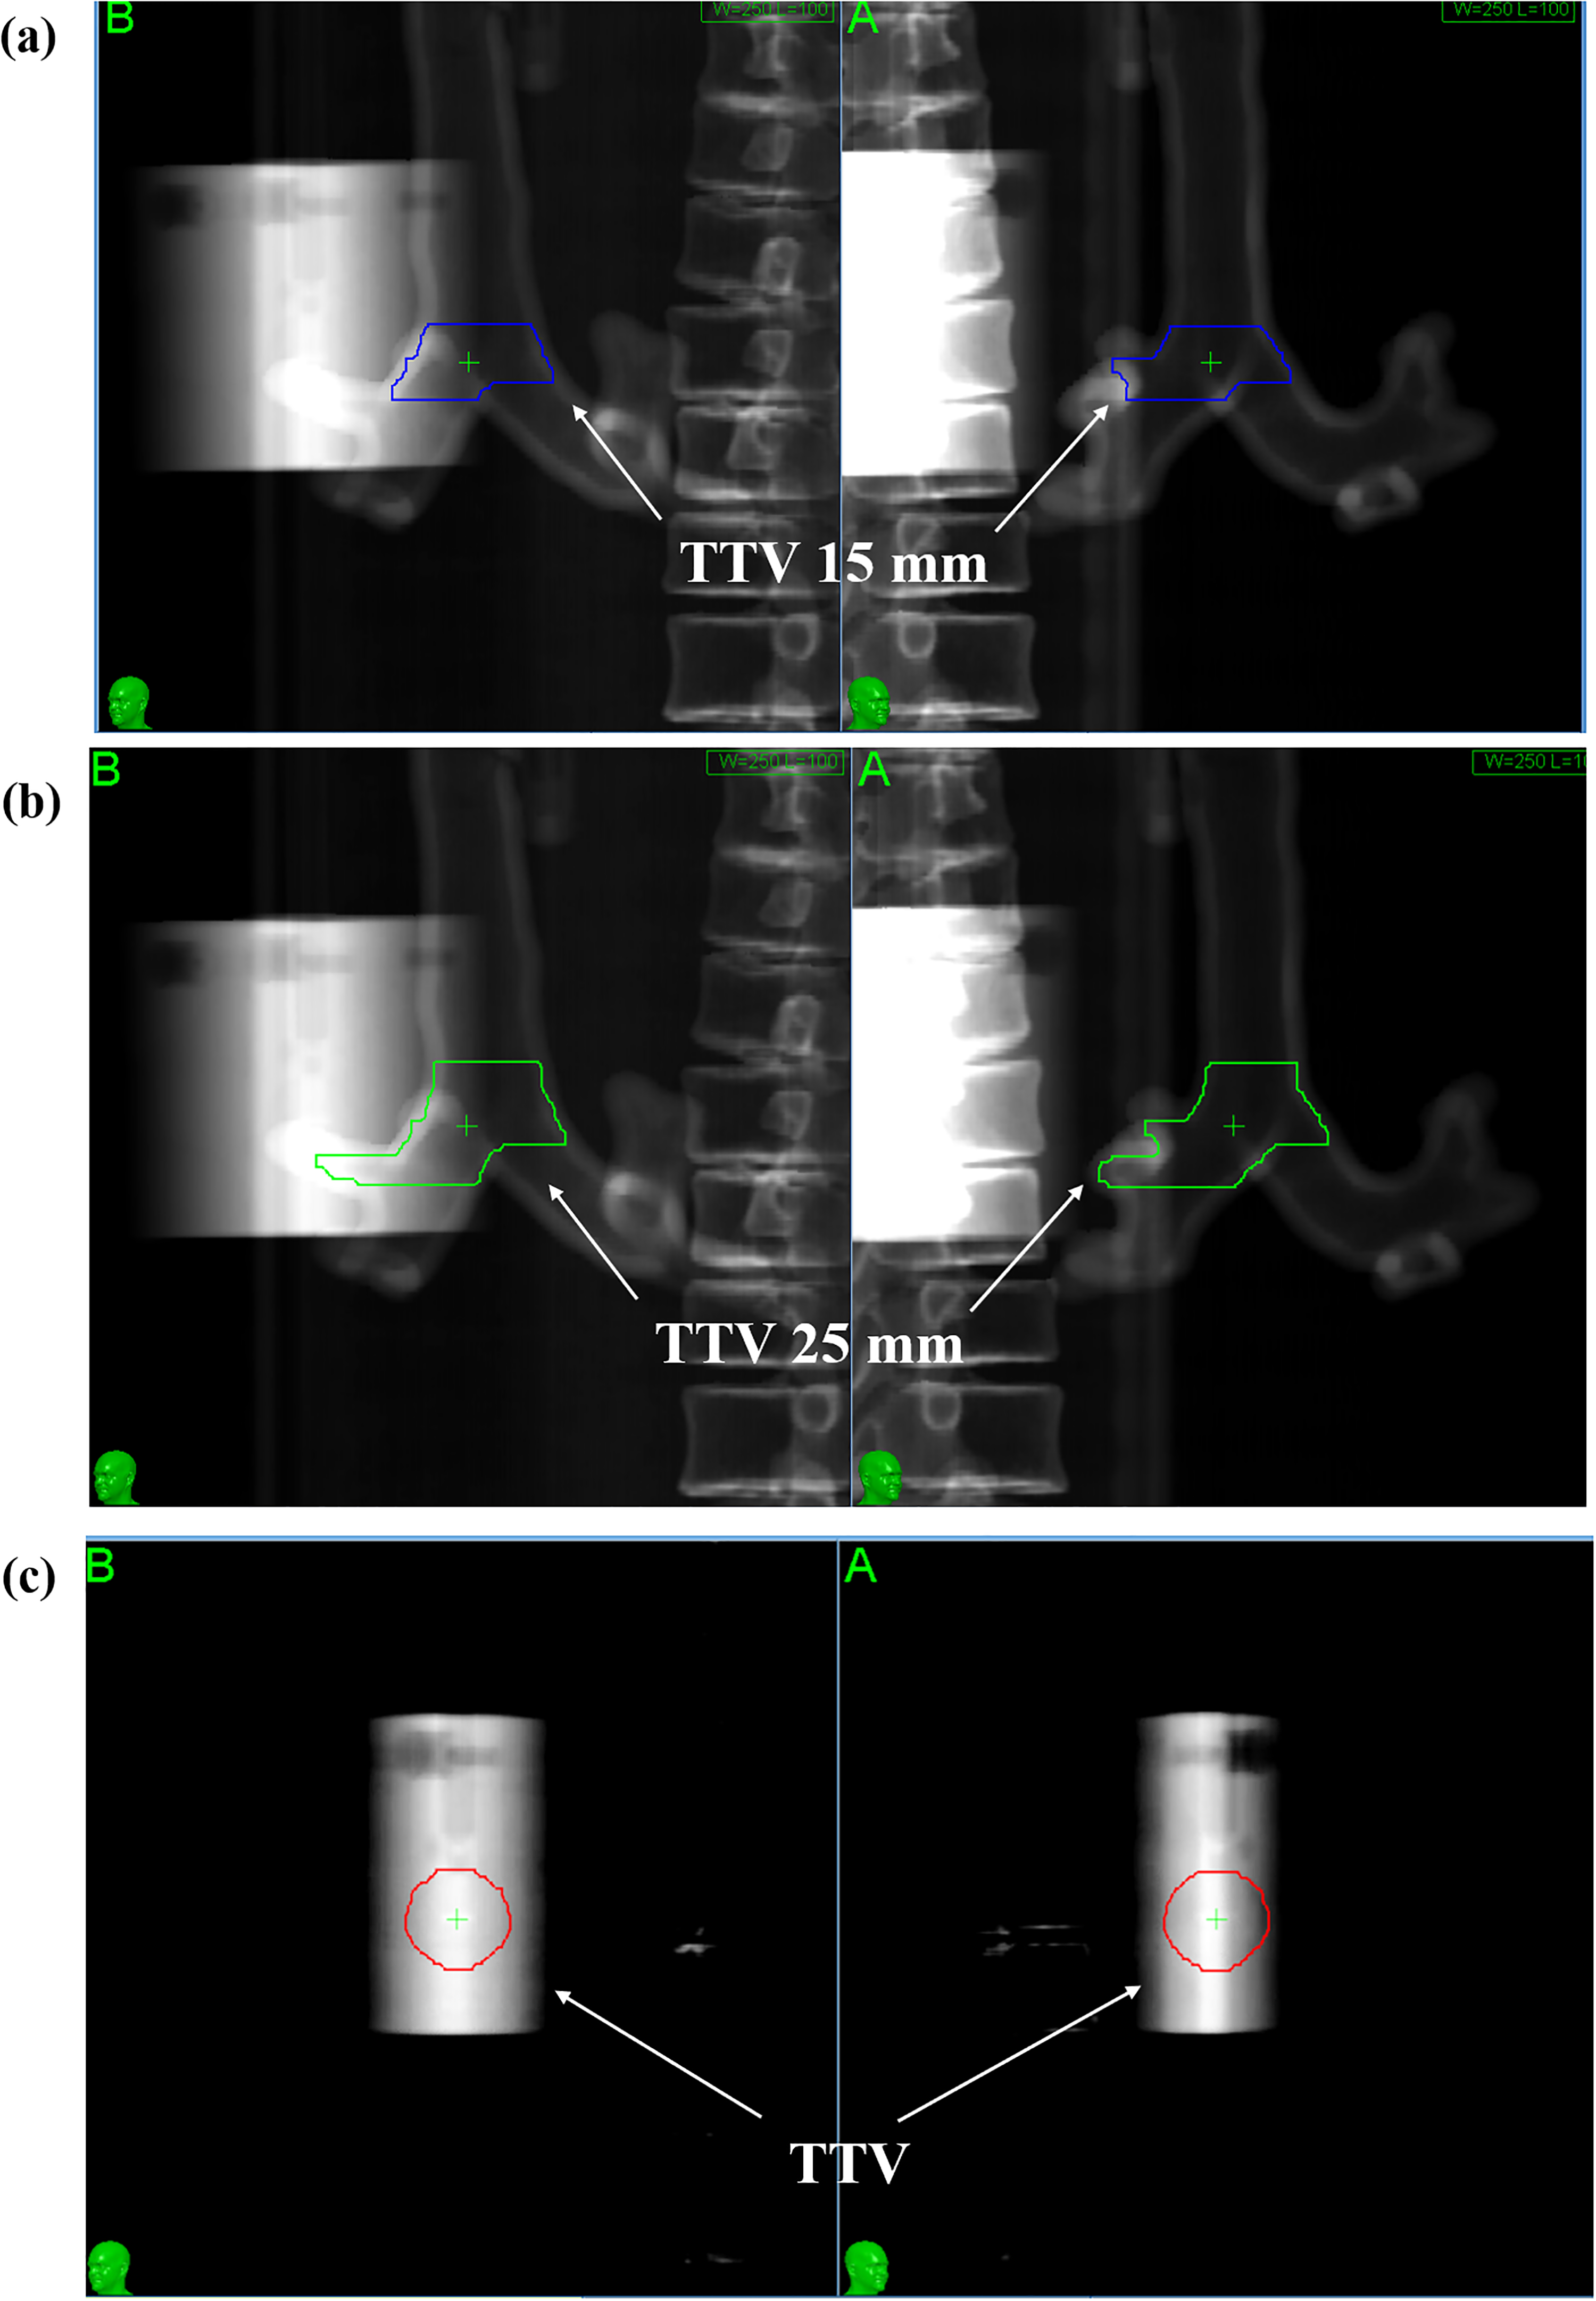
DRR images of each plan. (a) The TTV defined in the Ptra, corr and Ptra, non−corr (TTV 15 mm). (b) The TTV defined in Ptra, corr and Ptra, non−corr (TTV 25 mm). (c) The TTV defined in the Ptumor.
Each plan included irradiation conducted five times with different RPLDs, and the TLS imaging parameters were performed at 80 kV, 80 mA, and 80 ms (irradiation interval time, 30 s). Furthermore, the algorithm parameters were set as follows: uncertainty threshold of 40%, dxAB threshold of 2.5 mm, and tracking range of x: 4 mm, y: 4 mm. Confirmation of tracking during irradiation was achieved through the evaluation of these parameters and the image recognition by the operator. The calculated tracheobronchial displacement was used for designing the simulated tracheo-bronchus and simulated tumor in the Ptra, corr. On the other hand, in the Ptra, non−corr, the superior-inferior (SI) axis displacement of the simulated tumor was changed to the opposite of positive and negative. In the Ptumor, the same displacement as that in the Ptra, corr was used for the simulated tumor.
Evaluation
Dose differences and tracking errors were evaluated using CyberKnife G4 system (version 10.5), based on the results of the Ptra using the results obtained within the Ptumor as a reference. Dose evaluation was performed using the mean value of the RPLD readings (
RPLD readings were taken on a FGD-1000 (AGC Techno Glass Co., LD, Shizuoka, Japan) and

The dose differences were then calculated using the following formula:

Tracking accuracy was evaluated by analyzing correlation and prediction errors.
In building the correlation model, multiple x-ray images are acquired in the TLS to determine the position of the tracking target at various positions in the respiratory cycle. 20 The correlation error results from the difference between the output of the correlation model and the position of the tracking target determined by the TLS. In addition, the prediction errors arise from differences between the forecasting algorithm and the corresponding correlation model. 21 During treatment, CyberKnife generates the following log files: ModelPoints.log, Modeler.log, Predictor.log, and ERsiData.log.12,20,22 The correlation error analysis was performed using the ModelPoints.log file in order to calculate the values for the AP, left-right (LR), and SI axes. The prediction error for the AP, LR, and SI axes were calculated using Modeler.log, Predictor.log, and ERsiData.log, respectively. 3D coordinates of the target are recorded in patient coordinates in ModelPoints.log, while the 3D coordinates in Modeler.log, Predictor.log, and ERsiData.log are recorded in robot coordinates. 8 Therefore, all coordinates were transformed from robot coordinates to patient coordinates using the Coord-transfm file of the CyberKnife system.
All data were statistically analyzed using Wilcoxon signed-rank tests, which were conducted using IBM SPSS statistical software (ver. 27, BM, Armonk, NY, USA).
Results
Tracheobronchial Movement and Air Volume
Figure 5 shows the position of the 10 phases of tracheo-bronchus acquired using 4D-CT.
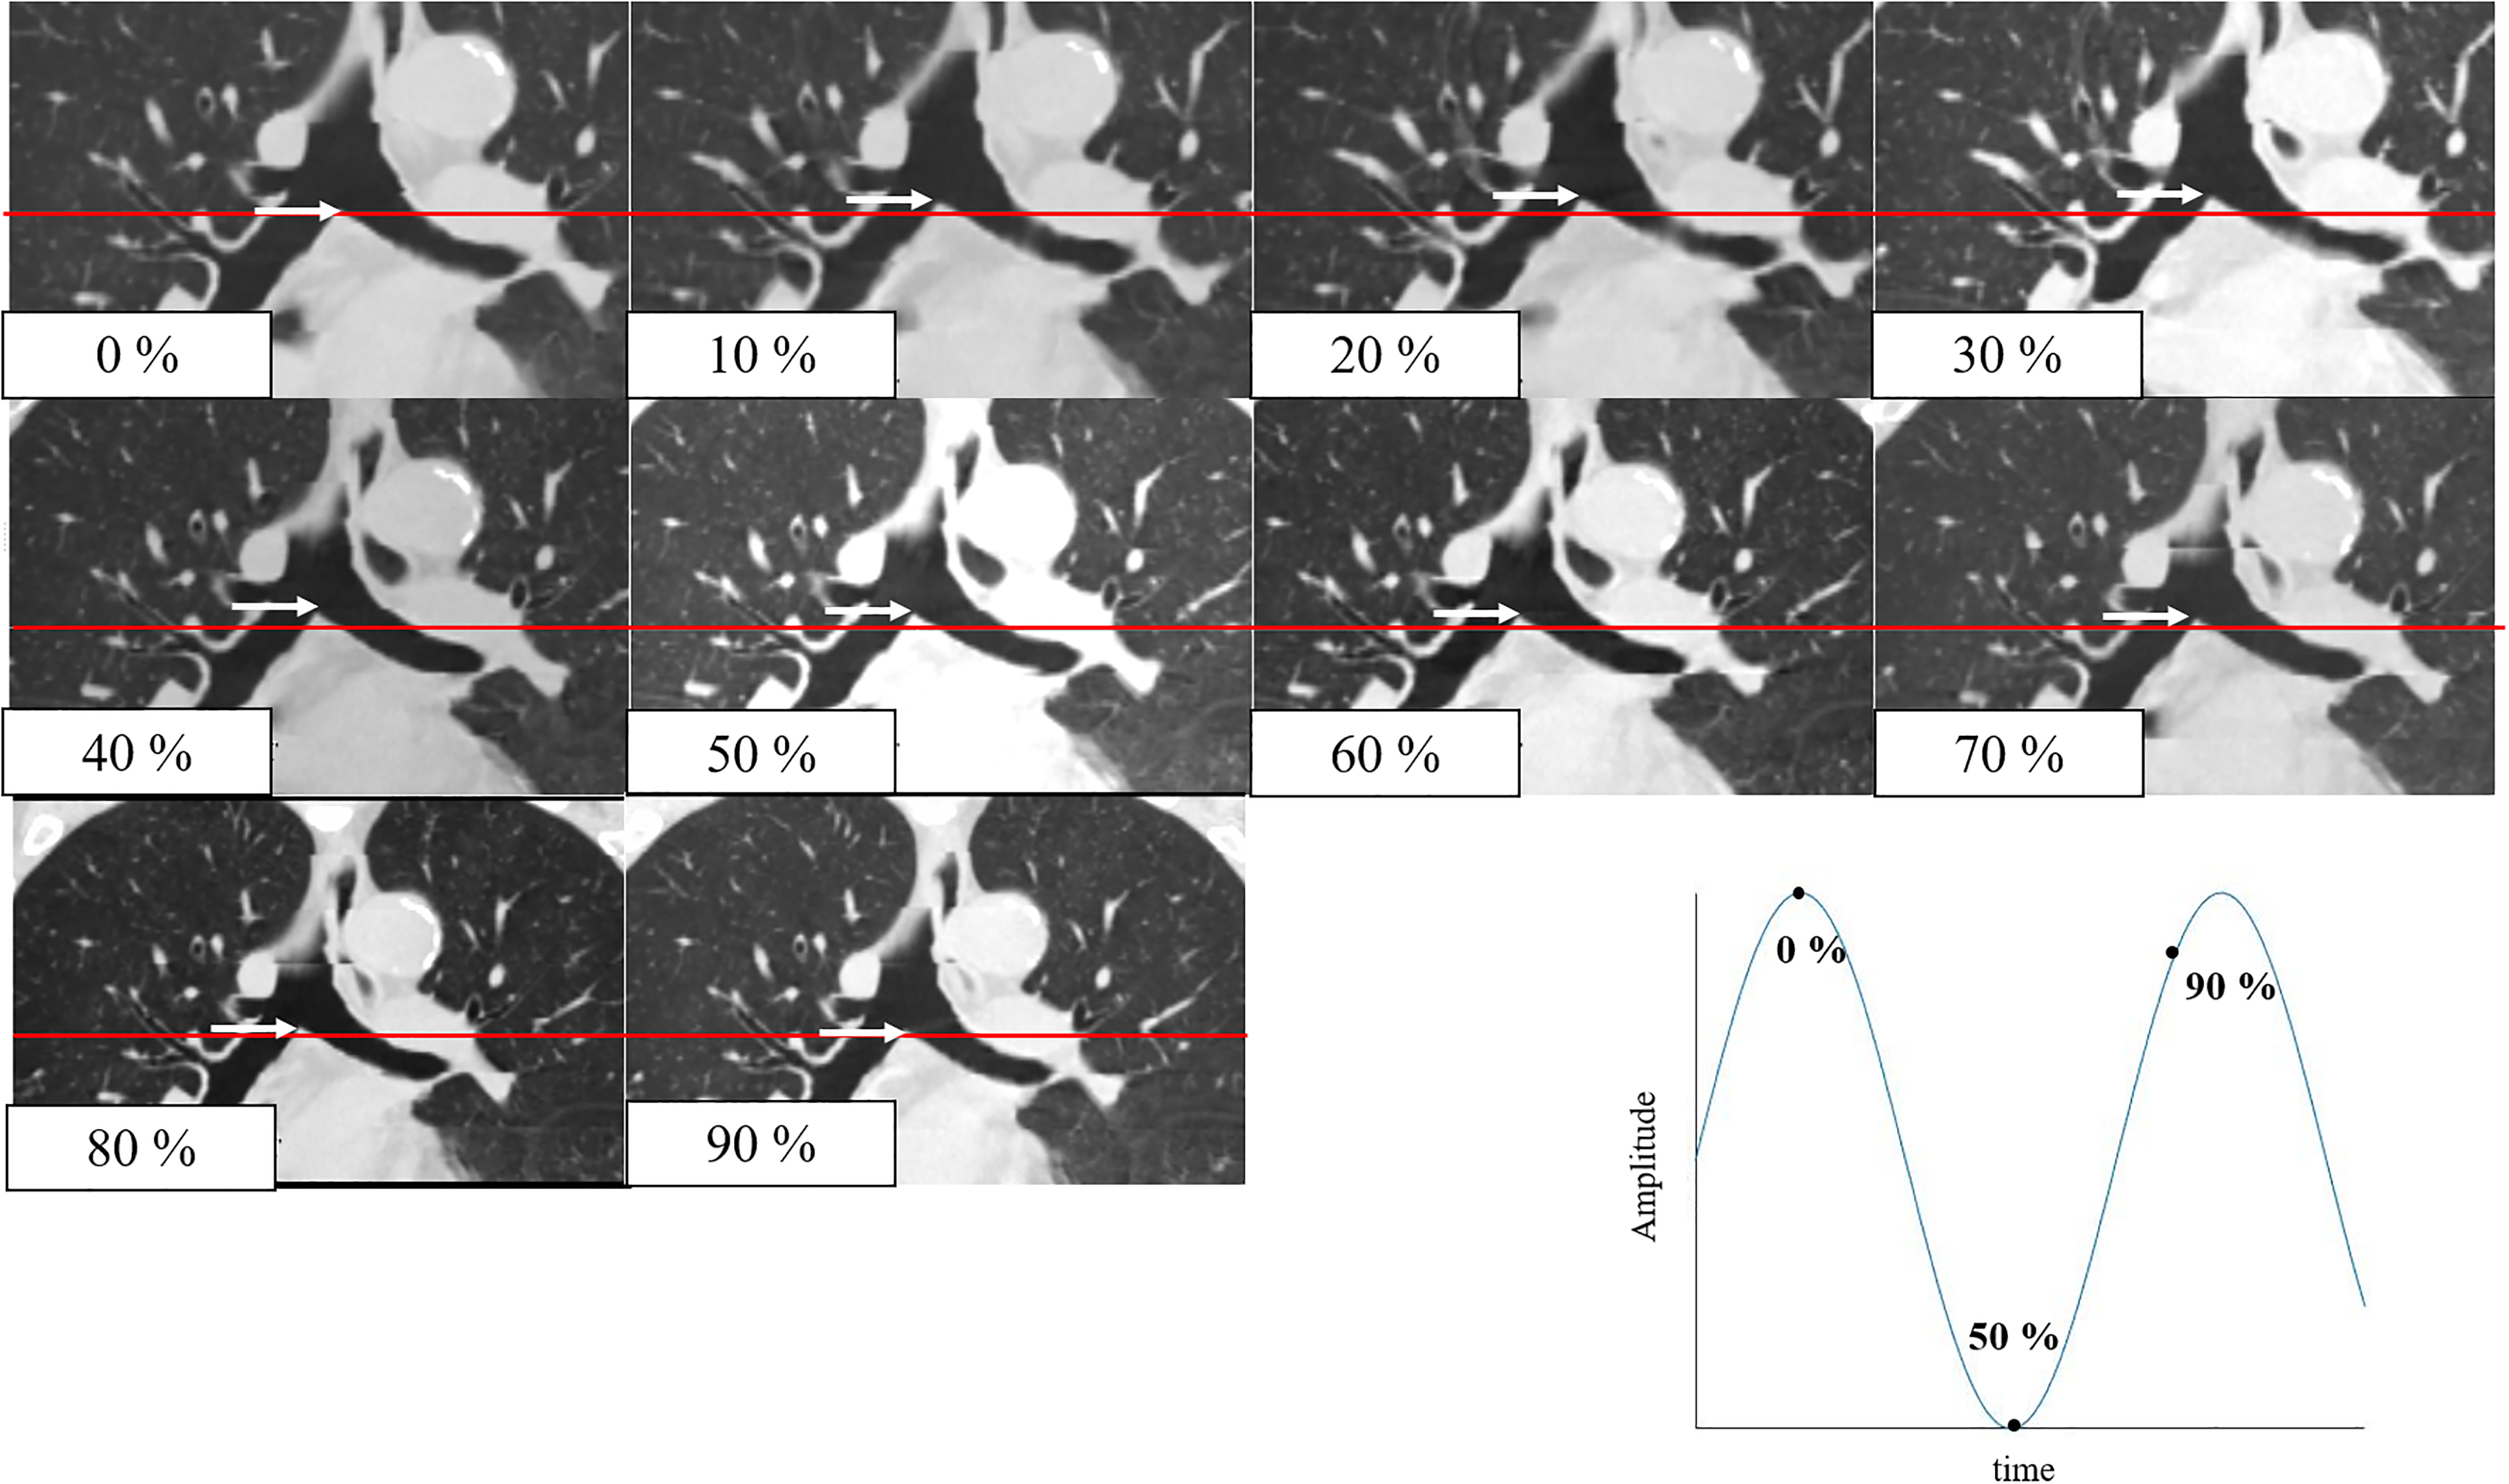
The position of tracheo-bronchus in each phase acquired using 4D-CT. The position of the tracheal bifurcation at 0% is indicated by a red line, and the position of the tracheal bifurcation in each phase is indicated by a white arrow.
Moreover, Figure 6 shows the displacements in each axis for the 10 patients and the displacements used for evaluation, as well as the sin waveforms used.

The displacements in each axis for the 10 patients and the displacements used for evaluation, and the sin waveforms used (red line). The maximum displacement patient waveforms used in the verification were 1.57 mm, 1.24 mm, and 3.75 mm in the AP, LR, and SI axes, respectively.
The mean and standard deviation (SD) of the maximum tracheobronchial displacement for 10 patients and the maximum displacement used in the verification are presented herein. More specifically, the mean maximum values for the 10 patients were 2.01 ± 0.84 mm, 1.87 ± 0.54 mm, and 5.88 ± 2.77 mm in the AP, LR, and SI axes, respectively; the maximum values of displacement used in the verification were 1.57 mm, 1.24 mm, and 3.75 mm in the AP, LR, and SI axes, respectively. In addition, the standard deviation (SD) of the tracheobronchial air volume for each respiratory phase ranged from ± 0.05 cc to ± 0.38 cc.
Dose Accuracy
Figure 7 shows information on the generated verification plans. All plans comprised 85 beams and 85 nodes, and the mean RPLD dose was 2.00 Gy for all plans. Prescribed isodose line of test plan was 94.9%, 95.2%, 95.1%, 94.8%, and 95.1% for the Ptra, corr (TTV 15 mm), Ptra, corr (TTV 25 mm), the Ptumor, the Ptra, non−corr (TTV 15 mm), and the Ptra, non−corr (TTV 25 mm), respectively. Table 1 shows the results for the absorbed dose in the Ptumor and Ptra using the sin waveform. The means and SDs of the dose differences were as follows: 1.22 ± 0.80%, 0.98 ± 0.75%, 1.37 ± 0.91%, 4.75 ± 0.80%, and 4.51 ± 0.43% for the Ptumor, Ptra, corr (TTV 15 mm), Ptra, corr (TTV 25 mm), Ptra, non−corr (TTV 15 mm), and Ptra, non−corr (TTV 25 mm), respectively.

Information on the generated verification plans. The upper row is the schematic diagram for incident beam directions and the lower row is the dose distribution. The white arrow indicates the beam while the red arrow indicates the simulated tumor.
The Results of the Absorbed Dose for the Ptumor and the Ptra in sin Waveform.

The results of the statistical analysis for each verification plan are likewise presented herein. There were no statistically significant differences between the Ptumor and the Ptra, corr (TTV: 15 mm, 25 mm) (P = .893). By contrast, between Ptumor and Ptra, non−corr (TTV 15 mm, 25 mm), respectively (P = .043). In addition, a statistical analysis was performed with regard to the TTV size in the Ptra; there were no statistically significant differences found between the TTV of 15 mm and the TTV of 25 mm for the Ptra, corr and Ptra, non−corr, respectively (P = .345, .500).
Table 2 shows the results for the absorbed dose in the Ptumor and Ptra using the patient's respiratory waveform. The means and SDs of the dose differences were 1.07 ± 0.67%, 0.72 ± 0.62%, 1.16 ± 0.60%, 3.03 ± 1.23%, and 4.05 ± 1.43% for the Ptumor, Ptra, corr (TTV 15 mm), Ptra, corr (TTV 25 mm), Ptra, non−corr (TTV 15 mm), and Ptra, non−corr (TTV 25 mm), respectively.
The Results of Absorbed Dose for the Ptumor and the Ptra in the Patient's Respiratory Waveform.
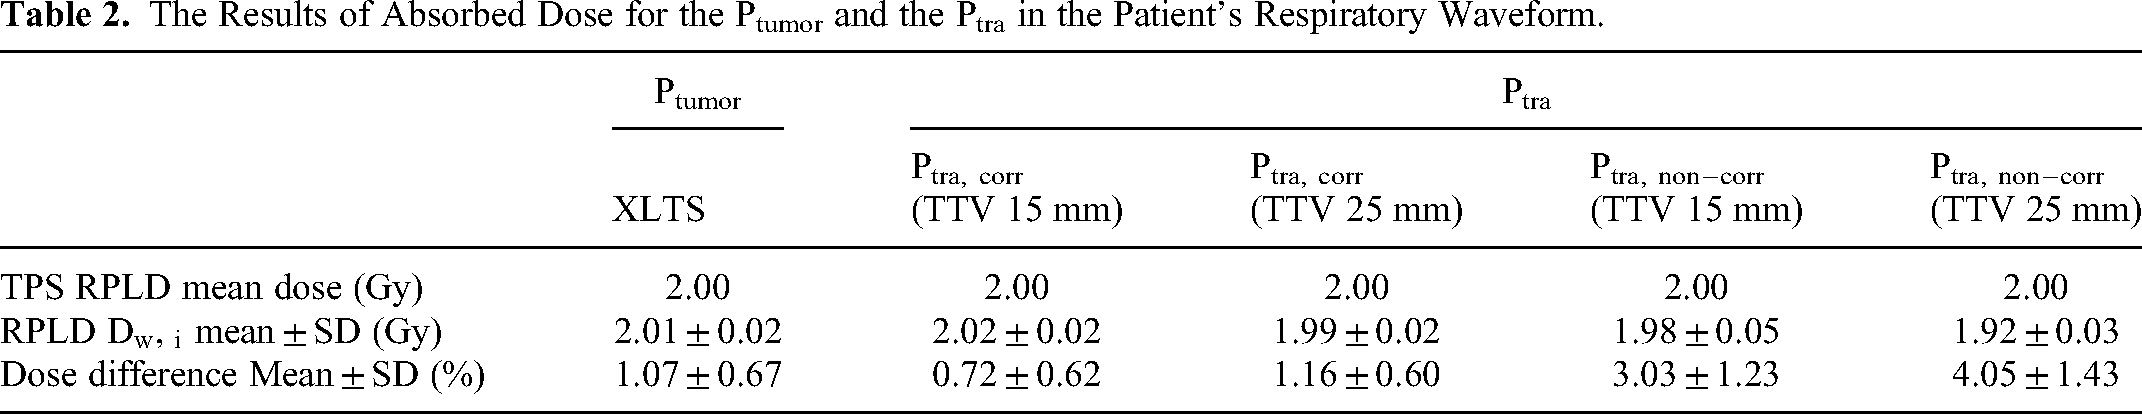
The results of the statistical analysis for each verification plan are likewise presented herein. There were no statistically significant differences between the Ptumor and the Ptra, corr (TTV: 15 mm, 25 mm) (P = .345, .893). By contrast, between Ptumor and Ptra, non−corr (TTV 15 mm, 25 mm), respectively (P = .043). In addition, a statistical analysis was performed with regard to the TTV size in the Ptra; there were no statistically significant differences found between the TTV of 15 mm and the TTV of 25 mm for the Ptra, corr and Ptra, non−corr, respectively (P = .080, .345).
Tracking Accuracy
Figure 8a shows the means and SDs of the correlation error in each axis for each plan using the sin waveform. The number of live images acquired was 260, 288, 284, 284, and 288 images for the Ptumor, the Ptra, corr (TTV 15 mm), the Ptra, corr (TTV 25 mm), the Ptra, non−corr (TTV 15 mm), and the Ptra, non−corr (TTV 25 mm), respectively; no value was larger than 1.1 mm. Moreover, the mean values were less than 0.6 mm for each axis in all verification plans. Among the three axes, the SI axis, which had the largest average value, showed a proportion (0.46%) where only Ptra, non−corr (TTV25 mm) exceeded 1 mm, but there were no plans exceeding 2 mm. No statistically significant differences were observed between the Ptumor and the Ptra, corr (TTV 15 mm, 25 mm) in the LR axis, or between the Ptumor and the Ptra, non−corr (TTV 15, 25 mm) in the AP, LR and SI axes, respectively (P = 1.00). Next, the Ptra were compared by differences in TTV size, and statistically significant differences were observed on the Radial axis (P < .001).

(a) The means and sds of the correlation error in each axis for each plan in the sin waveform. No value was larger than 1.1 mm. Moreover, the mean values were less than 0.6 mm for each axis in all verification plans. (b) The means and SDs of the prediction error in each axis for each plan in the sin waveform. No value was larger than 0.2 mm. Moreover, the mean values were less than 0.1 mm for each axis in all verification plans. (c) The means and SDs of the correlation error in each axis for each plan in the patient's respiratory waveform. No value was larger than 3.0 mm. Moreover, the mean values were less than 1.1 mm for each axis in all verification plans. (d) The means and SDs of the prediction error in each axis for each plan in the patient's respiratory waveform. No value was larger than 1.0 mm. Moreover, the mean values were less than 0.2 mm for each axis in all verification plans.
Next, Figure 8b shows the means and SDs for the prediction error in each axis and for each plan using the sin waveform. The number of prediction error data in each axis was 12,252, 10,216, 10,227, 10,406, and 10,341 data for the Ptumor, the Ptra, corr (TTV 15 mm), the Ptra, corr (TTV 25 mm), the Ptra, non−corr (TTV 15 mm), and the Ptra, non−corr (TTV 25 mm), respectively. The values were less than 0.2 mm in all axes for all verification plans. Moreover, the mean values were less than 0.1 mm for each axis in all verification plans. No statistically significant differences were observed between the Ptra, corr (TTV 25 mm) and the Ptra, non−corr (TTV 25 mm) in the SI axis (P = .556). The Ptra were also compared by differences in TTV size, and statistically significant differences were observed for all axes (P < .001).
In addition, Figure 8c shows the means and SDs of the correlation error in each axis for each plan using the patient's respiratory waveform. The number of live images acquired were 196, 204, 204, 220, and 224 images for the Ptumor, the Ptra, corr (TTV 15 mm), the Ptra, corr (TTV 25 mm), the Ptra, non−corr (TTV 15 mm), and the Ptra, non−corr (TTV 25 mm), respectively; no value was larger than 3 mm. Moreover, the mean values were less than 1.1 mm for each axis in all verification plans. Among the three axes, the SI axis, which had the largest average value, showed the following proportions exceeding 1 mm for the respective parameters:21.73%, 24.02%, 12.76%, 48.19%, and 38.69% for the Ptra, corr (TTV 15 mm), the Ptra, corr (TTV 25 mm), the Ptumor, the Ptra, non−corr (TTV 15 mm), and the Ptra, non−corr (TTV 25 mm), respectively. Furthermore, the proportions exceeding 2 mm were as follows: 0%, 0.16%, 0.51%, 7.38%, and 6.85%, respectively. No statistically significant differences were observed between the Ptumor and the Ptra, corr (TTV 25 mm), or between the Ptumor and the Ptra, non−corr (TTV 15 mm) in the LR axis, respectively (P = .070, .271). In contrast, statistically significant differences were observed between the Ptra, corr (TTV 15 mm, 25 mm) and the Ptra, non−corr (TTV 15 mm, 25 mm) in the LR and SI axes (P < .001). Next, the Ptra were compared by differences in TTV size, and statistically significant differences were observed on the LR axis (P < .001). Finally, Figure 8d shows the means and SDs for the prediction error in each axis and for each plan using the patient's respiratory waveform. The number of prediction error data in each axis was 11,255, 10,538, 10,477, 11,511, and 11,435 data for the Ptumor, the Ptra, corr (TTV 15 mm), the Ptra, corr (TTV 25 mm), the Ptra, non−corr (TTV 15 mm), and the Ptra, non−corr (TTV 25 mm), respectively. The values were less than 1.0 mm in all axes for all verification plans. Moreover, the mean values were less than 0.2 mm for each axis in all verification plans. Statistically significant differences were observed between the Ptumor and Ptra in all axes (P < .001). The Ptra were also compared by differences in TTV size, and statistically significant differences were observed for all axes (P < .001).
Discussion
Higher biological doses can be delivered with stereotactic radiotherapy as compared with more standard therapeutic modalities. However, it can be difficult to prescribe high-dose SBRT for central lung tumors because of the proximity of the tumor to critical organs and organ system components such as the esophagus, heart, blood vessels (ie, the cardiovascular system), and the trachea. 23 Nuyttens et al performed SBRT for 58 central lung tumors (in tumors located < 2 cm from the tracheobronchial region or esophagus, tumors located < 6 mm from the heart, and tumors located in the mediastinum) in 56 patients and reported a local control rate of 76% over the course of 2 years. 24
The placement of fiducial markers in this study was performed using several methods, including previously reported intravascular and percutaneous methods as well as a bronchoscopy-based method.24,25 The complications of marker placement were not considered, although fiducial markers were placed in all patients. Fiducial marker placement using the intravascular method or bronchoscopy reduces the risk of pneumothorax; however, these methods are quite invasive. Therefore, developing a safer method of tumor tracking is important. However, the existing XLTS cannot be applied to central lung and mediastinal tumors.
Our method is minimally invasive, as it can be performed without the use of fiducial markers if there is a correlation between the tracheobronchial region and the tumor due to respiration. In this method, the tracheo-bronchus is used as the TTV, therefore, we calculated changes in tracheobronchial displacement and air volume during the respiratory cycle. We found that displacement of the SI axis was larger than that of the other axes. This finding may be mediated by the effects of lung expansion due to breathing. Next, changes in tracheobronchial air volume were calculated in 10 patients. The change per respiration was less than 1.0 cc, and the tracheo-bronchus was considered to be poorly stretched due to the presence of tracheal cartilage. This suggests that defining the tracheo-bronchus as the TTV may not affect volume differences associated with respiration. In our study, the average motion of the tracheo-bronchus was 2.01 ± 0.84 mm, 1.87 ± 0.54 mm, and 5.88 ± 2.77 mm in the AP, LR, and SI axes, respectively. To our best knowledge, there are no literature reports specifically measuring the motion of the tracheo-bronchus and the volume of air in the tracheo-bronchus. Furthermore, the respiratory motion of the tracheo-bronchus should be evaluated in future studies with more cases. According to AAPM TG 76, respiratory motion of lung cancer is reported to have a significant average range of 3 to 22 mm predominantly in the cranial-caudal direction. 26 However, this report also includes motion of the lower lobes. Therefore, we consider this technique primarily applicable to cases involving lymph node metastases near the bronchi or relatively immobile lung tumors. Additionally, we believe that even in cases where the correlation is weak, there are instances where increasing the margin size provides more benefits compared to the risks of bleeding or pneumothorax. Future studies should include evaluation of respiratory motion by tumor location.
The evaluated outcomes for the reported method were absorbed dose and tracking accuracy. Dose evaluation was performed using the RPLD placed on the simulated tumor. As mentioned above, a total of five verification plans were created. Although the RPLD is angle-dependent,13,27 CyberKnife is multi-beam and follows respiration. Hence, it is difficult to compensate for each beam. Therefore, in this study, five plans were created using the same nodes and beams as much as possible. Evaluation of this method was conducted based on the results of the Ptumor; specifically, dose evaluations and tracking evaluations were performed. With regard to dose evaluations, the results for the Ptra, corr were not significantly different from those of the Ptumor. The standard uncertainty of the measured RPLD dose is reported to be 1.4%. 28 Even considering this, the results of the Ptra, corr were lower than the ± 5% dose accuracy required for radiation therapy as reported in the ICRP (International Commission on Radiological Protection) report. 29 The results for the Ptra, non−corr were significantly different from all of the other simulated plans and there were no statistically significant differences in the TTV size between the Ptra.
We analyzed correlation and prediction errors based on the generated log files in order to track accuracy. There were statistically significant differences in both correlation and prediction errors between the Ptumor and Ptra on almost all axes. The reason for the observed significance is that the correlation error was analyzed for both waveforms, with mean and standard deviation calculated from approximately 200 data points each. Similarly, prediction error was analyzed for both waveforms, with mean and standard deviation calculated from approximately 10,000 data points each. The large amount of data and low variability likely contributed to the significance. Moreover, Nakayama et al reported an analysis of correlation and prediction errors in the XLTS. 22 Although this report was based on clinical data, the results of our study are similar to that of prior published research and any real differences in plans are to be considered small. These results suggest that it is possible to treat the tracheo-bronchus defined according to the TTV using the XLTS. On the other hand, this method should be used only after adequate prior correlation of tumor and bronchial motion has been confirmed, otherwise its use should be avoided.
The limitations of this study are as follows. First, since the tracheo-bronchus is located close to the heart, it is suggested that displacement may be affected. However, this was not evaluated in our study. Furthermore, although this study focused on tumors at the level of the tracheal bifurcation, it should also be performed in other situations, such as when the tumor is at a different location. Second, displacement of the surrogate section was performed in the same way as the displacement of the AP axis of the tracheo-bronchus due to the structure of the in-house phantom. In the lungs, respiratory forces are converted into airflow, which is converted into diaphragmatic contraction. These dynamics cause the lungs to expand and the tumor to move. 30 In actual patients, the respiratory width and lung morphology are irregular, and tumors especially closer to the lower lobes migrate more significantly, which may affect tracking and irradiation results. 17 In this study, the respiratory cycle was evaluated as 3 s. However, it has been reported that the tracking error increases when the respiratory cycle is short or when breathing is erratic.31,32 Therefore, it is necessary to confirm our findings using various waveforms, including real respiratory waveforms. Third, in cases where there is a correlation between tumor and tracheo-bronchus motion, the results of correlation error and prediction error suggest the potential for reducing margins. However, in cases where the correlation between tumor and tracheo-bronchus motion is weak, there is a possibility of increased margins. The evaluation of margins remains a subject for future study. Fourth, this study used 85 beams and a dose of approximately 2 Gy. However, in clinical practice, approximately 150 beams and doses of approximately 10 Gy/fr are used, which may affect the applicability of our results. Fifth, the RPLD was used for the evaluation of point dose in this study due to the structure of the in-house phantom, but evaluation with detectors such as ionization chamber dosimeters will also be considered for comparison. Sixth, this study only focuses on whether tracheobronchial tubes can be used as the TTVs, therefore a quality assurance (QA) is not discussed. Although we perform QA on images and equipment on a daily basis, it is more important when applying this method for patients in real life. Hence, we consider the use of QA and the improvement of the phantom to be an issue for future studies. Finally, our dose evaluation was performed using RPLD-generated mean doses. On the structure of the in-house phantom used in this study, instead of the commonly used ionization chambers and films, RPLDs were used, which can be placed within the simulated tumor. However, the evaluation using ionization chambers and films should be performed using a different device than the phantom used in this study.
Conclusion
Our research group developed a new tracking system using tracheobronchial opacity in a TLS for the XLTS, as reported herein. Based on the findings of our research, we believe that tracheobronchial tracking will be useful within the implementation of a TLS in the CyberKnife-based treatment of central lung or mediastinal tumors if the proper constraints can be met. Our findings, which should be verified within larger-scale research efforts, can guide future research directions, medical guidelines, and clinical decision-making.
Footnotes
Declaration of Conflicting Interests
The authors declared no potential conflicts of interest with respect to the research, authorship, and/or publication of this article.
Ethics Statement
This study was approved by the institutional review board (IRB) of Kasugai General Rehabilitation Hospital (receipt number: 2023-2).
Funding
The authors received no financial support for the research, authorship, and/or publication of this article.