
Abstract
Keywords
Introduction
In recent years, rapid improvements have occurred in the techniques of radiation therapy delivery for cancer treatment. 1 The use of advanced techniques such as intensity modulated radiation therapy (IMRT), 2 stereotactic body radiation therapy, 3 and volumetric modulated arc therapy4,5 requires highly precise multileaf collimator (MLC) modeling to guarantee the dose accuracy. Many sophisticated and subtle features of the MLC such as intra/interleaf transmission,6–8 tongue&groove effect,9–11 and rounded leaf tip,12–14 should be taken into account to fully characterize the dosimetric properties of MLC.15,16 Traditionally, MLC fields span from 3 × 3 cm2 up to 40 × 40 cm2, producing relatively simple IMRT plans. In current times, the requirements, for highly precise conformal dose delivery to a target volume while sparing organs at risk, have become much stricter, making the degree of intensity modulation and the complexity of treatment plans rise quickly. Small MLC fields are frequently found in complex treatment plans. 17 This leads to more stringent requirements of MLC modeling and commissioning to accommodate the complex treatment plans composed of many MLC apertures with a diversity of shapes.18,19 Some studies have shown a correlation of plan complexity with the patient quality assurance (QA) passing rate,20–24 implying a potential deficiency in MLC modeling for small and complicated MLC apertures in clinical routines. 24 Nelms et al 25 further showed how patient-specific QA procedures fail to highlight errors in the MLC model, indicating the necessity to characterize MLC correctly and accurately at the time of commissioning. However, the major technical obstacle impeding the clinical improvement of MLC modeling for complex apertures is manifested as the missing of an accurate and practical MLC modeling methodology suitable for routine QA instruments. To make this methodology clinically feasible, affordable, and efficient, the following 2 problems should be resolved correctly: the need to model the MLC for complicated apertures; and the need to use efficient detector arrays with sufficient spatial resolution. For the first problem, the MLC modeling is quite challenging due to the lack of lateral electronic equilibrium, the overlap of the geometrical penumbra, and the change in the energy spectrum.17,18 For the second problem, the dilemma is that high spatial resolution detectors, such as films18,26 are operationally inefficient and impractical for routine use in clinical institutions, while the more convenient diode arrays, such as MapCHECK2 (Sun Nuclear, Melbourne, USA),27–29 are more prevailing, but have the lower spatial resolution. 30
Related works addressing the above 2 problems have been performed by several authors. For the first problem, Lydon 31 investigated the dose for narrow MLC-defined fields between 0.1 and 3 cm in width using Kodak extended dose range film (EDR2), ionization chamber, and metal–oxide–semiconductor field-effect transistor dosimeters and BEAMnrc Monte Carlo (MC) calculations. Sikora et al 32 developed a virtual source model of a mini MLC (the Elekta Beam Modulator) to correctly model the primary photon diameter and spectrum, allowing the efficient generation of particles for the MC algorithm even for small fields. Caprile and Hartmann 33 built a beam model for dose verification of narrow photon beams in water, including 2 main effects affecting dose distributions for small fields: the spatial extension of the radiation source and the lateral nonequilibrium conditions of the energy transfer in the absorber. Cranmer-Sargison et al 34 performed a 6 MV small field characterization of the Agility 160-leaf MLC from Elekta. Hernandez et al,11 found relevant differences between calculations and measurements for beams with dynamic MLCs in the presence of the tongue and groove effect for the Eclipse treatment planning system (TPS), especially for the HD120 MLC with small gap sizes. For the second problem, Snyder et al 35 employed a combination of MapCHECK and ion chambers to measure the dose of the in-house TG-119-based IMRT plans to calibrate the MLC model in Monaco TPS for Agility MLC from Eletcta. Kinsella et al 36 designed a series of radiation test fields to supplement the vendor-supplied set of predesigned fields referred to as the ExpressQA package and used MapCHECK2 to collect data from these test fields for the MLC modeling in Monaco TPS.
None of the publications, however, discussed the question of how to use MapCHECK2 for MLC modeling to characterize the sophisticated features of small fields with widths down to 2 mm and of complex apertures caused by interdigitation. In addition, in the scenario of dose verification of true composite IMRT plans for the Varian accelerator, the performance of the MapCHECK-calibrated MLC models has not been published. The purpose of this study is therefore to develop a data collecting plan package, denoted by ExpressMLC, for the determination of MLC model parameters and investigate the applicability of MapCHECK2 for MLC modeling for complex IMRT plans with a diversity of beam segments, each of which could possibly have numerous small MLC-shaped regions with interdigitation. Thereafter, the performance of the MapCHECK-calibrated MLC models is to be evaluated in both per-beam and true composite beam dose verification.
Materials and Methods
Linear Accelerator and MLC
The measurements were performed on a Trilogy linear accelerator (Varian Medical Systems, Palo Alto, USA) with 6 MV photons and 120-leaves Millennium MLC. The Millennium MLC has 40 central leaves with a 5 mm width and the other remaining leaves with a 10 mm leaf width at the isocenter. Interdigitation is allowed. The maximum field size of 40 cm × 40 cm is defined by the secondary collimator jaws: the upper jaws (Y) travel along an arc of radius 28 cm centered approximately on the target. The lower jaws (X) travel in a linear fashion while pivoting to keep the jaw faces focused on the target. The accelerator is set up for both step-and-shoot and sliding window IMRT.
Dosimetric Detectors
MapCHECK2 (Sun Nuclear, Melbourne, USA)27–29 was used for the MLC modeling. MapCHECK2 is a semiconductor diode detector array consisting of 1527 diode detectors in a square of 32 cm × 26 cm with a center-to-center distance of 1 cm as shown in Figure 1a. The sensitive area of each detector is 0.8 mm × 0.8 mm, small enough to precisely measure the dose in a high gradient region. The linearity and temperature characteristics of the MapCHECK2 were examined in other studies27, and it was found that the diode response was linear within the range of the radiation dose delivered (up to 295 cGy) and a temperature dependence of 0.57%/°C should be taken into account for absolute dosimetric measurement. In this study, the array calibration of MapCHECK2 was performed by a standard protocol specified by the vendor (SNC Patient software V6.0) to guarantee the consistency of diode detectors. The dose calibration was performed using an ionization chamber CC13 (IBA Dosimetry, Schwarzenbruck, Germany) at 5 cm under the surface of IBA solid water SP34 36 with a 10 cm × 10 cm field and 100 cm source-to-surface distance. After calibration, the difference between the measurement from MapCHECK2 and the ionization chamber was within the tolerance of 0.5%, which validated the capability of MapCHECK2 to precisely measure the absolute dose.

(a) The illustration of an arrangement of diode detectors on MapCHECK2; (b) The phantom setup for the MapCHECK2 measurement. SSD represents the source-to-surface distance and SSmD the source-to-detector surface distance.
Gafchromic EBT3 film (Ashland, Bridgewater, NJ, USA)37,38 was normally used for high-resolution dose measurement free of washing, presenting many attractive characteristics compared to other dosimeters: high spatial resolution, weak energy dependence in a wide photon energy range, near tissue-equivalence, small dose rate and fractionation dependence, no angular dependence. The film reading process was composed of 3 steps: 1. lot calibration with film strips; 2. film scanning and reading; and 3. film calibration and gamma evaluation. In steps 1 and 2, Epson 800 (Epson, Long Beach CA, USA) was adopted as the film scanner, and the scanning for film strips and films was performed both prior to and after irradiation, using a resolution of 50 dpi, 48-bit full-color, reflection mode, and multichannel dosimetry (all red–green–blue channels), with all color corrections in the scanner turned off. In step 3, www.radiochromic.com, a Food and Drug Administration-approved online web application was used as a film calibration and analysis tool to analyze measured in-plane dose distribution on the film37, 38 and the functionality of lateral correction for the film was enabled in this software.
Phantom Setup
The measurement setup for MLC modeling and commissioning is shown in Figure 1b.
For the experimental setup of the modeling phantom, slabs of IBA solid water SP34 36 were used as additional build-up and backscatter material. SSD represents the source-to-surface distance and SSmD is the source-to-detector surface distance. The SSD is set at 100 cm. The thickness of MapCHECK2 is 1.1 cm, which amounts to the water equivalent depth of 2 cm. Other setup parameters for the measurement of 8 data-collecting plans for MLC modeling using MapCHECK2 are listed in Table 1. For each data collecting plan, the thickness of the build-up material, which is also referred to as the depth under the solid water surface, was set to 3 different values: 3 cm, 10 cm, and 15 cm, and 3 different measurements were conducted. The thickness of the backscatter material was kept at 8 cm constantly.
Data Collecting Plans for Multileaf Collimator (MLC) Model Optimization.

The phantom setup for per beam dose verification (MLC commissioning) followed the instructions in the AAPM TG 119 and 218 report.39,40 MapCHECK227, was used for the MLC modeling and the measurement of per beam dose with 0° gantry angle. The phantom setup for true composite beam dose verification (MLC commissioning) also followed the instructions in AAPM TG 119 and 218 report,39,40 in which case the source in Figure 1b should be fixed at the angle as specified in the treatment plan. Gafchromic EBT3 films37,38 were used for the measurement of true composite plan dose, replacing the position of the MapCHECK2 in Figure 1b.
Treatment Planning System
The TPSs Zeus Cloud TPS v1.0 (Homology Medical, Ningbo, China) 41 with collapsed cone dose calculation 42 was used in this study. A dual-source model of the treatment head 32 was implemented in Zeus Cloud TPS v1.0 based on the collective expectations of the members of the task group of AAPM TG 53. 43 These expectations are detailed in TABLE 4-4 of TG 53: “Suggested Format for Acceptability Criteria for External Beam Dose Calculations, with Example Criteria.” The commissioning of Zeus Cloud TPS v1.0 was within specifications for all tested field sizes in IAEA TECDOC 1540, 44 which confirmed the accuracy of the linear accelerator treatment head model.
MLC Modeling With ExpressMLC Package
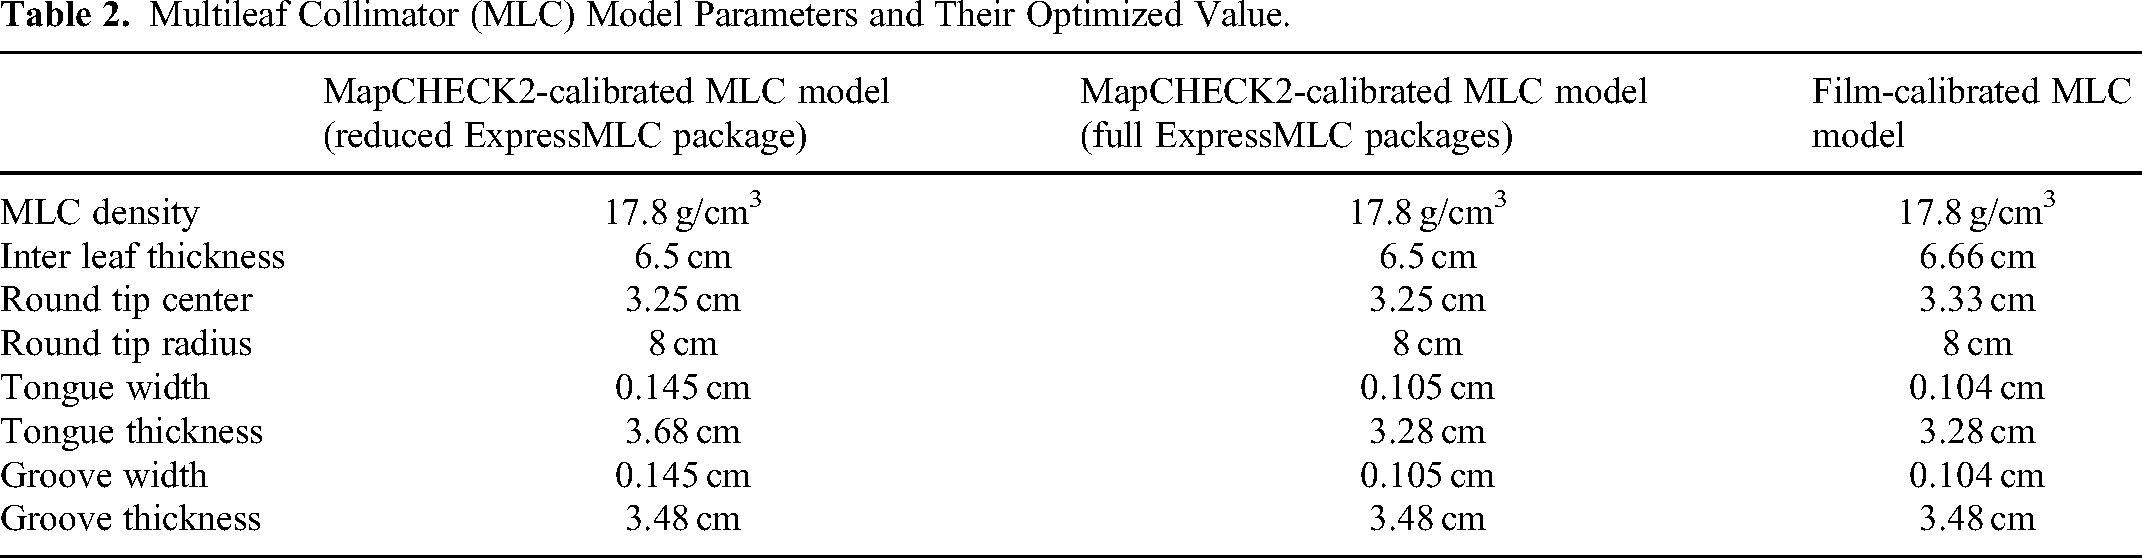
MLC features, including the distance of MLC to the source, intra&inter leaf transmission, tongue&groove effect, rounded leaf tip, and tip position offset, were all taken into account in the current study, following the MLC modeling part of the User's Guide of Zeus Cloud TPS. The adjustable model parameters associated with these MLC features are listed in Table 2. This MLC model deviated from traditional MLC models by using few phenomenological parameters such as the rates of MLC leaf transmission and tip leakage. Instead, the MLC model employed in this study used parameters representing more physical properties such as MLC density and the center/radius of the MLC tip arc, so as to more accurately characterize such phenomena as the change of the energy spectrum due to the hardening of the radiation after transmission through MLCs. In theory, this more realistic MLC model could facilitate the modeling of MLC.
Multileaf Collimator (MLC) Model Parameters and Their Optimized Value.
In what follows, these adjustable model parameters were optimized in accordance with an objective set of 8 step-and-shoot testing IMRT plans (Table 1), referred to as ExpressMLC, with 1 or more MLC fields at 0° beam angle (Figure 2). The first 5 plans were adopted from the study of Fu et al, 45 which consisted of testing plans to evaluate the MLC features of a rounded leaf (T1a and T1b), tongue&groove (T2), intra&inter leaf transmission (T3), and a nominal IMRT plan (T4), wherein the T1b, T2, and T4 are single beam plans with multiple MLC shaped segments. T1b had a jaw opening size of 20 cm × 20 cm and 5 4 cm × 20 cm MLC-shaped abutting segments concatenated together. T2 had 6 10 cm × 3 cm MLC-shaped abutting segments concatenated together vertically (to the movement direction of MLC). T3 was designed to correctly tune the transmission property of the jaw, which was important before the optimization of the MLC model using the plan package. T4 had the jaw opening size of 10 cm × 10 cm with both MLC leaves initially positioned at x = −5 cm. The right MLC leaf was then moved to the right 10 times with a step of 1 cm to create a set of overlapped 10 MLC-shaped segments. Apart from the above 5 plans, additional 3 plans were designed to calibrate the MLC model parameters related to small fields and interdigitation. In T5a and T5b, which were designed for the small MLC fields, rows of MLC with a leaf gap of 2 mm were designed in the diagonal directions of the jaw-opening rectangle. Two consecutive rows of MLC openings were translated by 1 mm. This translation between 2 consecutive rows of MLC opening was specially designed to compensate for the low spatial resolution of MapCHECK2 diode detectors. It allowed the accurate detection of the dose, radiated through the small MLC leaf gap of 2 mm, at least by some rows of the MLC via the sensitive volume of the diode detectors in the array. In T6, consecutive rows of MLC with a leaf gap of 1 cm were elaborately arranged in a repeated pattern to represent interdigitation. The full description of all the ExpressMLC package plans is given in Table 1 and the full description of all the MLC model parameters is listed in Table 2.

The multileaf collimator (MLC) aperture configurations in the plan package ExpressMLC. The length unit in the illustration is cm.
MapCHECK2 and Gafchromic EBT3 films were used as the dosimetric detectors for modeling the MLC Models A, B, and C separately, where Model A is optimized based on the measurements from MapCHECK2 using the reduced ExpressMLC package with the first 5 reference plans, Model B on the measurements from MapCHECK2 using the full ExpressMLC package with all the 8 reference plans and Model C on the measurements from EBT3 films using the full ExpressMLC package.
The cost function used in the MLC parameter optimization was the weighted average sum of the square of the difference between the calculated dose and the measured dose for every measurement point in the dose grid for all the testing plans in the ExpressMLC package. It can be expressed as equation (1):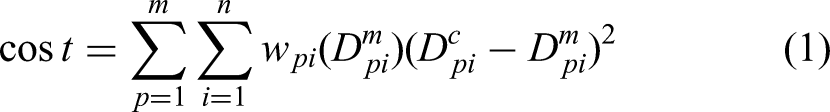


MLC Model Commissioning
Commissioning of the 3 MLC models using 3 distinct dose sets described in the “MLC Modeling With ExpressMLC Package” section, both from MapCHECK2 and EBT3 films, was implemented to compare the model performance for clinical plan dose verification. For MLC commissioning using per beam and composite beam irradiation, 4 plans from AAPM TG119 report, 37 including Test l1: Multi Target, Test l2: Mock prostate, Test l3: Mock head/neck, and Test l4 Cshape, were utilized for dose verification. All the plans were designed and optimized on Zeus Cloud TPS satisfying all the target dose requirements specified in the AAPM TG119 report. The modulation complexity score (MCS) 48 for each test plan was computed to quantify the complexity of the plans. The MCS allows for a quantitative assessment of plan complexity, on a fixed scale, that can be applied to all treatment sites. It ranges from 0 to 1 to represent the higher complexity with lower scores. For the per-beam irradiation, MapCHECK2 was used as the in-plane dosimetric detector, and its measurements as the baseline value. For the true composite irradiation, Gafchromic EBT3 films were used as the planar dosimetric detector and their measurements as the baseline value. All plans were transferred to a computed tomography (CT) scan of the phantom described in the “Phantom Setup” section and doses were calculated in the phantom. To achieve a high resolution in the coronal plane which was used for comparison to the measurement, dose distributions were calculated on a dose grid of 2 mm × 2 mm × 2 mm in TPS.
Treatment Couch
For the plans in AAPM TG 119, many beams at the angle between 120° and 240° normally passed across the couch. To incorporate the effect of a couch in dose calculation is therefore necessary. In this study, the treatment couch was modeled as a geometrical object with different densities in different components. During the treatment planning, the simulation couch in the simulation CT was removed before the treatment couch model was added to the simulation CT for dose calculation.
Evaluation
Gamma evaluations 40 in this study were performed with 3% dose tolerance and 2 mm distance to agreement, a 10% threshold to exclude the low-dose region and the global normalization enabled, as recommended by the most recent AAPM TG 218 report, 49 across the whole pixel matrix to investigate the potential and limitations of the MLC modeling. Measured and calculated planar data were linearly interpolated to 1 mm × 1 mm pixel size, as recommended by Low and Dempsey 50 and the manufacturer, to be able to use a reasonably low distance to agreement which would otherwise be limited by the resolution of the measurement of 7.07 mm of MapCHECK2. One-dimensional (1D) dose profiles and 2-dimensional (2D) dose discrepancy distribution were plotted in addition to the gamma evaluation.
Results
MLC Modeling
Figure 3 shows the 3%/2 mm and 2%/2 mm gamma evaluation results of the plans in the calibration package for Models A, B, and C. These data show an agreement of the calculated dose with the measurements within the 3%/2 mm criterion for at least 81.7%, 92.9%, and 99.0% of the dose grid points of all plans using Model A, Model B, and Model C, respectively, and for 78.4, 92.5, and 90.5, respectively, within the 2%/2 mm criterion.

The (a) 3%/2 mm and (b) 2%/2 mm gamma evaluation results of the plans in the calibration package for Models A, B, and C. One box in the figure represents the distribution of gamma passing rates for the measurements at all the under-solid water depths in phantom configuration
Table 1 shows the optimized parameter value for the MLC model.
The dose profiles in the direction parallel to the moving direction of the MLC in the reference plan T5 are shown in Figure 4a and b. Figure 4a and b shows the profiles for 2 different rows of MLC. It can be obviously discerned that the 2 peaks in Figure 4a and b are different.

The profile of the dose in the direction y perpendicular to the moving direction of the multileaf collimator (MLC) in the reference plan T2. (a) The comparison between the measurement from film and the calculated dose is shown; (b) the comparison between the measurement from MapCHECK and the calculated dose is shown.
The dose profiles in the direction perpendicular to the moving direction of the MLC in the reference plan T2 are shown in Figure 4c. From the comparison among the measurement from films, measurement from MapCHECK2, and calculated dose, it can be seen that there are many peaks and valleys in the dose profile due to the tongue&groove effect and the spatial placement of the MLC apertures vertically in the plan T2. From the perspective of MLC modeling, both the MLC models based on the measurement from films and MapCHECK2 are accurate enough for the calculated dose to agree well with the measurement dose. The dose profiles in the direction parallel to the perpendicular direction of the MLC in the reference plan T6 are shown in Figure 4d.
MLC Commissioning: Per Beam Measurements
The results of the per-beam dose verification of the plan cases from Test l1 to Test l4 using the MLC Models A, B, and C are displayed in Figure 5a and b. The p values from the Mann–Whitney test between gamma passing rates of per beam dose verification using full MapCHECK2 package calibrated MLC model and film calibrated MLC model is .44 under the 3%/2 mm criteria and .47 under the 2%/2 mm criteria.

The 3%/2 mm and 2%/2 mm gamma evaluation results of the per-beam dose verification of the plan cases from Test l1 to Test l4 for (a) 3%/2 mm, step and shoot plans; (b) 3%/2 mm, sliding window plans; (c) 2%/2 mm, step and shoot plans; (d) 2%/2 mm, sliding window plans. One box in the figure represents the distribution of gamma evaluation results for all the beams in a plan
MLC Commissioning: Composite Beam Measurements
Figure 6a and b shows the results of the composite beam dose verification of the plans from Test l1 to Test l4 using the MLC Models A, B, and C. The p values from the Mann–Whitney test between gamma passing rates of composite beam dose verification using MLC Models B and C is .62 under the 3%/2 mm criteria and .36 under the 2%/2 mm criteria. Figures 7 and 8 show the locations of the gamma criterion failure (3%/2 mm) and the comparison of the measurements from Gafchroimic EBT3 films with the calculated dose profiles in x and y directions for the 4 true composite plans based on MLC Models B and C, respectively. Excellent agreements can be seen between the calculated doses and the measurements from EBT3 films.
The 3%/2 mm and 2%2 mm gamma evaluation results of the true composite beam dose verification of the plan cases from Test l1 to Test l4 for (a) 3%/2 mm, step and shoot plans; (b) 3%/2 mm, sliding window plans; (c) 2%/2 mm, step and shoot plans; (d) 2%/2 mm, sliding window plans.

The location of the gamma criterion failure and the comparison of profiles in the x direction (parallel to the multileaf collimator [MLC] moving direction) and y direction (perpendicular to the MLC moving direction) for the composite beam plans between the measured dose from Gafchromic EBT3 films and the calculated dose based on MLC model calibrated by MapCHECK2.

The location of the gamma criterion failure and the comparison of profiles in the x direction (parallel to the multileaf collimator [MLC] moving direction) and y direction (perpendicular to the MLC moving direction) for the composite beam plans between the measured dose from Gafchromic EBT3 films and the calculated dose based on MLC model calibrated by Gafchromic EBT3 films.
Plan Quality and Complexity
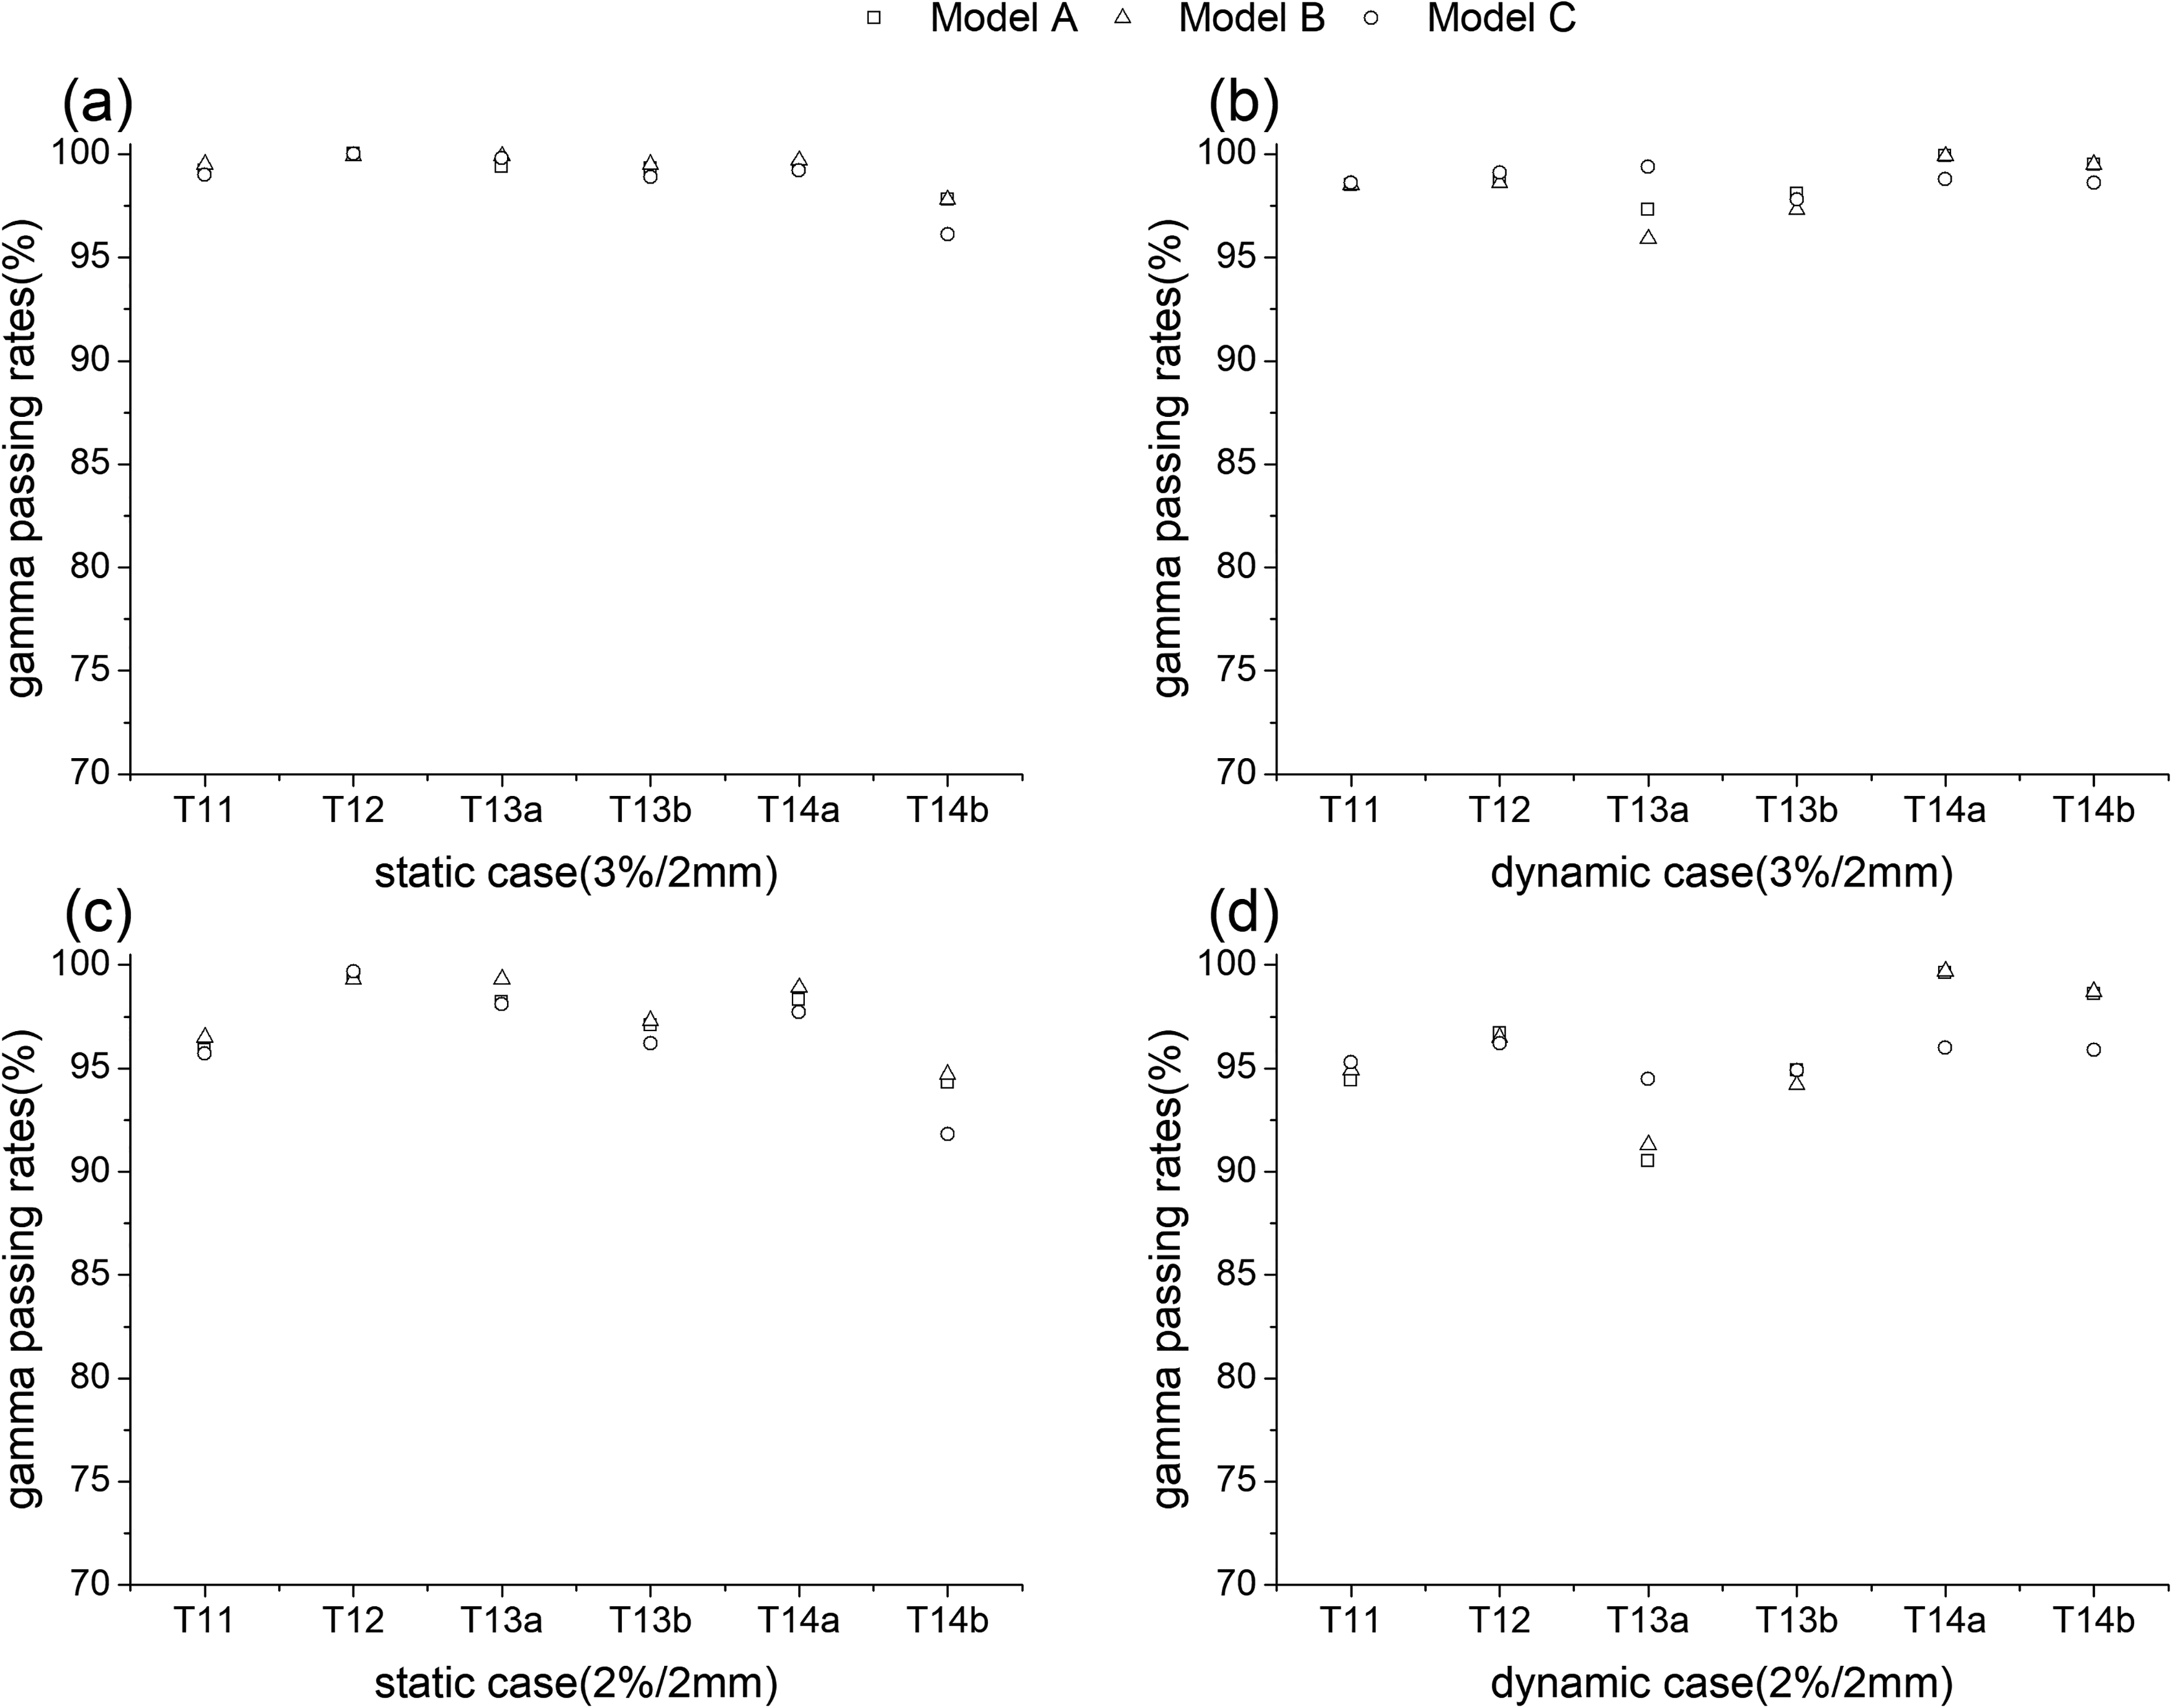
The dosimetric qualities of the commissioning plans, including Test l1 to Test l4, from the AAPM TG 119 report are shown in Tables 3 and 4, meeting all the target dose requirements specified in that report. The MCS for each test plan is also listed in Tables 3 and 4, and the histograms of the MLC leaf gap lengths are shown in Figure 9. From Tables 3 and 4, the plan of Multi Target has the highest score, and the plan of head/neck and C shape has the lowest score. From Figure 9, it can be seen that there are a large number of MLC leaf pairs whose gaps are smaller than 1 cm, especially in the most complex plan of Test l4 in Figure 9d.
The histograms of the multileaf collimator (MLC) leaf gaps of TG 119 evaluation plans.
Complexity and Quality of the Static Plans.

Abbreviations: MCS, modulation complexity score; PTV, planning target volume.
Complexity and Quality of the Dynamic Plans.

Abbreviations: MCS, modulation complexity score; PTV, planning target volume.
Discussion
From Figure 3, the overall fitting accuracies of the data collecting plans using measured dose from MapCHECK2 with full ExpressMLC package (Model B) are better than those from MapCHECK2 with reduced ExpressMLC package (Model A) as expected, but are slightly lower than those using EBT3 films (Model C). This could be explained by the fact that since the spatial resolution of the detector array such as MapCHECK2 is much lower than that of EBT3 films, the amount of information provided by MapCHECK2 for the modeling of MLC is much less than that provided by EBT3 films, making it more challenging to optimize the MLC model using MapCHECK2. However, the fitting accuracies from Model B are all above the universal action limits for perpendicular field-by-field delivery defined by TG 218 49 : the passing rate should be 90%, with 3%/2 mm and a 10% dose threshold, and have no statistically significant difference from those using EBT3 films (Model C). These rudimentary results indicate the feasibility of using MapCHECK2 as the data collector for MLC model optimization. Compared with results from the literature35,36 using the vendor-supplied ExpressQA package, our results from Figure 3 furthermore include the measurements at different depths from iso-surface. The agreeable fitting accuracies at these planes imply good characterization of the hardening effect of the radiation through MLCs, which could not be well characterized by the traditional phenomenological MLC models. It is also demonstrated that the adaptive weighting scheme employed in this study is effective in reducing the small discrepancies in the optimized MLC parameter values from those using EBT3 films. These improvements by the adaptive weighting scheme could be attributed to the optimization principle of putting more emphasis on more accurate information.
Additional analysis of the dose profiles in the individual calibration plan, in both x and y directions, reveals details of rounded tip and tongue&groove effect. From Figure 4, it can be seen that the measured dose from MapCHECK2 could duplicate the peak-and-trough patterns observed from the measurement of EBT3 films, although the peaks and troughs from films are usually higher or lower than those from MapCHECK2. These deviations of MapCHECK2 measurements from those of films could be attributed to a lower resolution of the pixel detectors in MapCHECK2 than in films. The fact that the center-to-center distance between adjacent diode detectors is 1 cm in MapCHECK2 makes it difficult for MapCHECK2 to align its diode detectors exactly at the position of peaks and troughs of the measured dose. To compensate the low resolution of the pixel detectors in MapCHECK2, in the x direction (MLC moving direction), the horizontal position of the peaks of the measured dose in the data collecting plan of T5a and T5b for the evaluation of MLC tip gap and transmission can be set arbitrarily and continuously row by row; in the y direction, T2 and T6 were specially designed to intentionally put at least some of the diode detectors in MapCHECK2 very close to the vertical peaks of the measured dose. From Figure 4a and b, it is noticeable that the peaks in the x direction in some rows are relatively higher than those in other rows. The position of these peaks represents the position of the underlying diode detector. It is also noticeable that the profiles from Figure 4c and d are quite different. In the T2 plan, the measurement was taken at iso-plane. Since the distance of the consecutive diode detector of MapCHECK2 is 1 cm, equal to the distance between consecutive rows of the plan. The design of the location of detectors measures MapCHECK2 reproduce the periodic pattern of peaks and valleys in Figure 4c due to MLC tongue&groove effect. However, in the T6 plan, the measurement was taken at the plane 3 cm underneath the iso-center. Since the SSD is 100 cm and the iso-center is on the surface of the phantom, the distance between consecutive peaks is 1.03 cm, a little larger than the distance of the consecutive diode detector of MapCHECK2 of 1 cm. While the diode detector of the first row is located at the center of the vertical gap of MLC, the location of the diode detector of the following rows will move toward the edge of the MLC gap, manifested as the continuously lowering measurement dose value. At roughly the 9th row, the diode detector of MapCHECK2 will move to the upper edge of MLC, and in the next 5 rows, will further move onto the groove of the MLC by a distance of about 0.15 cm. This fact explains the single peak feature of the profile in Figure 4d and the intention of the T6 plan to collect more information for the more accurate characterization of the MLC tongue&groove effect in MLC modeling.
From Figures 5 and 6, the gamma evaluation of both the per beam and true composite beam dose verification using the MapCHECK2-calibrated and film-calibrated MLC model have similar passing rates under 3%/2 mm and 2%/2 mm criteria without statistically significant difference, which further validates the effectiveness of using MapCHECK2 as the dose measurement instrument for the MLC model optimization. In addition, the good fitting accuracy for data collecting plans in MLC model optimization does not lead to inferior passing rates results in the commissioning of the clinical-oriented TG 119 plans as occasionally observed in Snyder et al. 35 This improvement is potentially due to the synergetic effect of the more realistic MLC model, comprehensive coverage of complex MLC apertures in the data collecting plan package ExpressMLC, the distinct optimization objective each data collecting plan possesses and the new data collecting plans specially designed for MapCHECK2. These special features of the overall MLC modeling methodology seem to effectively lower the degree of degeneracy of the optimized solutions for the MLC model. The acceptable agreement between the 1D dose profiles in Figures 7 and 8 further accentuates the feasibility of using MapCHECK2 as the dose measurement instrument for the MLC model optimization.
It is noteworthy to point out that, in order to emphasize the critical value of the 3 newly added data-collecting plans, we included the results of the data-collecting plans using the MLC model fitted from MapCHECK2 measurement with only 5 plans in the ExpressMLC package (Model A), excluding our newly added 3 plans (Table 1). As anticipated, the agreement results between measurements and calculation dose are much inferior to those using the full ExprssMLC package (Figure 3). The per-beam dose verification also confirmed the value of the 3 newly added data-collecting plans (Figure 5). These observations imply that the newly added plans break the degeneracy of the optimized MLC model using less data and lead it to a more globally optimized one. Without them, the parameters for MLC tip and groove&tongue would have not been modeled accurately. However, this difference in composite beam dose verification is not so obvious (Figure 6). It can be explained by the fact that the error in all the beam doses from different directions might have been canceled out mutually to some degree.
For radiotherapy delivery modes, both static (step-and-shoot) and dynamic (sliding window) MLC modes were employed in the dose verification for the commission of MLC. No statistically significant difference is discernible from the gamma evaluation results. Because of the usually much higher monitor units (MUs) in dynamic MLC mode for complex IMRT plans, the proportion of MU spent in the shielding from MLC is also much more in dynamic MLC mode than in static mode, making the impact of accurate MLC model more significant in dynamic mode. The commissioning results from dynamic MLC further confirm the effectiveness and versatility of the overall MLC modeling methodology presented in this study.
Tables 3 and 4 show that all of the plans for the MLC commission satisfy the target dose requirements and organ-at-risk constraints. In order to have treatment plan quality as high as possible, with the availability of modern linear accelerators without MLC constraints such as interdigitation and with MLC position precision down to 0.1 mm, the complexity of MLC apertures in IMRT has increased significantly. From the histogram distribution of the MLC gap width in Figure 9, it could be seen that there is quite a large portion of MLC gaps falling around 2 mm, especially for the test case l3 (head/neck) and l4 (C shape), which is consistent with the MCS of plans21, 48 in Tables 3 and 4. To meet the requirements from the increased complexity of the IMRT plans, the accuracy of dose calculation leverages heavily on the accuracy of MLC modeling. Two contributions were made in this study to facilitate the accurate modeling of MLC using MapCHECK2. One is a more realistic MLC model to directly and realistically characterize the MLC features in the physical sense. Another is a package of data collecting plans for calibration, ExpressMLC, which was elaborately designed to facilitate the determination of the MLC model parameters corresponding to a variety of specific features of modern MLC. For the first 5 plans, which were borrowed from Fu et al, 45 cover the MLC features of rounded leaf, tongue&groove and intra&inter leaf transmission, and a nominal IMRT plan. The additional 3 plans, which were introduced for the first time in this paper, were specially designed to model the small MLC apertures and the feature of interdigitation more accurately. Compared with a more comprehensive set of MLC fields designed in Gotstedt et al, 51 the ExpressMLC package used in this study is, however, much more compact, making the measurement needed for data collection more efficient. Compared with the vendor (Elekta) supplied ExpressQA package,35,36 our package of ExpressMLC encompasses more complex MLC-shaped apertures to reduce the potential risk of overfitting in MLC model parameters. One add-on contribution to note is that this study is tested for accelerators from Varian. To our knowledge, no other plan package for MLC modeling using MapCHECK2 has been designed and tested for Varian accelerators.
It is also interesting to note that the availability of the efficient and accurate MLC modeling methodology reported in this paper also led to a novel way to remodel the MLC once the MLC cannot pass the monthly QA procedure as set up by the standards from AAPM TG 119 or 218. In current practice, since the remodeling of MLC could only be performed using EBT films, which is a very complicated way to collect dose data and is unfamiliar to most physicists in developing countries, the recalibration of MLC is frequently just ignored. The usage of MapCHECK2 in MLC modeling greatly simplified the MLC recalibration procedure and made it possible to implement routine MLC quality control/QA protocols using this new commissioning and calibration technique in clinical practice. Thus, it is reasonable to expect the precision and quality of radiation treatment to be elevated.
It should be mentioned that the modeling of the MLC was only performed on the Zeus Cloud TPS because of the fully configurable parameters of the MLC model in this TPS. In the more commercially available TPS such as Eclipse, Monaco and RayStation, etc, the configuration of the MLC model is usually conducted by the personnel from vendors. In the future, the validation of the feasibility of the package of ExpressMLC for these commercial TPSs may be performed with the help of vendors. In this study, only EBT3 films have been used as the Golden Standard for dosimetric detectors because of their high resolution. Apart from films, portal dosimetry utilizing an electronic portal imaging device (EPID) for pretreatment dose verification has also been reported in many works.52,53 The dose verification of the testing plans using the optimized MLC model with EPID would potentially be implemented to further demonstrate it as an alternative dosimeter.
Conclusion
It is confirmed that the 2D diode array MapCHECK2 can be used for data collection for MLC modeling with the combination of the ExpressMLC package of plans, whose doses are sufficient for the determination of MLC parameters. It could be a fitting alternative to films to boost the efficiency of MLC modeling and commissioning without sacrificing accuracy.
Footnotes
Abbreviations
Declaration of Conflicting Interests
The authors declared no potential conflicts of interest with respect to the research, authorship, and/or publication of this article.
Ethics Statement
Not applicable.
Funding
The authors disclosed receipt of the following financial support for the research, authorship, and/or publication of this article: This work was supported by the Jiangsu Provincial Medical Key Discipline, National Key Research and Development Program of China, National Natural Science Foundation of China, Clinical Key Disease Diagnosis and Treatment Technology Project of Suzhou City, Science and Technology Project of Nantong City (grant numbers ZDXK202235, 2022YFC2402303, 11875320, LCZX202351 and MSZ2022087).