
Abstract
Introduction
Obstructive sleep apnea (OSA) represents an important disease featuring sporadic upper airway obstruction resulting in systemic intermittent hypoxia (IH). OSA can cause many diseases, including cardiovascular, 1 cerebrovascular, 2 and metabolic diseases. 3 Mounting epidemiological evidence suggests OSA cases show elevated cancer incidence and mortality.4–7 It was reported that severe OSA increases mortality in individuals with stage III and IV lung cancer. 8 Specifically, recent studies have revealed a close relationship between cancer-related death and the severity of nocturnal hypoxia. 9 A direct correlation of hypoxia severity with cancer incidence was also reported. 4 The possible association of cancer with OSA is worth studying since hypoxia overtly affects cancer progression.
Mouse models have demonstrated IH plays critical roles in tumor growth and metastasis,10,11 although the underpinning mechanisms remain undefined. A study of lung cancer-bearing mice showed that an increase in the M2/M1 ratio for tumor-associated macrophages (TAMs) may contribute to lung cancer aggressiveness under intermittent hypoxia. 12 Macrophages mostly derive from the bone marrow (monocytic precursors) and participate in phagocytosis, inflammatory events, and tissue repair in both nondisease and disease states. 13 TAMs interact with cancer cells to abundantly express cytokines, growth factors, and proteases, which alter the tumor microenvironment (TME). 14 Among immune cells in the TME, TAMs are the most commonly found, and their differentiation uses tumor-derived signals. 15 TAMs can polarize into the M1 and M2 types. 15 M1 macrophages produce proinflammatory cytokines (eg, IL-1β, tumor necrosis factor-α [TNF-α]), highly express MHC class II molecules (eg, HLA-DR, CD80, or CD86), and inhibit tumor cells by stimulating T-cell-mediated antitumor immunity. 16 M2 macrophages are characterized by the expression of CD163, CD206, or arginase-1 (Arg-1) expression, and are thought to contribute to tumor progression. 17
Recent studies have reported that tumor-secreted EVs, especially EVs induced by hypoxia, upregulate CD163 on macrophages, promoting macrophage polarization into the M2 type.18,19 According to size and biogenetic pathways, extracellular vesicles (EVs) are primarily classified into exosomes (30-100 nm in diameter), which are derived from multivesicular bodies or from the cell membrane, microvesicles (100-1000 nm in diameter) and apoptotic bodies (>1 μm in diameter, produced by dying cells).20,21 EVs mediate intercellular communications usually via microRNAs (miRNAs), proteins, RNAs, DNAs, and/or lipids,22,23 particularly regulating cell-to-cell communication between cancer and immune cells. 24 Although the specific mechanisms by which IH-induced lung cancer cells affect immune cells and deregulate immune responses remain undefined, we preliminarily demonstrated IH enhances the activity of lung cancer cell-derived EVs to exacerbate the immunosuppressive status of macrophages. 25
Therefore, this study aimed to assess whether extracellular vesicles obtained from lung adenocarcinoma cells grown under IH promote M2 macrophage polarization, and how these EVs regulate macrophage polarization. To address these questions, immunohistochemical staining was performed on lung cancer tissue specimens from lung adenocarcinoma cases with or without OSA to detect M1 and M2 macrophages and to examine the correlation between macrophage polarization and OSA. In addition, high-throughput sequencing and multiple in vitro analyses were carried out to examine the effects and related mechanisms of EVs obtained from lung cancer cells grown under IH on macrophage polarization, which may help unveil the mechanism by which OSA promotes lung cancer development.
Materials and Methods
Patients
Between January 1, 2017, and January 1, 2019, 22 patients (aged 53-78 years) who were diagnosed with lung adenocarcinoma (LC) by histology and underwent surgery in the Department of Geriatric Respiratory Medicine of Guangdong Provincial People's Hospital, Guangzhou, were enrolled. Each participant was submitted to overnight sleep testing (The Alice Night One, Philips Respironics, Inc., Murrysville, PA, USA) before surgery. According to the OSA diagnostic testing, they were assigned to the LC (n = 12) and OSA + LC (n = 10) groups. Oronasal flow and pressure, heart rate, thoracic and abdominal respiratory movements, and arterial oxygen saturation (SpO2) were determined. The oxygen desaturation index (ODI) was determined as the hourly number of falls of oxygen saturation ≥ 4%. OSA was reflected by apnea–hypopnea index (AHI) ≥ 5 events/h. 26 Pathological staging was determined using current guidelines. 27 Patients were excluded who used oral appliances or oxygen supplements; underwent antitumor treatment; had chronic airway disorders, respiratory failure, allergy, or any infection in the past 3 months; had serious mental diseases, lung resection, stroke, autoimmune disorders or dyslipidemia; or were diagnosed with other malignancies besides LC.
Immunohistochemistry
Formalin-fixed, paraffin-embedded sections (4-μm thick) were examined immunohistochemically to evaluate the distributions of M1 and M2 TAMs by CD80 and CD206 staining, respectively, using the Servicebio system (Servicebio, Wuhan, China) as proposed by the manufacturer. Upon deparaffinization, rehydration, and antigen retrieval with citric acid (pH 6.0), incubation was carried out with rabbit monoclonal anti-human CD80 antibody (ab134120, Abcam, 1:1000), respectively, at 4 °C for 24 h. Then, horseradish peroxidase-linked goat anti-rabbit IgG was added at ambient for 50 min to interact with the primary antibody, and the 3,3'-diaminobenzidine color-developing reagent was used to visualize the complex. The sections were counterstained with Mayer's hematoxylin and Scott's tap water bluing reagent before analysis.
The interpretation of immunohistochemistry results was performed by 2 investigators blinded to the patient’s clinical information and outcomes. Five random high-power fields (magnification, 400 ×) of the tumor stroma (area with tumor stromal cells accounting for > 70% of all cells) and tumor islets (areas with tumor cells accounting for > 70% of all cells) in each tissue section were analyzed. CD80+ (M1 TAMs) or CD206+ (M2 TAMs) cells in various areas were counted manually.
Cell Culture and the IH Model
Human lung adenocarcinoma A549 and human monocyte Tohoku Hospital Pediatrics-1 (THP-1) cells (Cell Bank of the Chinese Academy of Sciences, Shanghai, China) underwent culture in RPMI 1640 (Gibco, USA) with 10% fetal bovine serum (FBS), penicillin (100 U/mL) and streptomycin (100 mg/mL). THP-1 cells were differentiated into macrophages (mTHP-1) employing 100 ng/mL phorbol 12-myristate 13-acetate (PMA, Sigma, P8139) at 37 °C in an environment containing 5% CO2 for 48 h. At 70% to 80% confluence, A549 cells were trypsinized and after 3 to 5 passages employed for EV purification and IH modeling. A549 cells were assigned to the normoxia (NA) and IH groups. IH was obtained by 48 cycles of 5-min 1% O2 hypoxia followed and 5-min normoxia employing Modular Incubator Chambers (Billups Rothenberg Inc., San Diego, CA) with an O2 Quickstick Oxygen Analyzer (Nuvair, CA93033, USA). The condition of intermittent hypoxia has been used in our previously published work and confirmed by the HIF-1α expression in the treated cells. 25
EV Isolation and Quantification
Before EV isolation, A549 cells were grown in 100 mm dishes with RPMI 1640 medium containing 10% exosome-free FBS (FBS, System Biosciences, USA) for 48 h. From the 12th hour, 12 dishes each were grown under IH and normoxia. The isolation procedure for EVs was reported previously. 25 The final EV pellet was resuspended in 400 µL phosphate-buffered saline (PBS).
Exosome biomarkers, for example, CD9, CD63, and tumor susceptibility gene 101 (TSG101) were assessed by immunoblot. The typical morphology of the obtained EVs was assessed by TEM (Hitachi H-7650, Hitachi, Japan). Purified EVs were diluted 10 to 100 times with PBS and underwent NTA using the NanoSight NS300 (Malvern Instruments, Ltd, Malvern, UK) to measure the particle size and concentration as previously described. 25
EV Treatment
mTHP-1 cells seeded into 6-well plates at 2 × 10⁵/plate in 2 mL medium were treated with 10 μg/mL EVs for 48 h. Control cells were administered PBS. Upon treatment, cells were collected for subsequent assays.
Cell Transfection
miR-20a-5p mimics (100 nM), miR-20a-5p inhibitor (100 nM), and the respective scrambled controls (100 nM) were synthesized by Guangzhou Ribo Co., Ltd (Guangzhou China) and transfected into macrophages with RNAiMAX (Invitrogen, USA) as directed by the manufacturer.
Immunoblot
Total protein extraction employed the RIPA lysis buffer (Thermo Fisher Scientific, USA) with protease inhibitors (BOSTER Biological, China). The BCA™ Protein Assay Kit (Pierce, USA) was utilized for protein quantitation. Total cell lysates or EVs (30 µg) were resolved by 10% SDS-PAGE and electro-transferred onto a polyvinylidene difluoride membrane (Millipore, Danvers, MA, USA). Each membrane was incubated with primary antibodies targeting CD9 (ab92726, Abcam, 1:1000), CD63 (ab134045, Abcam, 1:1000), TSG101 (ab125011, Abcam, 1:1000), PTEN (ab170941, Abcam, 1:1000), Akt (#4691, Cell Signaling Technology, 1:2000), p-Akt (#4060, Cell Signaling Technology, 1:2000), CD206 (ab64693, Abcam, 1:800), Arg-1 (#93668, Cell Signaling Technology, 1:1000), GAPDH (#5174, Cell Signaling Technology, 1:2000) or HIF-1α (ab51608, Abcam, 1:1000). This was followed by incubation with horseradish peroxidase-linked secondary antibodies. The enhanced chemiluminescence reagent (Millipore, Danvers, MA, USA) was utilized for visualization, and the Image Quant™ LAS-500 Mini Imager (Fuji, Japan) was utilized for imaging. Quantitation used the ImageJ software.
EV Labeling and Tracking
Before EVs isolation, FAM-miR-20a-5p mimics (Guangzhou Ribobio Co., Ltd) were transfected into A549 cells as described above. Then, A549 cells were washed 3 times with PBS, followed by a 48-h culture in RPMI-1640 medium containing 10% exosome-free FBS shielded from light and medium collection. Isolated EVs were labeled using the PKH26 red fluorescent labeling kit (Sigma-Aldrich, USA) as directed by the manufacturer. Next, a fluorescence microscope (Nikon TI-S) and a laser scanning confocal microscope (Leica SP5-FCS, Germany) were utilized for the acquisition of images, which were quantitated with ImageJ.
Flow Cytometry
mTHP-1 cells exposed to EVs in a 6-well plate underwent trypsinization and staining BV421 conjugated antihuman CD206 antibodies and BB515 conjugated antihuman CD80 (BD Biosciences, USA), respectively. After permeabilization with the Intracellular Fixation kit (Thermo Fisher Scientific, USA), staining was carried out with Alexa 674-linked anti-human CD68 antibodies (BD Biosciences, USA) following a standard protocol for flow cytometry. Mouse IgG1-BV421 antibodies and mouse IgG1-BB515 antibodies were concurrently examined as isotype controls. Then, 2 PBS washes were performed before analysis. To determine the uptake rate of EVs, mTHP-1 cells exposed to PKH26-labeled EVs were trypsinized as described above and resuspended in PBS. A FACS Verse was utilized for analysis, and quantitative used FlowJo.
High-Throughput Sequencing of EV miRNAs
High-throughput sequencing of miRNAs for the EV-NA and EV-IH groups was carried out by Ribo (Guangzhou, China). Three samples were processed for each group. Total RNA or purified sRNA fragment was obtained, and 3ʹ and 5′ connectors were utilized to generate cDNA, followed by polymerase chain reaction (PCR) amplification. Next, target fragment library recovery was performed by glue cutting, followed by sequencing of the qualified library. Clean reads obtained by sequencing were compared with all mature miRNA sequences in miRDeep2 and miRBase. v22 database to obtain the structures, lengths, and other information of miRNAs and calculate their expression level. High-throughput sequencing of microRNA libraries was conducted on an Illumina HiSeqTM 2500 sequencer.
RNA Isolation, Reverse Transcription, and Real-Time PCR
Total RNA isolation from macrophages utilized TRIzol Reagent (Invitrogen, USA), and reverse transcription employed a reverse transcription kit (TaKaRa Bio, Japan) as directed by the manufacturer. miRNAs from EVs obtained with a SeraMirTM Exosome RNA Amplification kit (System Biosciences, USA) and reverse-transcribed with the Mir-X miRNA First-Strand Synthesis Kit (TaKaRa Bio, Japan) as proposed by the manufacturer, using cel-miR-39 for normalization. RNA purity and levels were examined on a UV spectrophotometer (Thermo Scientific, USA). The real-time PCR procedure was carried out on a BIO-RAD fluorescence quantitative PCR instrument. A 10-μL reaction system was prepared according to the manufacturer's instructions, and 3 auxiliary wells were set for each sample. The settings for the one-step method were as follows: 95 °C for 30 s; 95 °C for 5 s; 60 °C for 30 s, for 40 cycles in total, and a melting curve was generated. GADPH was used as a reference gene for mRNA RT-qPCR. The expression of miRNAs was normalized to U6 expression. The 2ΔΔCt method was employed for data analysis. Forward primers for U6, cel-miR-39-3p, hsa-miR-20a-5p, hsa-miR-20a-3p, hsa-miR-203a-3p, hsa-miR-212-5p, hsa-miR-365b-5p, hsa-miR-935, and hsa-miR-4436b-3p were synthesized by Ribo. For miRNA RT-qPCR, the common mRQ 3′ reverse primer was included in the Mir-X miRNA First-Strand Synthesis Kit (TaKaRa Bio, Japan). Supplemental Table S1 lists other primer pairs.
Luciferase Assay: 3’UTR Reporter Assays
H-PTEN-WT (wild type) and H-PTEN-MUT (mutant type) plasmids were synthesized by Ribo. To examine the direct interaction of miR-20a-5p with PTEN's 3ʹ UTR, HEK-293 cells underwent co-transfected with miRNA mimics or control with RNAiMAX (Invitrogen, USA) and the dual-luciferase reporter vector (pmiR-RB-ReportTM-PTEN-WT or pmiR-RB-ReportTM-PTEN-MUT) using Lipofectamine 2000 (Invitrogen, USA) for 48 h. The Dual-Glo luciferase assay system (Promega, USA) was employed to measure luciferase activity, which was normalized to firefly luciferase activity.
Statistical Analysis
Parameters with normal distribution were presented as mean ± standard deviation (SD); those with skewed distribution were presented as median (inter-quartile range [IQR]). Categorical variates were compared by Fisher's exact test. Clinical features were compared by the Mann-Whitney U-test. Figure 1B and C data were assessed by the Student's t-test following logarithm transformation. The correlations of Figure 1D and E parameters were evaluated by Spearman's rank correlation analysis because of skewed distribution. The simultaneous duplication of the same generation of cells was defined as technical duplication, while the duplication of different generations of cells cultured at different times was defined as biological duplication. For each experiment, we have 3 technical and biological replicates. All the experimental results were used for statistical purposes. The mean values of 2 groups were compared using Student's t-test. Multiple comparisons between groups were performed using One-way ANOVA. Differences between the mean values were analyzed using LSD-t tests (equality of variance) and a Dunnett's T3 test (heterogeneity of variance). A significance level of P < .05 was considered to indicate statistical significance. The statistical analyses were conducted using SPSS software (Version 22.0, Chicago, Illinois), and all statistics were reported as 2-sided.

Stromal M2 TAMs are highly abundant in LC + OSA patients. (A) Representative images of CD80+ TAMs and CD206+ TAMs in the islet and stroma of lung adenocarcinoma tissue detected by immunohistochemistry (scale bar = 20 μm). (B) The number of islet and stromal M1 TAMs were similar in the LC + OSA (n = 10) and LC groups (n = 12). (C) The number of stromal M2 TAMs elevated in the LC + OSA group compared with the LC group. The number of islet M2 TAMs were similar in both groups. (D) The number of stromal M2 TAMs was positively correlated with AHI. (E) No significant correlation was obtained between stromal M2 TAMs and ODI.
Results
Stromal M2 TAMs are Highly Abundant in LC + OSA Patients
The LC + OSA and LC groups were comparable in age, gender distribution, body mass index, smoking status, pathological stage, histology, and medical history (Table 1). The AHI, ODI, and Sp90 were elevated in the LC + OSA group compared with the LC group, while LstSp was lower (Table 1). The number of stromal M2 TAMs markedly elevated in the LC + OSA group versus the LC group (Figure 1C), while the numbers of islet M2 TAMs (Figure 1C), islet and stromal M1 TAMs (Figure 1B) were similar in both groups. Interestingly, the amount of stromal M2 TAMs was positively correlated with AHI (Figure 1D).
Clinic Characteristics of the Study Participants.

Abbreviations: OSA, obstructive sleep apnea; LC, lung adenocarcinoma; AHI, apnea–hypopnea index; ODI, oxygen desaturation index; Sp90, SpO2 < 90% of total recording time; LstSp, lowest SpO2.
t-test.
Fisher's exact test.
Mann-Whitney U-test.
EV-IH Treatment Increases M2 Polarization and Upregulates M2-Type Cytokines
EVs derived from A549 cells had a typical morphology as assessed by electron microscopy (Figure 2A). Immunoblot detected the typical exosomal makers CD9, CD63, and TSG101 (Figure 2B). The particle size distribution and particle content of EVs were detected using NTA, and the average diameters of EV-NA and EV-IH were 121.9 ± 1.8 and 122.5 ± 1.1 nm, respectively (Figure 2D). EVs had markedly increased amounts in the EV-IH group versus the EV-NA group (6.31 × 10¹⁰ ± 8.09 × 10⁹ particles/mL vs 1.82 × 10¹⁰ ± 5.24 × 10⁹ particles/mL, P < .05). To assess EV uptake by macrophages, PKH26 (Red)-labeled EVs were incubated with mTHP-1 cells (Figure 2E) for 12 h. Red fluorescence overtly surrounded the DAPI-labeled nuclei of macrophages, suggesting EVs were taken up by macrophages (Figure 2C). After incubation with PKH26-labeled EVs for 48 h, cells were collected to detect the EVs+ ratio by flow cytometry (Figure 2F). The EV-NA and EV-IH groups had similar uptake rates (99.37 ± 0.35% vs 98.90 ± 1.31%, Figure 2I).

EV-IH treatment induces the M2 phenotype of macrophages. (A) TEM images of EVs derived from the supernatant samples of A549 cells (scale bar = 100 nm). (B) Immunoblot analysis of CD9, CD63, and TSG101 in EVs and parental cells. (C) Uptake of EVs by THP-1-derived macrophages. EVs were labeled with PKH26 (red), and counterstaining used DAPI (blue) (scale bar = 100 μm). (D) Freshly isolated EVs were diluted at 1:100 for nanoparticle tracking analysis by the Nanosight technology (n = 3). The majority of EVs had a size of 105 nm. (E) Human monocytes THP-1 were induced to differentiate into macrophage mTHP-1 macrophages by PMA. (F and I) EVs labeled with PKH26 were cocultured with macrophages for 48 h and were collected to detect the EVs+ ratio by flow cytometry. There was no significant difference between the 2 groups in uptake rate (n = 3, P > .05). (G, H, J, K) Percentages of CD68+CD206+ and CD68+CD80+ macrophages cocultured with PBS, EV-NA, and EV-IH, respectively. EV-NA and EV-IH represent the EVs isolated from A549 cells exposed to normoxia and IH, respectively. * P < .05, ** P < .01, ns: not significant. (L) IL-10, TGF-β, IL-1β, and TNF-α mRNA amounts in macrophages respectively cocultured with PBS, EV-NA, and EV-IH as detected by RT-qPCR (n = 3). ΔΔ: compared with the EV-NA group, P < .01; *: compared with the Blank group, P < .05; **: compared with the blank group, P < .01. Data are mean ± SD. Group-pair and multiple-group comparisons used the Student's t-test and the one-way ANOVA, respectively.
The immune phenotypes and cytokine profiles of macrophages cocultured with PBS, EV-NA, and EV-IH, respectively, were detected. EVs produced by normoxic A549 cells elevated the amount of M2 phenotype macrophages (CD68+ CD206+, Figure 2G and H). EVs derived from A549 cells exposed to IH further increased the amount of M2 macrophages (Figure 2G and H). The percentages of M1 macrophages were comparable in 3 groups (Figure 2J and K). EVs derived from A549 cells exposed to normoxia or IH had starkly more M2-type (IL-10, transforming growth factor-beta1 [TGF-β1]) cytokines than untreated macrophages (Figure 2L). Corroborating the above changes in cell surface biomarkers, macrophages exposed to EV-IH had markedly higher levels of M2-type cytokines (TGF-β1) compared with untreated or EV-NA-treated macrophages (Figure 2L). However, M1-type cytokines (IL-1β and TNF-α) have no marked differences between the EV-NA and EV-IH groups (Figure 2L).
EV-IH Treatment Promotes M2 Macrophage Polarization Through miR-20a-5p
To determine how EV-IH mediates M2 macrophage polarization, we profiled the miRNAs in EVs from the IH group (n = 3) and NA group (n = 3) by high-throughput sequencing (miRNA-seq). Totally 32 known mature miRNA showed differential expression between the 2 groups (| log2(FoldChange) > 1 | and P value < .05). Compared with the EV-NA group, 6 miRNAs were up-regulated (hsa-miR-20a-3p, hsa-miR-203a-3p, hsa-miR-212-5p, hsa-miR-365b-5p, hsa-miR-935, and hsa-miR-4436b-3p), while 26 miRNAs were down-regulated in the EV-IH group. Due to the limited number of up-regulated miRNAs screened, the screening conditions were expanded to | log2(FoldChange) > 1 | and P value < .1. At this time, 4 upregulated candidate miRNAs were further retrieved, including hsa-miR-20a-5p, hsa-miR-100-5p, hsa-miR-320a-3p, and hsa-miR-let (Figure 3A).

EV-IH highly expresses miR-20a-5p. (A) Cluster analysis based on 36 differentially expressed miRNAs between EV-NA (n = 3) and EV-IH (n = 3) was carried out by miRNA-seq. *: P < 0.05, **: P < 0.01. (B) RT-qPCR validated the increased amounts of miR-20a-5p, miR-let-7a-5p, and miR-4436b-3p, etc, in EV-IH compared with EV-NA (n = 3). * P < .05, ** P < .01. Data are mean ± SD (Student's t-test). (C) miR-20a-5p target genes were predicted with miRTarBase, TargetScan, miRWalk, and mirDIP. (D) Normalized luciferase activity 48 h after co-transfection of control or miR-20a-5p mimics jointly with pmiR-RB-ReportTM-PTEN-MUT or pmiR-RB-ReportTM-PTEN-WT (n = 3). (E) Predicted interaction between miR-20a-5p and its putative binding sites in the PTEN's 3ʹUTR.
For miRNA-seq data validation, 10 miRNAs in EVs were assessed by RT-qPCR. We found that miR-20a-5p, miR-let-7a-5p, and miR-4436b-3p were upregulated in EV-IH compared with EV-NA (Figure 3B). The CT values of miR-203a-3p and miR-365b-5p exceeded 35, indicating low expression levels, which were regarded as background. According to the obtained results, miR-20a-5p had the highest expression in EV-IH and was selected as candidate miRNA for further assays.
After IH stimulation of A549 cells, miR-20a-5p was packaged into EVs and then transferred to macrophages. To identify the miR-20a-5p delivery methods, A549 cells were transfected with FAM-labeled miR-20a-5p mimics (green fluorescence). The EVs derived from these A549 cells were added to mTHP-1 for tracing the intercellular transport of miR-20a-5p (Figure 4A and B). In mTHP-1 cells, green and red fluorescent signals overlapped to form yellow signals, showing the co-localization of miR-20a-5p and EVs. The findings indicated miR-20a-5p could be delivered by EVs (Figure 4A and B).
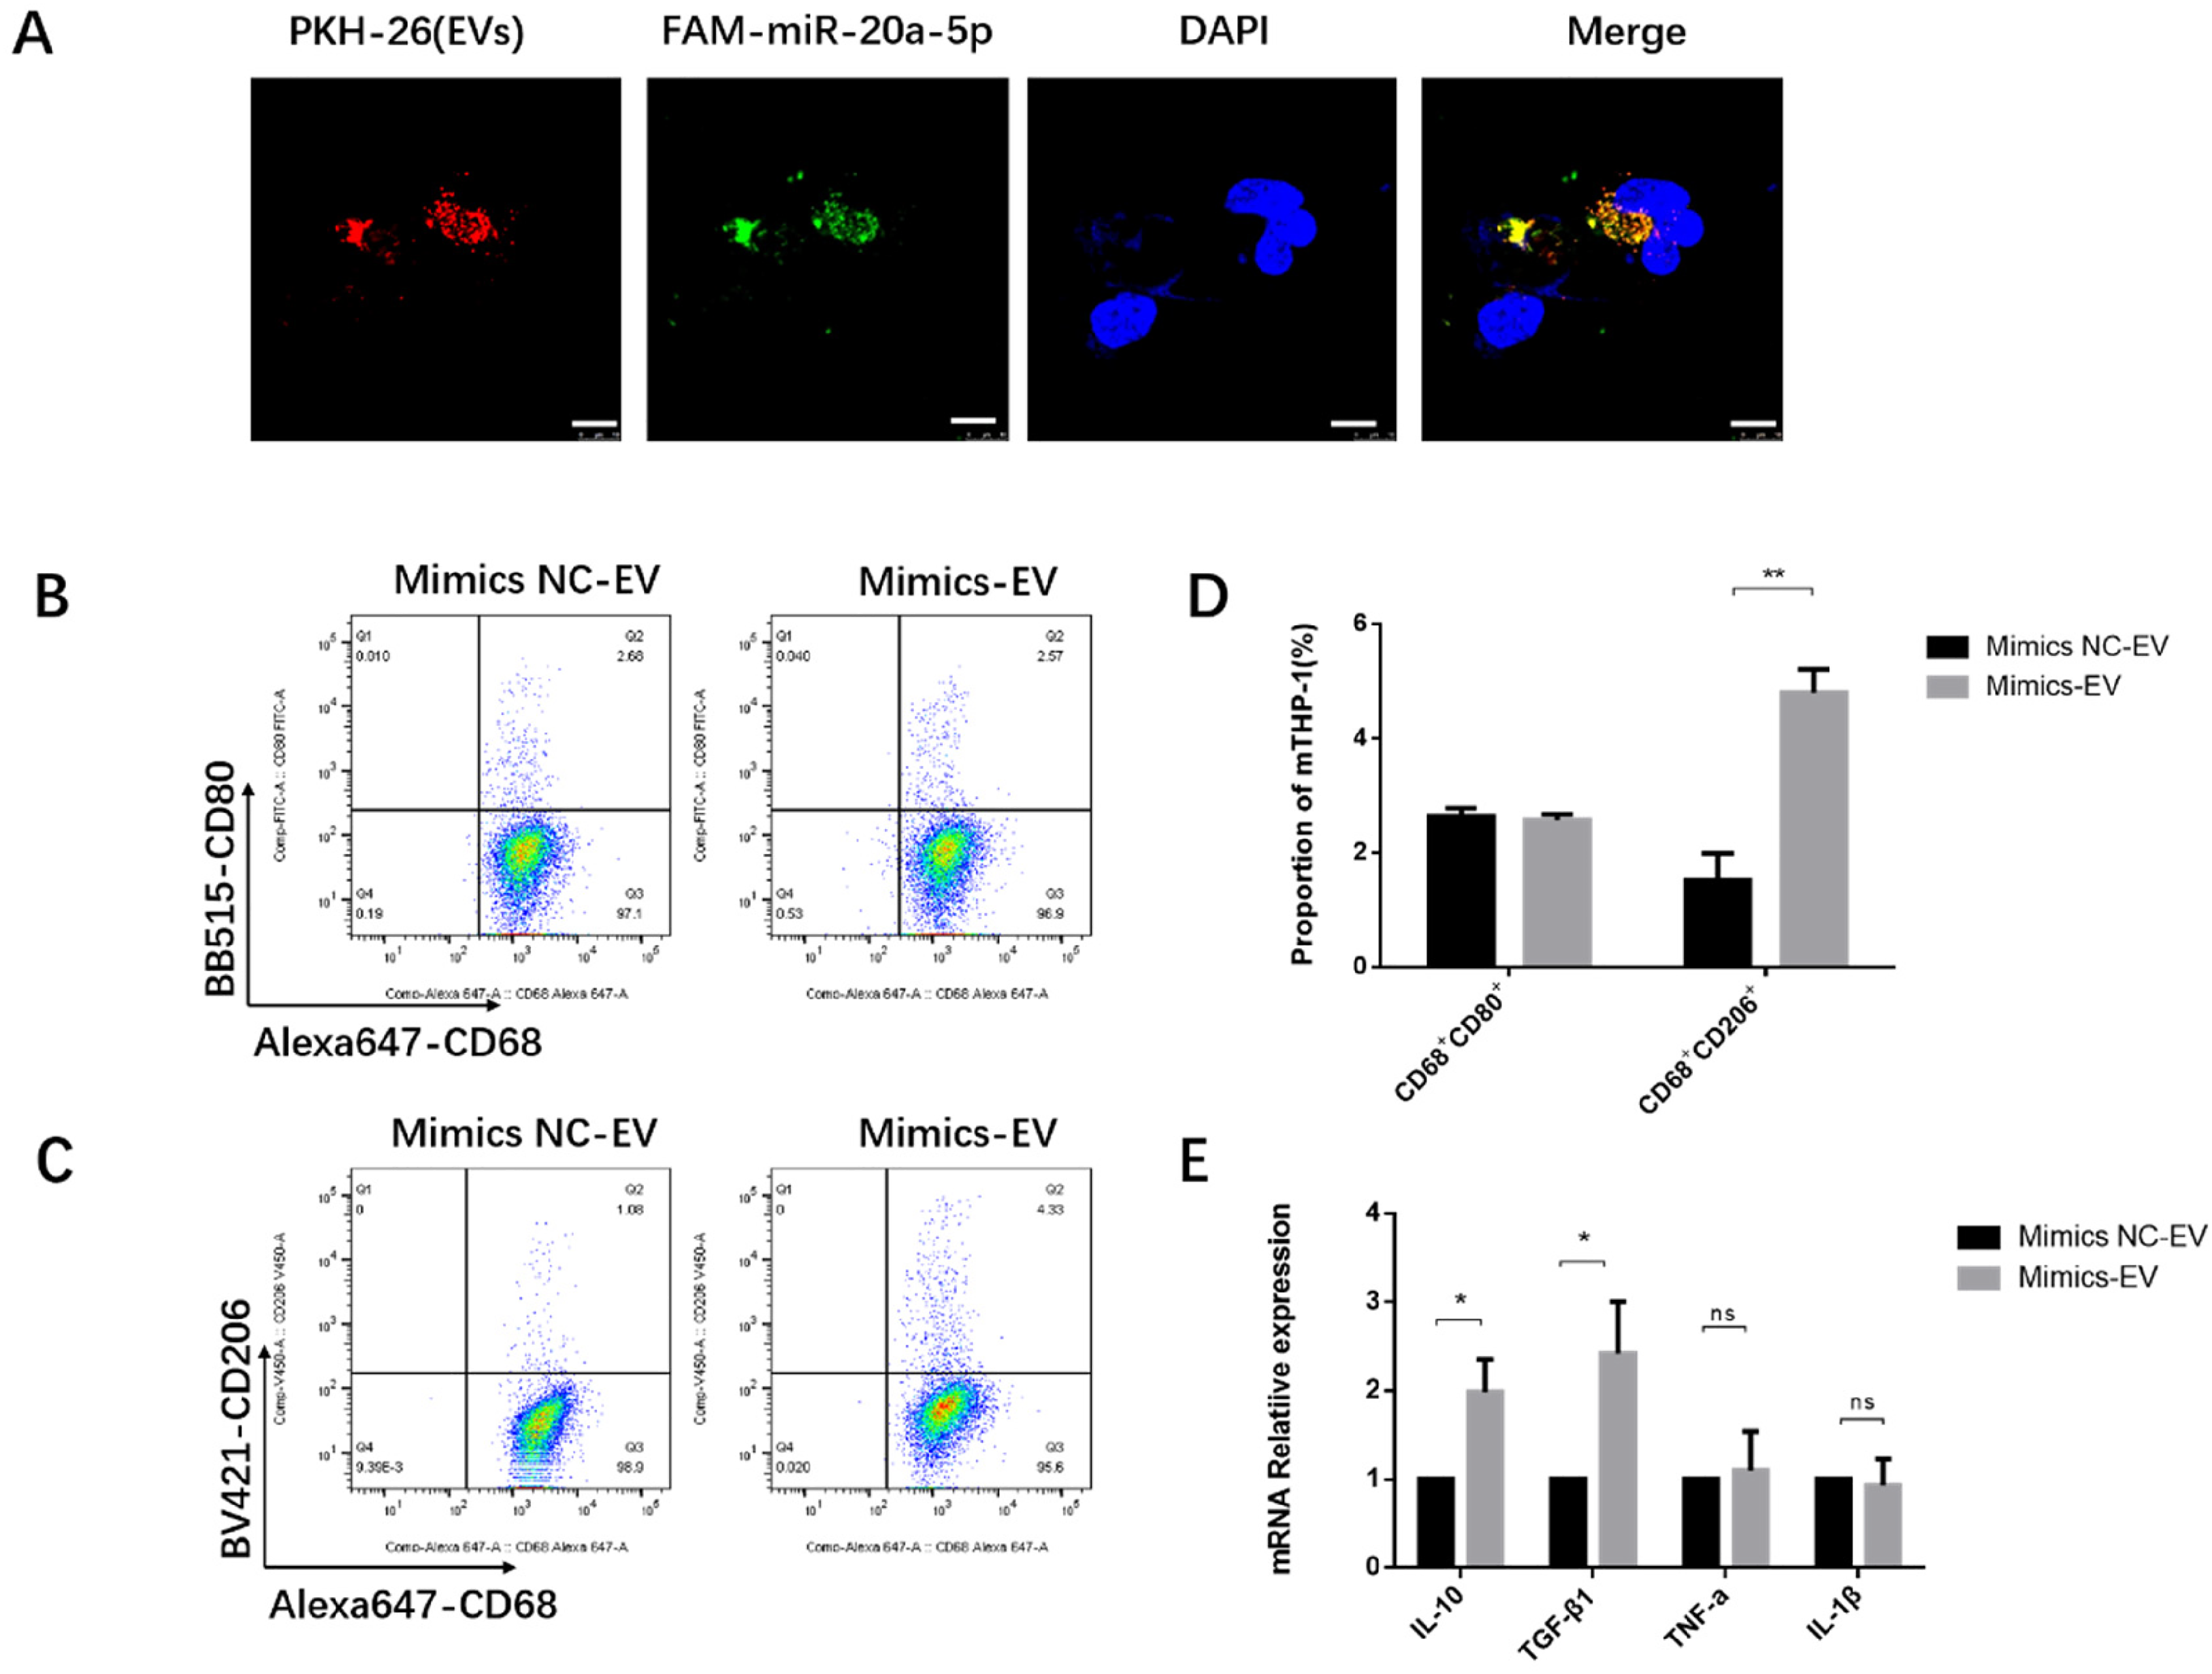
EV-IH treatment promotes M2 macrophage polarization via miR-20a-5p. (A) Macrophages took up EVs containing miR-20a-5p mimics. FAM-labeled miR-20a-5p mimics were transfected into A549 cells, and cultured in the exosome-free conditioned medium for 48 h. EVs were isolated, stained with PKH-26, and co-cultured with macrophages for 12 h, and fluorescence was observed by confocal microscopy (A). Nuclei were stained with DAPI (blue) (bar = 50μm). (B-D) Macrophages treated with EVs containing miR-20a-5p mimics showed the M2 phenotype. Percentages of CD68+CD206+ and CD68+CD80+ cells and the cytokine levels in macrophages cocultured with miR-20a-5p mimics NC-EV and miR-20a-5p mimics-EV, respectively (n = 3). miR-20a-5p mimics-EV and miR-20a-5p mimics NC-EV represent EVs isolated from A549 cells transfected with miR-20a-5p mimics and negative control mimics NC, respectively. (E) IL-10, TGF-β, IL-1β, and TNF-α mRNA levels in macrophages, respectively, cocultured with miR-20a-5p mimics NC-EV and miR-20a-5p mimics-EV were detected by RT-qPCR (n = 3). * P < .05, ** P < .01, ns: not significant. Data are mean ± SD. (Student's t-test).
We hypothesized that miR-20a-5p may partially regulate the effects of EV-IH on macrophages. After A549 cells underwent transfection with miR-20a-5p mimics and negative control (NC), EVs were isolated and co-cultured with macrophages for 48 h, respectively (mimics-EV and mimics NC-EV). The percentages of CD68+CD206+ macrophages were starkly elevated in the mimics-EV group versus the mimics NC-EV group (Figure 4D and E). The percentages of CD68+CD80+ macrophages were similar in both groups (Figure 4C and E). IL-10 and TGF-β1 mRNA amounts in macrophages were markedly elevated in the mimics-EV group in comparison with the mimics NC-EV group (Figure 4F), while IL-1β and TNF-α mRNA levels were similar in both groups (Figure 4F).
miR-20a-5p Promotes the M2 Polarization of Macrophages by Targeting PTEN
miRNAs work by silencing target genes. To examine how miR-20a-5p regulates the M2 polarization of macrophages, the miRTarBase, TargetScan, miRWalk, and mirDIP databases were utilized for the prediction of miR-20a-5p targets. Seven target genes were simultaneously predicted by these 4 databases mentioned above, that is, STAT3, PTEN, ETV1, RBL2, ATG16L1, ITGB8, and BNIP2 (Figure 3C). It was reported that PTEN/Akt signaling regulates the polarization of macrophages, 28 so PTEN was examined as a potential miR-20a-5p target for verification in this study. TargetScan confirmed miR-20a-5p interacted with its putative binding sites in the 3ʹUTR of PTEN (Figure 3E). HEK-293 cells underwent transfection with luciferase reporter containing wild-type (pmiR-RB-ReportTM-PTEN-WT) or mutant (pmiR-RB-ReportTM-PTEN-MUT) PTEN 3ʹUTR, alongside miR-20a-5p mimics or scramble control (Figure 3D). Decreased luciferase activity was observed after transfection with miR-20a-5p mimics. However, after transfection with PTEN 3ʹUTR mutant, luciferase activity was not altered (Figure 3D). The above data indicated that miR-20a-5p can directly interact with PTEN's 3ʹUTR.
PTEN is known to regulate the M2 polarization of macrophages.29,30 Therefore, we hypothesized that miR-20a-5p may regulate the M2 polarization of macrophages by downregulating PTEN in macrophages. To test this hypothesis, mTHP-1 cells underwent transfection with miR-20a-5p mimics, inhibitors, and respective controls for 24 h, and the results showed that miR-20a-5p mimics markedly reduced both PTEN protein and mRNA amounts (Figure 5A, B and G) and up-regulated phosphorylated-Akt (p-Akt) protein expression (Figure 5A, C and D). Additionally, miR-20a-5p mimics starkly elevated CD206 and Arg-1 amounts on macrophages, whereas the miR-20a-5p inhibitor had opposite effects on PTEN (gene and protein amounts), p-Akt, CD206, and Arg-1 proteins (Figure 5A, E and F). Besides, the transfection of macrophages with miR-20a-5p mimics significantly increased IL-10 and TGF-β1 mRNA amounts and reduced TNF-α mRNA expression (Figure 5H). Transfection of macrophages with miR-20a-5p inhibitor significantly reduced IL-10 mRNA amounts (Figure 5I).

MiR-20a-5p promotes M2 macrophage polarization by targeting the PTEN/Akt pathway. (A-F) PTEN, p-Akt, Akt, CD206, and Arg-1 protein levels in macrophages after transfection with miR-20a-5p mimics/inhibitor as detected by immunoblot (n = 3). (G) PTEN mRNA levels in macrophages after transfection with miR-20a-5p mimics/inhibitor as detected by RT-qPCR (n = 3). (H and I) Cytokines mRNA levels in macrophages after transfection with miR-20a-5p mimics/inhibitor as detected by RT-qPCR (n = 3). Transfection of macrophages with miR-20a-5p mimics significantly elevated IL-10 and TGF-β1 mRNA expression levels and reduced TNF-α mRNA expression level (H). Transfection of macrophages with miR-20a-5p inhibitor significantly reduced IL-10 mRNA expression (I).* P < .05, ** P < .01, ns: not significant. All data are mean ± SD. (Student's t-test).
To further examine whether EV-IH regulates M2 macrophage polarization through the miR-20a-5p/PTEN/Akt pathway, macrophages were co-cultured with EV-NA or EV-IH, and compared with EV-NA, EV-IH significantly downregulated the PTEN protein (Figure 6A and B) and upregulated p-Akt, CD206, and Arg-1 proteins (Figure 6A, C and F). Moreover, macrophages transfected with miR-20a-5p inhibitors showed abolished EV-IH-mediated PTEN downregulation and p-Akt, CD206, and Arg-1 upregulation (Figure 6A and C to F).

EV-IH regulates M2 macrophage polarization through the miR-20a-5p/PTEN/Akt pathway. (A-F) PTEN, p-Akt, Akt, CD206, and Arg-1 protein levels in macrophages after transfection with EV-NA, EV-IH, or miR-20a-5p inhibitor as detected by immunoblot (n = 3). ** P < .01. Data are mean ± SD. (Student's t-test).
Discussion
The question addressed by the present study was whether EVs from lung adenocarcinoma cells after culture under IH promote M2 macrophage polarization, and how these EVs regulate macrophage polarization. Here, we first demonstrated IH induces lung adenocarcinoma cells to release miR-20a-5p-containing EVs that promote M2 macrophage polarization. There were more M2-type macrophages in the stroma of tissue samples from LC + OSA patients, and the content of M2-type macrophages had a positive correlation with AHI. Furthermore, IH-induced lung adenocarcinoma cells promoted M2 macrophage polarization through the transmission of miR-20a-5p-enriched EVs, which inhibited PTEN and thus facilitated Akt phosphorylation, thereby enhancing M2 macrophage polarization. Together, these findings suggest lung adenocarcinoma cells exposed to intermittent hypoxia promote M2 macrophage polarization through miR-20a-5p-enriched EVs, which is summarized in Figure 7.

Schematic diagram of IH-treated lung adenocarcinoma cells-derived EVs promoting M2 macrophage polarization. EVs derived from intermittent hypoxia-treated lung adenocarcinoma cells deliver miR-20a-5p to macrophages, targeting PTEN to enhance Akt phosphorylation and M2 macrophage polarization.
Stromal M2 TAMs were highly abundant in patients with lung adenocarcinoma and OSA. TAMs, playing pivotal roles in TME, are involved in cancer cell proliferation and tumor invasion via the release of growth factors and proangiogenic proteins. TAMs are closely related to tumor growth and metastasis in lung cancer. 31 Currently, no study has analyzed the infiltration of M1-type and M2-type TAMs in the tissues of lung cancer cases with and without OSA. First, differences in the distributions of TAMs were detected in tumor islets and interstitial regions of lung cancer. M1-type and M2-type TAMs mainly surrounded the tumor interstitial region, which is consistent with previous studies.32–34 The above findings suggest TAMs, particularly M2 cells, are abundant in the TME in lung cancer and are mainly distributed in the interstitial region of the tumor margin. Moreover, this study showed that OSA did not affect the infiltration of M1 or M2 TAMs in tumor islets in lung cancer. However, in the tumor stroma, the number of M2 TAMs was higher in OSA cases and had a positive correlation with AHI, which suggests that OSA may promote M2 macrophage polarization in the tumor stroma. Similarly, studies have shown the host immune response is affected by the impact of IH on TAMs in tumor-bearing mice exposed to IH.35,36 Decreased amounts of antitumor (M1) TAMs and a shift toward the protumor M2 phenotype were detected in these animal experiments,35,36 which indicates that intermittent hypoxia constitutes an essential parameter affecting the M2 polarization of macrophages.
Previous reports have shown that hypoxia induces tumor-derived EVs secretion,37–40 and it was also reported that intermittent hypoxia enhances exosome secretion by several kinds of cells. 41 Lung cancer cells exposed to IH release EVs, which participate in intercellular communication with macrophages. Previous work by our team suggested intermittent hypoxia increased EVs secretion by A549 cells, and EVs obtained from lung cancer cells cultured under IH up-regulated PD-L1 in macrophages. 25 Moreover, tumor-derived EVs, especially hypoxic tumor-derived EVs, induce the M2 polarization of macrophages,18,19 but whether intermittent hypoxia has the same effects has not been examined, which needs to be further clarified. Consistent with previous studies, the secretion of EVs in the IH group was increased in this work. In the current study, multiple in vitro assays revealed macrophages tended to be M2 after full ingestion of EVs secreted by lung cancer cells. Interestingly, EV-IH treatment amplified this effect. These results suggest that IH enhances the impact of tumor-derived EVs in promoting macrophage polarization into M2, but the critical cargo of EVs responsible for this process remains unknown.
There is a growing body of evidence that the impact of EVs on target cells is largely determined by the harbored miRNAs.42–45 EVs contain multiple miRNAs and transfer them to recipient cells; these exogenous miRNAs modulate gene expression posttranscriptionally by suppressing mRNA translation or inducing mRNA degradation. 46 miRNA-seq in this work determined miR-20a-5p was abundant in EVs secreted by lung adenocarcinoma cells exposed to IH. As a well-studied miRNA, miR-20a-5p has been recently identified in multiple human cancers. A previous report indicated that miR-20a-5p upregulation induces cell proliferation and invasion in head and neck squamous cell carcinoma. 47 Li et al 48 demonstrated that miR-20a-5p is involved in gastric cancer development. Recent studies have suggested that plasma miR-20a-5p may constitute a novel biomarker for early-stage nonsmall cell lung cancer screening.49,50 Considerable evidence suggests that miR-20a-5p is associated with hypoxia. For example, Zhou et al 51 found miR-20a-5p is significantly upregulated in pulmonary smooth muscle cells grown under hypoxia. Yu et al 52 reported that miR-20a-5p was abundant in hypoxia-derived tubular exosomes and alleviated against acute tubular injury. However, the biological function of miR-20a-5p in EVs secreted by lung cancer cells exposed to IH remains unclear. As shown above, miR-20a-5p was secreted into extracellular vesicles by lung adenocarcinoma cells. Further observations revealed miR-20a-5p-enriched EVs were internalized by macrophages, which induces macrophage polarization into the M2 type.
miRNAs regulate genes by interacting with the 3ʹUTRs of target mRNAs. Here, multiple databases were employed to predict the potential gene targets of miR-20a-5p. Of all candidate genes, PTEN has demonstrated associations with the Akt pathway and macrophage polarization.28,53,54 The dual-luciferase assay was carried out to assess whether miR-20a-5p interacts with the predicted binding site of PTEN's 3ʹUTR. Consistent with a previous study, 55 we found miR-20a-5p overexpression resulted in PTEN downregulation, while miR-20a-5p underexpression had the opposite effect. Previous evidence indicates PTEN knockdown promotes Akt phosphorylation, without increasing Akt protein levels.53,54 Consistent with these results, we demonstrated miR-20a-5p targeting PTEN-enhanced Akt phosphorylation. Activation of M2 macrophages requires Akt phosphorylation, as suppressed Akt phosphorylation inhibits the upregulation of M2 genes.56,57 It is known that miR-20a-5p modulates inflammatory responses, apoptosis, and autophagic processes in macrophages by targeting different genes58–60; however, the molecular mechanism of its regulation of macrophage polarization has not been reported. Taken together, these results arguably showed that IH-exposed A549 cells activate the PTEN/Akt pathway in macrophages by transmitting miR-20a-5p-enriched EVs to macrophages, subsequently promoting macrophage polarization into the M2 type (Figure 7).
Nevertheless, there were some limitations in this study. Firstly, only one lung adenocarcinoma cell line was employed for in vitro studies. The possible heterogeneity of the tumors obtained from different patients may impact the EVs produced and their downstream effects. Additional representative lung cancer cell lines will be examined in a subsequent study to validate our findings. Secondly, there is also a locally generated hypoxia in lung adenocarcinoma, which could be another factor explaining the elevated number of M2 TAMs. To further assess the effects of local hypoxia and intermittent hypoxia, animal experiments are required.
In summary, the increase of stroma M2-type macrophages in patients with lung adenocarcinoma and OSA may be relevant to intermittent hypoxia. This study further revealed the cell–cell communication between IH-exposed lung adenocarcinoma cells and macrophages, as well as a previously undescribed mechanism: IH-exposed lung adenocarcinoma cells deliver miR-20a-5p-rich EVs to macrophages, and enhance macrophage polarization into the M2 type via PTEN/Akt signaling. Of great importance and practical consideration, such cell–cell communication between IH-exposed lung adenocarcinoma cells and macrophages, provides new insights into the study of how OSA promotes the metastasis and progression of lung cancer. Our findings might help develop novel options for preventive treatments as well as personalized diagnostics and therapeutics options for lung adenocarcinoma cases with OSA.
Supplemental Material
sj-docx-1-tct-10.1177_15330338231219415 - Supplemental material for Extracellular Vesicles Obtained From Lung Adenocarcinoma Cells Cultured Under Intermittent Hypoxia Induce M2 Macrophage Polarization via miR-20a-5p Delivery
Supplemental material, sj-docx-1-tct-10.1177_15330338231219415 for Extracellular Vesicles Obtained From Lung Adenocarcinoma Cells Cultured Under Intermittent Hypoxia Induce M2 Macrophage Polarization via miR-20a-5p Delivery by Yuanling Liu, Minzhen Lu, Feng Liu, Gang Xu, Congrui Feng, Yuluo Chen, Danyan Cai, Huake Sun, Yanjun Zeng, Jian Xie, Wei Ma and Xinglin Gao in Technology in Cancer Research & Treatment
Footnotes
Acknowledgments
We sincerely thank all the patients who participated in this study. We gratefully acknowledge all technicians of the Sleep Center and Pathology Department of Guangdong Provincial People's Hospital for data analysis support. We would like to thank the Institute of Microbiology, Guangdong Academy of Sciences for their contribution to obtaining TEM imaging. Finally, we would like to thank Guangzhou First People's Hospital, Guangzhou Institute of Clinical Medicine and Guangdong Provincial People's Hospital, Guangdong Academy of Medical Sciences for providing experimental sites and equipment.
Author Contributions
Xinglin Gao and Wei Ma conceived and managed the study. Yuanling Liu and Xinglin Gao suggested the overall hypothesis and contributed to the study design. Yuanling Liu, Minzhen Lu, and Jian Xie performed the experiments and wrote the manuscript. Wei Ma and Feng Liu secured resources and facilities for the research. Gang Xu, Congrui Feng, and Yuluo Chen recruited participants. Huake Sun, Yanjun Zeng, and Danyan Cai collected and analyzed the data. All authors commented on previous versions of the manuscript. All authors read and approved the final manuscript.
Data Availability Statement
Declaration of Conflicting Interests
The author(s) declared no potential conflicts of interest with respect to the research, authorship, and/or publication of this article.
Funding
The author(s) disclosed receipt of the following financial support for the research, authorship, and/or publication of this article: This work was supported by the Science and Technology Planning Project of Guangdong Province (grant number 2017A070701014) and Guangzhou Municipal Science and Technology Project (grant numbers 202206010099, 20220120262, and 2023A04J0610). Author Xinglin Gao has received research support from Guangdong Provincial People's Hospital. Authors Wei Ma and Yuanling Liu have received research support from Guangzhou First People's Hospital.
Ethics Approval
The study protocol was approved by the Ethics Committee of Guangdong Provincial People's Hospital (No. GDREC2017259H(R1)).
Informed Consent
Written informed consent was obtained from all the patients.
Supplemental Material
Supplemental material for this article is available online.
References
Supplementary Material
Please find the following supplemental material available below.
For Open Access articles published under a Creative Commons License, all supplemental material carries the same license as the article it is associated with.
For non-Open Access articles published, all supplemental material carries a non-exclusive license, and permission requests for re-use of supplemental material or any part of supplemental material shall be sent directly to the copyright owner as specified in the copyright notice associated with the article.