
Abstract
Objectives
PLU1 is upregulated in many cancers, including breast, mammary, colorectal, and hepatocellular carcinoma. However, little is known about the potential metabolic mechanisms of PLU1 in glioma progression. Therefore, we investigated the relationship between PLU1 and glioma development.
Methods
We analyzed the relationship between PLU1 expression and World Health Organization (WHO) grade using clinical databases and verified the role of PLU1 in glioma development using transcriptome sequencing, Western blotting, Cell Counting Kit 8, colony formation, and wound healing assays. The relationship between PLU1 and glioma glucose metabolism was also initially explored by changing the concentration of glucose in the culture medium and was validated by metabolomics and energy metabolism.
Result
PLU1 expression was closely related to WHO grade and was significantly elevated in tumor tissues compared to nontumor tissues. Knockdown or inhibition of PLU1 inhibits proliferation and migration of glioma cells. In addition, we found that PLU1 expression was closely associated with glioma metabolism by transcriptomic, metabolomic, and energy-related molecular analyses and correlated with glucose metabolism. We also found that glucose concentration affects PLU1 expression, and that PLU1 expression affects intracellular glucose levels.
Conclusion
PLU1 is a novel regulator of metabolic reprograming and a novel strategy for the treatment of glioma.
Introduction
Gliomas account for 27% of all central nervous system tumors and approximately 80% of malignant brain tumors, with glioblastoma having the highest frequency at approximately 46.1%. Surgery-based comprehensive treatment remains the general principle of malignant glioma treatment, and the existing standard treatment protocol, that is, surgery and radiation therapy combined with temozolomide synchronized chemotherapy, will still be required for a considerable period of time in the future.1,2 In recent years, the role of metabolic remodeling in tumors has received increasing attention owing to the development of metabolomics technologies and the discovery of tumor metabolites through metabolomics.3,4 In addition to acting as substrates for energy production and anabolic growth, metabolites can also regulate the expression of oncogenes/oncosuppressor genes and alter the epigenetic state.5,6 Thus, the reciprocal relationship between gene expression and metabolism plays an important role in tumor development. 7 However, the functions and potential regulatory mechanisms of metabolic reprograming in glioma cells have not yet been fully elucidated. Understanding the molecular mechanisms of glioma is important and urgent for finding new strategies for glioma treatment.
Proteins are performers in life activities. Post-translational modifications play an important regulatory role in protein structure and function. It can change the physicochemical properties of proteins and affect the spatial conformation, steric hindrance, and stability of proteins, which in turn affects the biological activity of proteins and causes functional changes in proteins. 8 Many physiological cellular functions, such as cellular stress responses to the external environment, are also achieved through dynamic protein post-translational modifications. Methylation of proteins is a type of post-translational modification that has received much attention in recent years 9 and occurs mainly on lysine and arginine residues. 10 Methylation of nonhistone proteins such as P53, MAPK, WNT, Hippo, JAK-STAT, and other signaling pathway regulatory molecules induced by methylation enzymes plays an important role in regulating cellular pathophysiological processes.11,12 Several studies have demonstrated that metabolic reprograming is associated with protein methylation. 13
PLU1 is a lysine demethylase belonging to the Jumoji structural domain protein family, also known as KDM5B and JARID1B. It specifically removes trimethyl modification of H3K4 to repress transcription of the corresponding gene.14–16 Previous studies have shown that the PLU1 protein plays a crucial role in the development of breast and prostate cancers and is therefore considered an important drug target protein.17–19 Although PLU1 expression has been studied in some types of cancers, PLU1 expression in gliomas and its role in glioma metabolic reprograming remain unknown.
In this study, we hypothesized that PLU1 plays a role in glioma cell proliferation and migration by regulating metabolic reprograming. We found that PLU1 knockdown and treatment with the PLU1 inhibitor JIB04 inhibited the proliferation and migration of glioma cells. Our study highlights the role of PLU1 in the metabolic reprograming of glioma cells and preliminarily identifies its interplay with glucose. By targeting this novel signaling pathway, clinical therapeutic strategies can be developed for gliomas.
Materials and Methods
Reagents and Inhibitors
Dulbecco's modified Eagle's medium (DMEM, 11965092) and fetal bovine serum (FBS, 11011-8611) were purchased from Gibco (Invitrogen). Streptomycin and penicillin (GNM15140) were purchased from Genome Biotechnology. JIB04 (25 μM final concentration; HY-13953) was purchased from MCE. Anti-β-actin (AF5003, 1:1000), Anti-H3 (AF0009, 1:1000), anti-N-cadherin (AF5237, 1:1000), anti-p-ErK (AF1891, 1:1000), and anti-ErK (AF1051, 1:1000) were purchased from Beyotime Biotechnology. Tri-methyl-histone H3 (Lys4) (H3K4me3) (9751, 1:1000) was purchased from Cell Signaling Technology. Anti-PLU1 (ab181089, 1:1000) was purchased from Abcam. The secondary antibodies, HRP-labeled Goat Anti-Rabbit IgG (H + L) (A0208, 1:1000) and HRP-labeled Goat Anti-Mouse IgG (H + L) (A0216, 1:1000), were obtained from Beyotime Biotechnology.
Cell Culture and Transfection
The U251(TCHu 58) and U87(ATCC HTB-14) human glioblastoma cell lines were purchased from the Cell Bank of the Shanghai Chinese Academy of Sciences. The cells were maintained in high-glucose DMEM supplemented with 10% FBS in a 5% CO2-humidified atmosphere at 37 °C. Glioma cells were seeded overnight in 6-well plates at a density of 3 × 10⁵ cells, and the plasmid was transfected into cells using Lipofectamine®2000 Reagent (Invitrogen). Cells were seeded in 6-well plates at–40% to 60% confluence and transfected with siRNA (50 nM) using Lipofectamine RNAiMax Reagent (Life Technologies) in Opti-MEM medium (Invitrogen) according to the manufacturer's protocol. The transfected cells were incubated at 37 °C for 1 to 3 days before harvesting. The siRNAs (si-PLU1#NC: 5′-TTCTCCGAACGTGTCACGT-3′, si-PLU1#1: 5′-GGAAGATCTTGGACTTATT-3′, si-PLU1#2: 5′-GCAGAATCTTACAACGAAT-3′) for PLU1 were designed and purchased from Ribobio (Guangzhou, China). At 48 h after transfection, the cells were used for Western blotting, Cell Counting Kit-8 (CCK8) cell proliferation, cell migration, and Matrigel invasion assays.
Cell Proliferation Assays and Colony Formation
Cell proliferation was detected using the CCK8. U251 and U87 cells were seeded in 96-well plates (3 × 10³ cells/well). After overnight adhesion, the JIB04 inhibitor was added to the cells. After 1, 3, 5, 7, and 9 days of cytoinhibitor treatment, 10 μL of CCK8 solution was added to each well containing 100 μL of serum-free medium. After incubation at 37 °C for 1 h, the degree of proliferation was determined according to the increase in absorbance at 450 nm.
U251 cells were trypsinized and separated into single-cell suspensions in 6-well plates (500-800 cells/well). After overnight adhesion, the cells were transfected with siRNA (5 nM). After 3 days of transfection, the cells were replaced with normal medium, and the cell medium was supplemented every 3 days. After 14 days of culture, cells were rinsed with cold phosphate-buffered saline (PBS), fixed in paraformaldehyde for 10 min, and then stained with 0.1% crystal violet solution for 10 min at 25 °C Digital images of the plates were used to permanently record colony counts using ImageJ software (National Institutes of Health).
Wound Healing Assay, Migration and Invasion Assays
U251 cells were seeded in 6-well plates. After transfection of U251 cells with either si-PLU1(si-PLU1#NC served as the control) or JIB04 (untreated group was the control group), the entire bottom of the plate was covered with cells, rectangular lesions were formed using a plastic pipette, and monolayers were irrigated twice with PBS and cultured in serum-free medium. At the indicated times, 5 randomly selected fields of view along the lesion margin were photographed using an inverted microscope. ImageJ was used to measure the crossline healing area and calculate the percentage of scratch recovery.
Corning 24-well culture insert plates (Corning, 3422) and polycarbonate membranes with a pore size of 8 μm were used in the Transwell test, as described previously. 20 The upper chamber was coated with Matrigel for cell migration and invasion assays. Glioma cells (3 × 10⁴ cells/well) were added to the upper chamber of DMEM containing 1% FBS and to the lower chamber of DMEM containing 10% FBS. The drug concentrations in the upper and lower chambers were the same with or without JIB04. After 24 h of culture, the insert plate was rinsed with PBS and the upper surface of the film was scraped to remove the cells. The cells at the bottom of the membrane were stained with crystal violet and counted under a microscope (Nikon).
Western Blotting Analysis
The cells were treated with cell lysis buffer, and the lysates were cleared by centrifugation (12,000 rpm, 5 min). Equal amounts of protein samples were separated on 8% to 12% sodium dodecyl sulfate-polyacrylamide gels and electrophoretically transferred to nitrocellulose membranes. Following blocking with 5% nonfat milk at 25 °C or 2 h, membranes were incubated with the primary antibody at 1:1000 dilution overnight at 4 °C and then incubated with a horseradish peroxidase-conjugated secondary antibody at 1:5000 dilution for 1 h at 25 °C Specific immune complexes were detected by Western blotting and chemiluminescence reagents. Finally, Image Lab is used for quantitative analysis of the graphics.
Metabolomic Analyses
Sample extraction and chromatography-mass spectrometry analysis: U251 cells were cultured in 10 cm dish and divided into 2 groups, untreated group and JIB04 group, with 6 parallel cells in each group. Samples were collected when cells grew to 1 × 10⁷ cells/dish, and send the sample to the Zhongke New Life for testing.
Data Processing: Raw data files were pretreated using procedures including peak finding, alignment, filtering, and normalization to total area, a 3-dimensional data set consisting of sample information, peak intensities, peak retention time (RT), and mass-to-charge ratio (m/z). RT and m/z data were used as identifiers for each ion. Moreover, peaks with missing values (ion intensity = 0) in > 80% of the samples were removed to obtain consistent variables. The resultant data matrices were imported into the SIMCA14.1 (Umetrics, Umeå, Sweden) for multivariate statistical analysis. The analysis methods containing Principal component analysis and orthogonal partial least-squares discriminant analysis (OPLS-DA) were used for the metabolite profile analysis.
Biomarker identification and metabolic pathway analysis: The OPLS-DA model was used to visualize metabolic differences between the model and control groups. Variables with VIP >1 in the OPLS-DA model, as well as the variables with p|corr| value >0.58 in S-plot, and the variables with a confidence interval that crossed zero in the jackknifed loading plot were considered as potential biomarkers. The potential biomarkers were identified by using Agilent Mass Hunter Qualitative Navigator (Agilent, USA) combined with and HMDB database (http://www.hmdb.ca), Kyoto Encyclopedia of Genes and Genomes (KEGG) database (http://www.genome.jp/kegg) and Lipid maps database https://www.lipidmaps.org/. Pathway analysis was performed using MetaboAnalyst 3.0 (http://www.MetaboAnalyst.ca/).
RNA-Sequencing Analysis
Trizol reagent was used to extract total RNA from 3 independent cell samples. RNA sequencing was performed using the Zhongke New Life. RNA-seq libraries were constructed using the Illumina TruSeq RNA sample preparation kit (RS-122-2001) and sequenced using Illumina High-seq 2000 with a read length of 50 bp with paired ends. RNA-seq reads were mapped to the human genome (hg19) using TopHat. Only reads mapped to unique genomic locations and with <5% mismatches were further analyzed. We used FPKM to measure gene transcripts, and DEGseq to identify differentially expressed genes. The differentially expressed genes were counted and annotated with the NCBI, UniProt, GO, and KEGG databases to obtain detailed description information.
Statistical Analysis
Data are expressed as mean ± SD, and groups were compared using Student's t-tests or one-way analysis of variance, using GraphPad Prism 9 software. Statistical significance was set at p < .05.
Results
PLU1 Expression Positively Correlated with Glioma
To investigate the role of PLU1 in the development of gliomas, we analyzed the mRNAseq-325 data in the CGGA database (Chinese Glioma Genome Atlas, http://www.cgga.org.cn/). The analysis showed that PLU1 was differentially expressed in different World Health Organization (WHO) grades of glioma, with statistical differences (P < .05) and the highest expression in WHOIII (Figure 1A). PLU1 was also differentially expressed in different types of gliomas (Figure 1B) but was not significantly differentially expressed in primary and recurrent gliomas (Figure 1C). Based on this database, we conducted a series of analyses of the correlation between PLU1 expression levels and clinical characteristics in patients with glioma. The results showed no significant difference in PLU1 expression between the male and female patients (Figure 1D). PLU1 expression was slightly higher in patients younger than 42 years than in patients older than 42 years, and this difference was mainly found in patients with WHO II and WHO III (Figure 1E and F). The level of PLU1 expression was lower in IDH wild-type patients than in IDH mutant patients, and this difference was mainly present in WHO II and WHO IV patients (Figure 1G and H). There was no significant difference in PLU1 expression between patients with and without the 1p-19q deletion (Figure 1I). These results suggested that PLU1 is associated with glioma progression.

The correlation between PLU1 expression level and clinical characteristics of patients with glioma by Chinese Glioma Genome Atlas (CGGA). (A-C) Analysis of the relationship between the PLU1 expression and the malignant degree of glioma. (D) Comparison of the expression level of PLU1 in men and women. (E-F) Comparison of the expression level of PLU1 in patients of different ages. (G-H) The expression level of PLU1 in patients with IDH wildtype was lower than that in patients with IDH mutant. (I) The expression of PLU1 in different 1p-19q co-deletion status.
To investigate the potential role of PLU1 in glioma, we obtained fresh tissue samples from 12 pairs of patients with glioma from the Department of Neurosurgery, Jinhua Hospital, Zhejiang University, and examined their PLU1 mRNA levels; we found that PLU1 was expressed at higher levels in the tumor than in the nontumor tissue (the adjacent tissue) (Figure 2A). For subsequent cellular experiments, we also examined PLU1 expression in commonly used glioma cells and found that U251 expression was higher than that in the other 3 cell lines, which were used for subsequent cellular experiments (Figure 2B).

(A) RT-qPCR analysis of the mRNA expression levels of PLU1 in 12 pairs (tumor and non-tumor) glioma samples (B) RT-qPCR analysis of the mRNA expression levels of PLU1 in U251, U87, U118, and SF126 cells. β-actin was used as a reference for RNA. (C) A nomogram model for predicting the prognosis of glioma.
The nomogram model was drawn using the data from CGGA to predict the effects of IDH1, MGMT, and 1p19q on patient survival (Figure 2C). Prognostic analysis of the CGGA database showed that PLU1 high expression resulted in shortened overall survival and disease-free survival of patients with WHOIII grade, while WHOI and WHOII were not statistically significant (Figure 3). Taken together, these findings clearly demonstrate a direct relationship between PLU1 and the occurrence and development of gliomas.
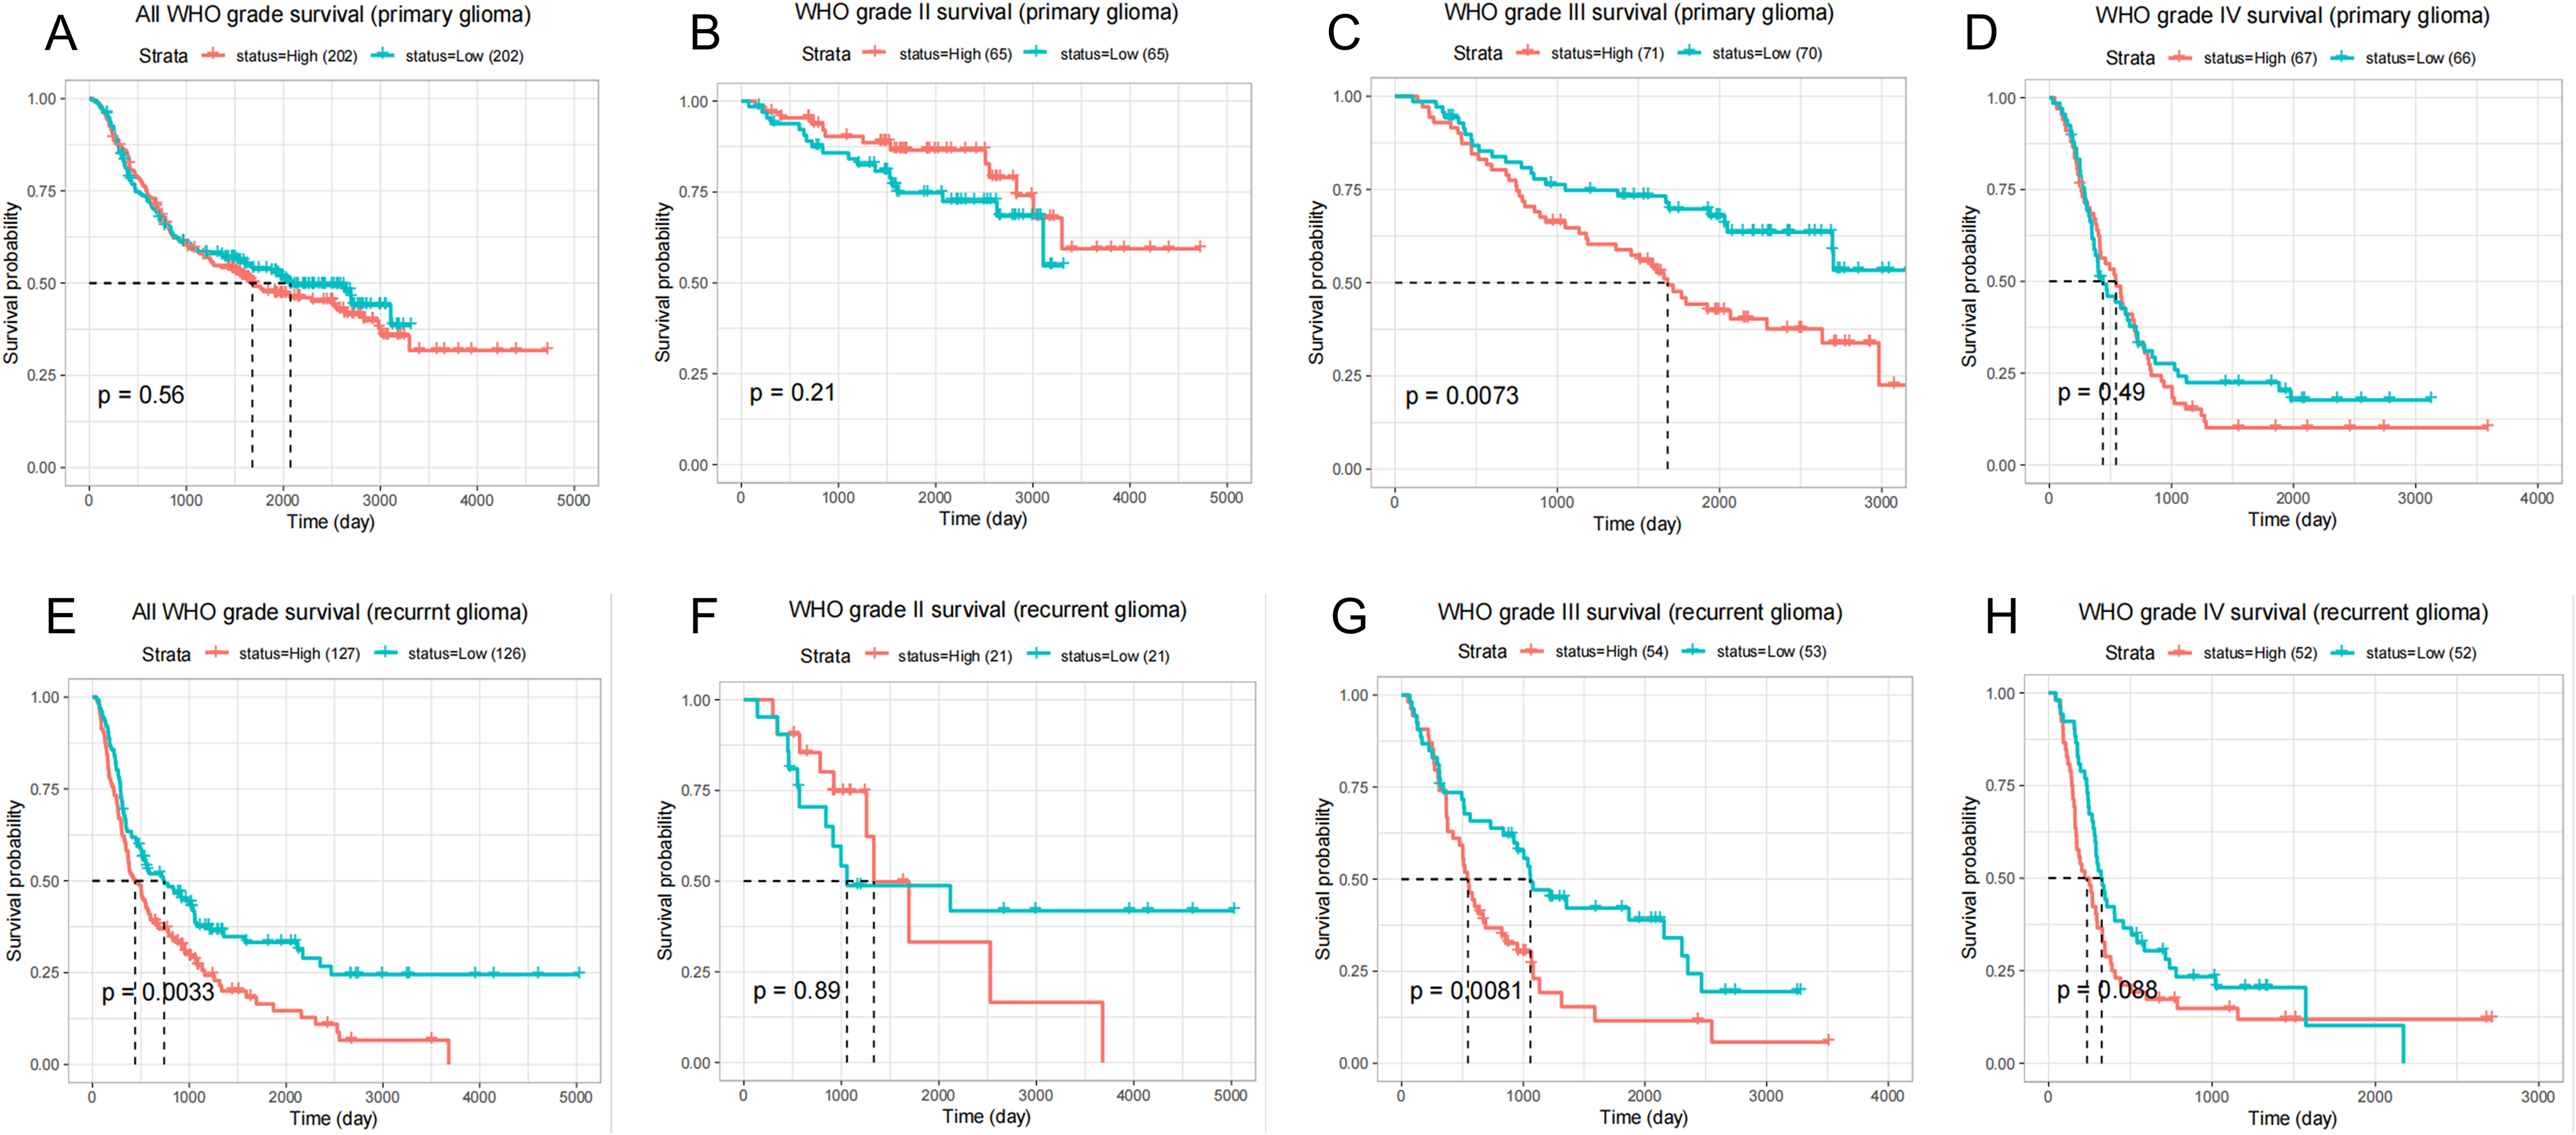
Relationship between PLU1 expression and prognosis of patients with glioma.
PLU1 Knockdown and PLU1 Inhibitor JIB04 Inhibited Glioma Cell Proliferation
PLU1 is upregulated in glioma. To understand the role of PLU1 in glioma progression, we prepared the inhibitor JIB04. IC50 assays demonstrated that the IC50 values of JIB04 in U251 and U87 cells were 26 and 40 μM, respectively (Figure 4A and B). Growth curves were plotted by adding JIB04 (at a concentration of 25 μM) to the 2 cell lines, and it was observed that the growth of the inhibitor-added cells was significantly slower than that of the control cells (Figure 4C and D). We also synthesized a PLU1 siRNA for this experiment. We validated the synthesized siRNA using real time quantitative PCR (RT-qPCR) and found that si-PLU1#1 and si-PLU1#2 significantly knocked down PLU1 mRNA, while si-PLU1#3 had an average effect (Figure 4E). si-PLU1 #1 and si-PLU1 #2 were used for subsequent experiments. Colony formation demonstrated that PLU1 knockdown slowed down the proliferation of U251 cells (Figure 4F).

PLU1 knockdown and PLU1 inhibitor JIB04 inhibited glioma cell proliferation. (A-B) Cell Counting Kit 8 (CCK8) was used to detect the IC50 value of JIB04. (C-D) Cell viability was analyzed by CCK8 assay with U251 and U87 cells inhibited by JIB04. (E) The knockout effect of 3 siRNAs on PLU1 was analyzed by qPCR. (F) Cell proliferation after PLU1 knockdown was analyzed by colony formation. *P < .05.
PLU1 Knockdown or Inhibition Restrained Cell Migration and Invasion in Glioma Cells
Most patients with malignant gliomas, especially glioblastomas, die immediately from distant metastases. Therefore, we investigated the role of PLU1 in glioma cell migration and invasion. The results of the wound healing assay showed that PLU1 inhibition or knockdown significantly reduced the proliferation rate of glioma U251 cells 24 h after wound healing compared to the corresponding control (Figure 5A). The findings from the wound healing assay were validated using a cell transfer pore assay. Our data showed that the mean number of migrating U87 and U251 cells in the PLU1-inhibited group was significantly lower than that in the untreated group. The results of the cell invasion assay also showed a decrease in the invasive capacity of the 2 PLU1-inhibited cell lines compared to that of the control group (Figure 5B).

Knockdown of PLU1 inhibits glioma cell migration and invasion. (A) U251 and U87 cells were treated with JIB04 (25 μM) and siRNA for wound healing test. Images were collected 24 h after the wound. The mobility was 100% at full fusion and 0% at t = 0 h. The figure shows relative mobility. *P < .05. (B) Representative pictures of migration and invasion in U87 and U251 cells with PLU1 inhibited and control. The below figure shows that number of cell migration and invasion per field were counted in 3 random fields for PLU1 knockdown and control groups. Data are shown as mean ± SD.*P < .05. (C) Western blotting method was used to determine the relative protein levels of N-cadherin, Erk, p-Erk, H3K4me3 in PLU1 inhibited or knockdown group and control group (U251 and U87 cells). The relative protein levels of β-actin were used as a control. The histogram shows quantization of Western blotting.
PLU1 Knockdown Inhibited Glioma Cell Proliferation, Migration and Invasion by Regulating the Cell Metastasis-related Markers
To further investigate the mechanisms of proliferation, migration, and invasion, Western blotting was performed to detect typical proteins in the oncogenic signaling pathway. PLU1 mainly catalyzes H3K4 trimethylation to undergo demethylation, we also detected H3K4me3, and Western blotting weakened its signal after knockdown or inhibition of PLU1, demonstrating diminished PLU1 activity. N-cadherin plays a critical role in glioma cell migration and invasion. Our results showed that N-cadherin expression was reduced in U87 and U251 cells after PLU1 knockdown or inhibition. These data are consistent with the results of the Transwell experiments. Extracellular signal-regulated kinase (Erk) phosphorylation is closely related to cell proliferation, and our results showed that phospho-Erk1 (Thr202/Tyr204)/Erk2 (Thr185/Tyr187) (p-ErK) was reduced and total Erk was unchanged in U87 and U251 cells after PLU1 knockdown or inhibition, consistent with the results of the cloning experiments (Figure 5C).
PLU1 is Required for the Metabolism Pathway of Glioma Cells
To reveal the mechanism of PLU1-dependent tumorigenesis in glioma cells, RNA-seq analysis was performed on glioma cells treated with or without JIB04 to identify the genes affected by PLU1(Figure 6A). There were 4596 differentially expressed genes between JIB04 treated group and untreated groups (fold change > 2.0), including 2299 upregulated and 2297 downregulated genes (Figure 6B). When these differentially expressed genes were included in the KEGG pathway analysis, many pathways were found to be significantly enriched, including metabolism-related pathways (Figure 6C). Simultaneously, GO enrichment analysis was used for functional classification, and p-values were used for sorting (Figure 6D). Gene set enrichment analysis further revealed that several metabolic pathways were regulated in the PLU1-inhibited cells (Figure 6E). Among them, 1 carbon pool was inhibited by folate, fatty acid metabolism, histidine metabolism, and other metabolic pathways. Glycine serine and threonine metabolism, fructose and mannose metabolism, glycolysis, gluconeogenesis, and other metabolites were activated. Therefore, PLU1 plays an important role in maintaining the expression of metabolism-related genes in glioma cells.

Analysis of transcriptome sequencing results. (A) Heat map analysis of differential gene profiles after JIB04 inhibition. (B)Volcano plot analysis of differential gene profiles after JIB04 inhibition. (C) KEGG pathway analysis of differential gene enrichment. (D) GO enrichment analysis of differential gene enrichment. (E) Gene set enrichment analysis (GSEA) further revealed that several metabolic pathways were regulated in PLU1-inhibited cells.
PLU1 Plays an Important Role in Glucose Metabolism
Transcriptome results showed changes in several genes related to glucose metabolism. We verified these results by qPCR and found that the mRNA changes of glucose metabolism-related genes were not identical in the 2 glioma cells under JIB04 treatment, but there were significant elevations in HK2, ENO2, ENO1, and LDOA (Figure 7A and B). This result tentatively confirms that PLU1 is associated with glucose metabolism in glioma cells. To confirm this conclusion, we performed metabolomic assays (Figure 8A to D). From the metabolome results, it was observed that there were multiple metabolite alterations in JIB04-treated cells, which also included D-glucose (Figure 8E). KEGG enrichment analysis of differential metabolites in the metabolome showed that multiple pathways were altered (Figure 8F). Since PLU1 inhibition can alter glucose metabolism as well as glucose content, changes in glucose content also cause changes in PLU1 expression. We treated glioma cells with different concentrations of glucose for 24 h (0 × , 1/4 × , 1/2 × , 1 × , 2 × , 5 × , normal high glucose DMEM glucose concentration of 4.5 g/L, 0 × means no glucose, 1/4 × means glucose concentration is 1.125 g/L, 1/2 × means glucose concentration is 2.25 g/L, 2 × means glucose concentration is 9 g/L, 5 × means glucose concentration is 18 g/L) and found that PLU1 protein expression increased as the concentration of glucose increased (Figure 8G). After treating the cells with 1/4 × DMEM for different times (0, 2, 4, 6, 8, and 10 h), the protein expression of PLU1 gradually decreased over time (Figure 8H). This finding again validates the relationship between PLU1 and glucose metabolism. Finally, we examined the changes in 20 molecules related to energy metabolism after PLU1 inhibition, in which 3-Phospho-D-glycerate, Lactate, Cyclic AMP, ADP, NAD and NADP were decreased, and fumarate, cis-atconitate, Citrate Dihydroxyacetone phosphate, l-malic acid, and succinate were increased (Figure 9A and B).
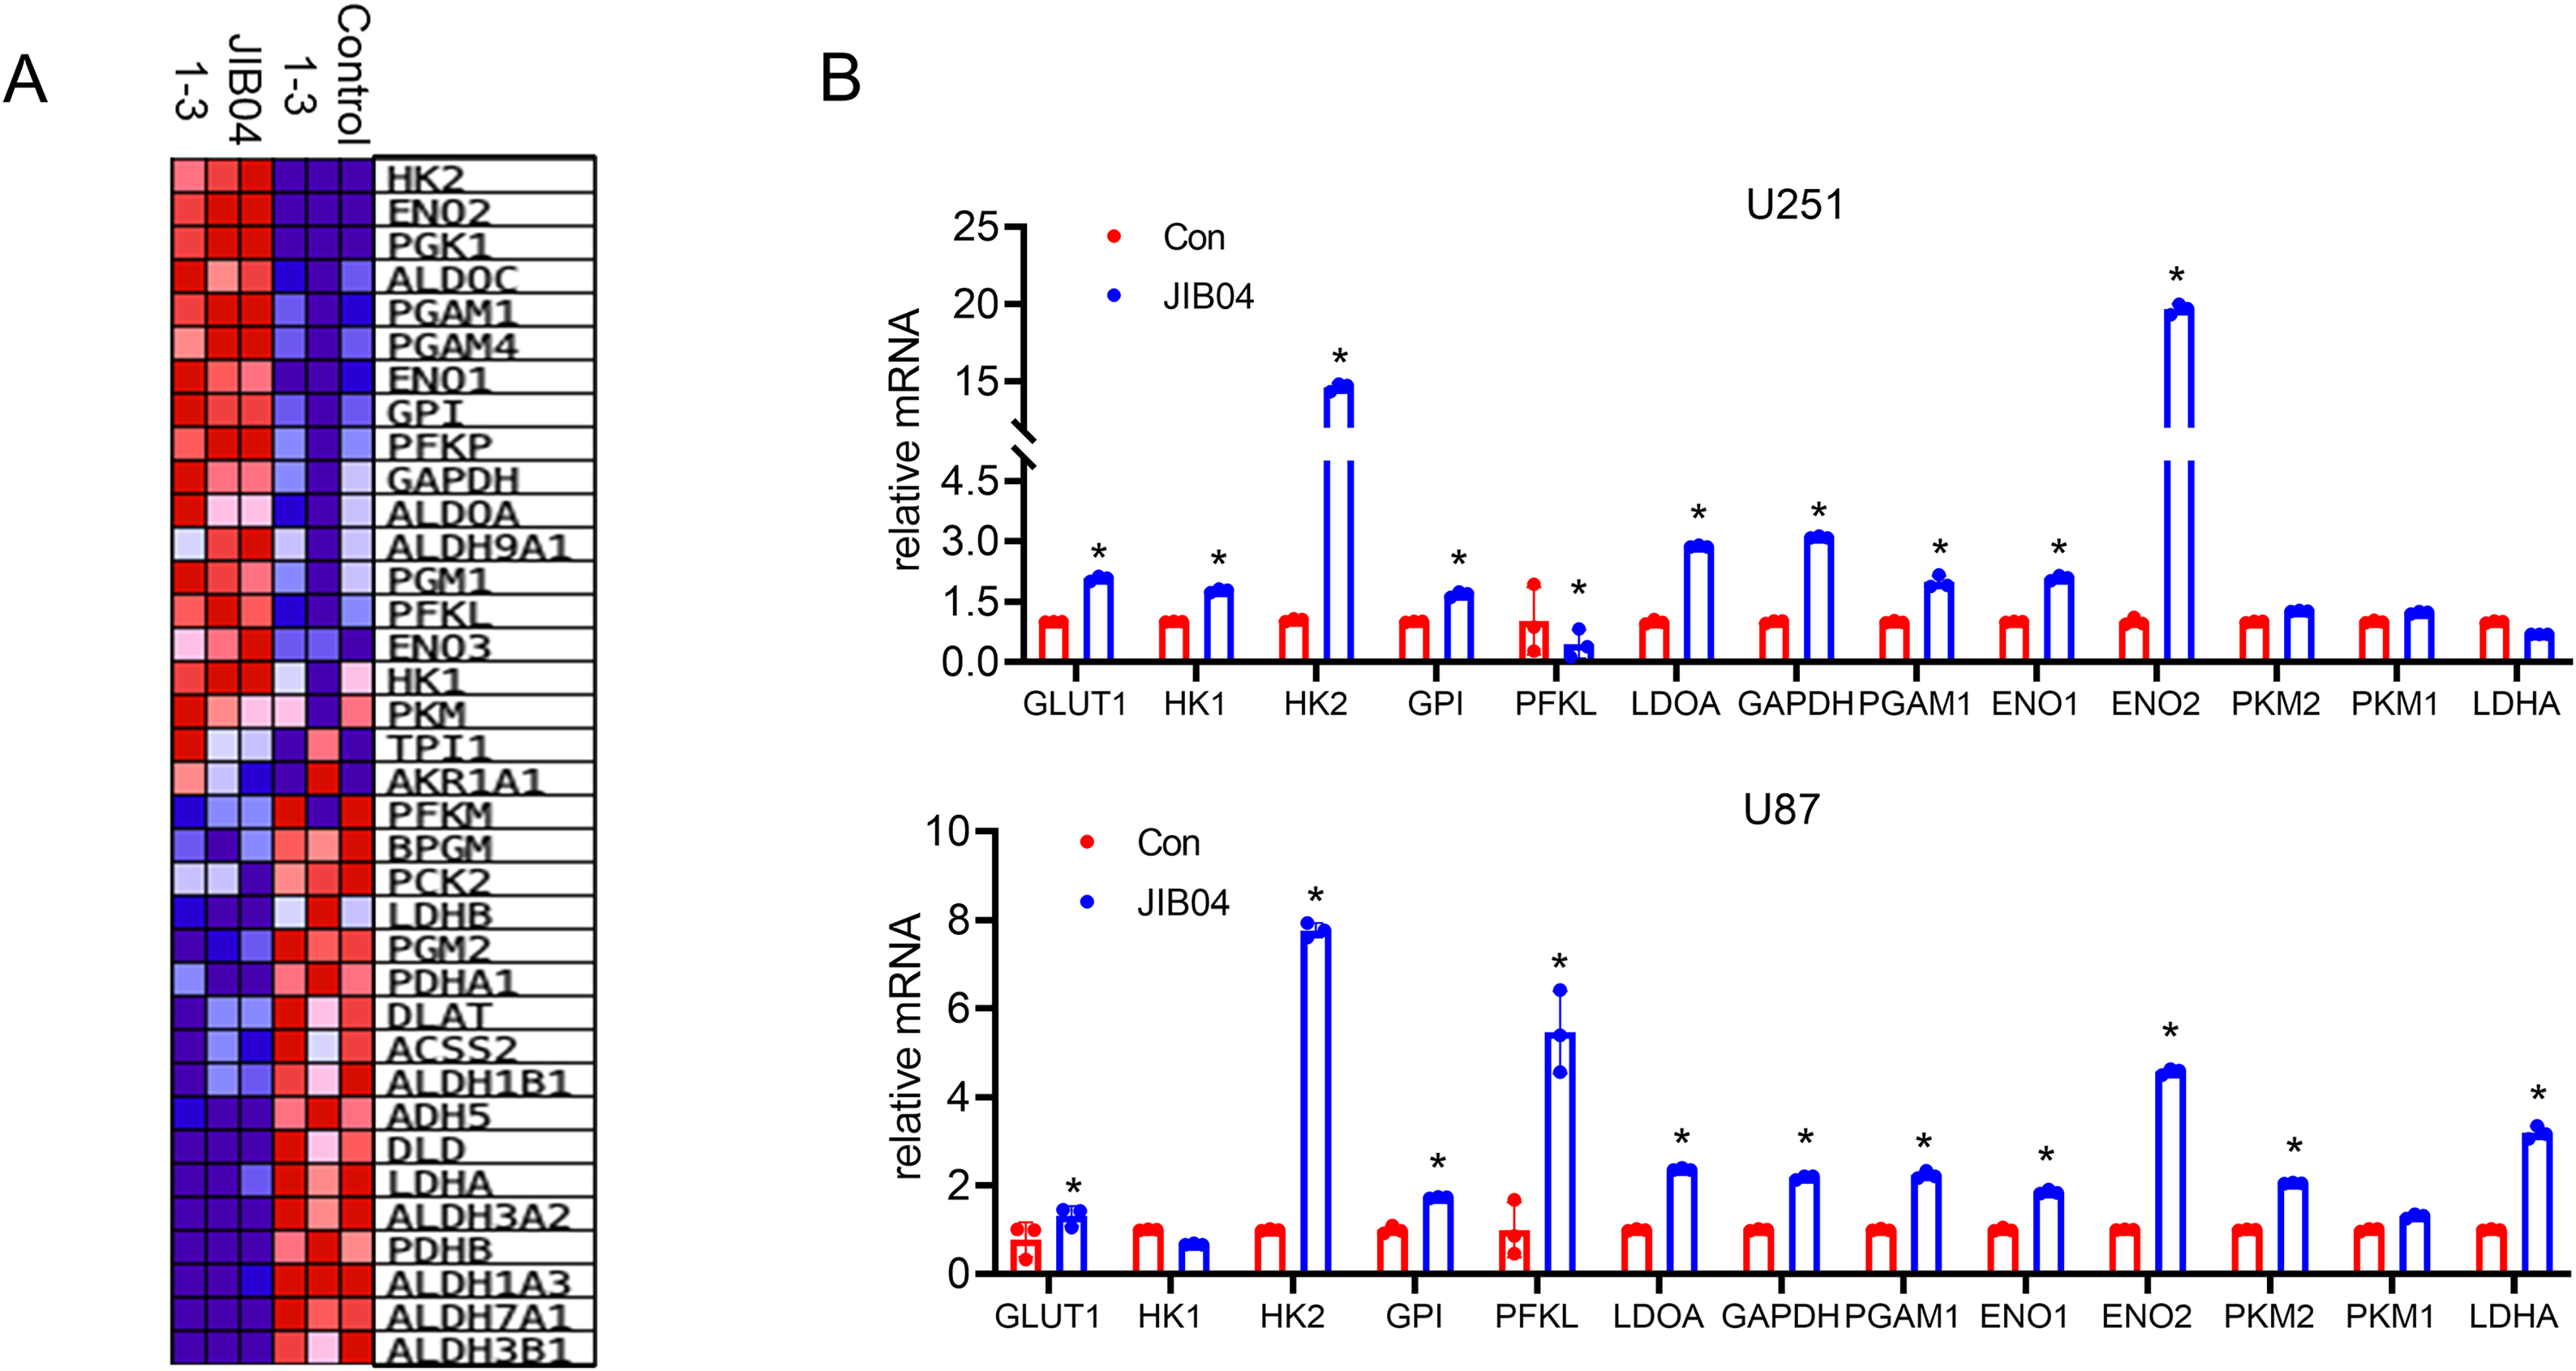
Altered expression of multiple glucose metabolism-related genes after PLU1 inhibition. (A) Heat map showing the expression of genes related to glucose metabolism in the transcriptome. (B) qPCR analysis of glucose metabolism-related gene expression. *P < .05.
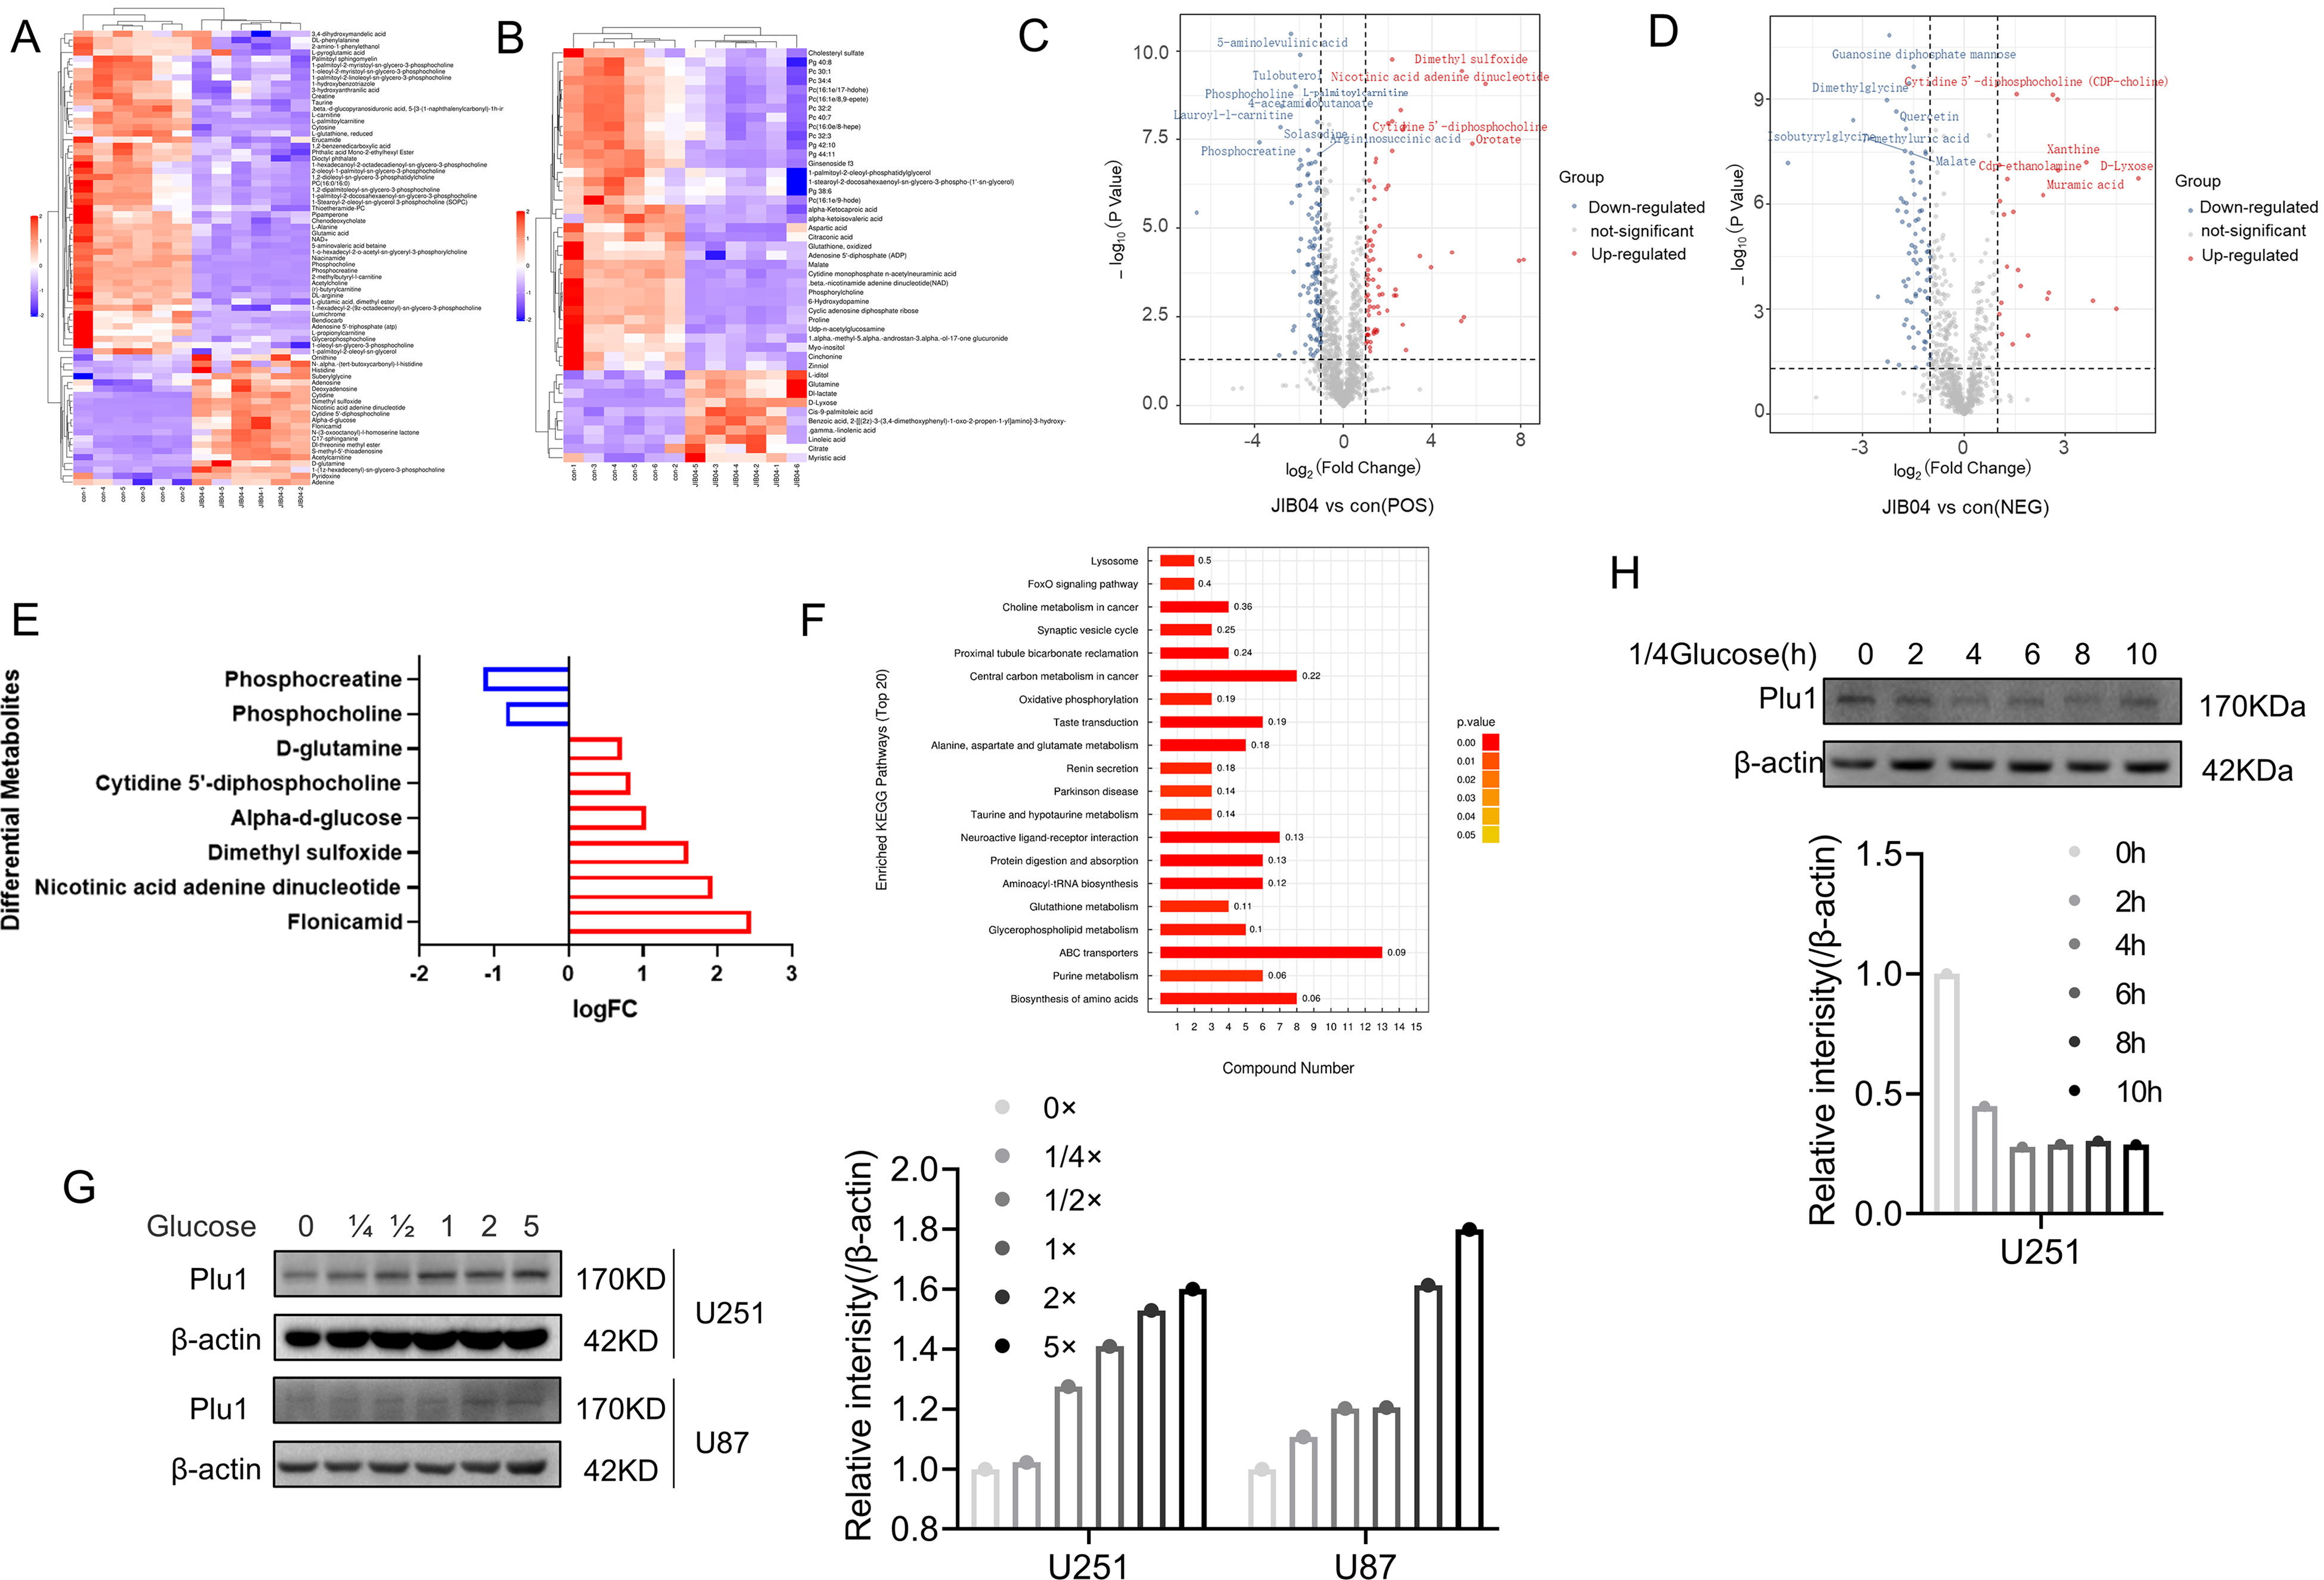
Results of metabolomics analysis. (A-B) Heat map showing the differential metabolites detected by the positive and negative ion metabolome. (C-D) Volcano map showing differential metabolites detected by the positive and negative ion metabolome. (E) Significant changes in glucose content. (F) KEGG pathway analysis of differential metabolites. (G) Western blotting was used to detect the changes in PLU1 after treatment at different concentrations. The histogram shows quantization of Western blotting. (H) Western blotting was used to detect the change in PLU1 after 1/4 glucose treatment for different time intervals. The histogram shows quantization of Western blotting.

Detection of changes in the content of molecules related to energy metabolism after PLU1 inhibition.
Discussion
According to mounting data, PLU1 expression appears to be elevated in a variety of tumors, including thyroid, colon, and breast cancers. However, the relationship between PLU1 expression and glioma metabolism remains unclear. In this study, transcriptomics, metabolomics, and energetics were used to clarify the critical functions of PLU1 in the metabolic reprograming of glioma: (1) analysis of glioma cell lines, patient tissue samples, and the public GCCA database revealed that PLU1 was significantly upregulated in gliomas; (2) PLU1 downregulation significantly reduced glioma cell proliferation, migration; (3) glioma cells in which PLU1 downregulation altered multiple metabolism-related signaling pathways; and (4) PLU1 could change with glucose concentration.
PLU1 represses transcription by removing the H3K4me3 mark from specific promoters. 14 PLU1 is also involved in transcriptional activation and demethylase-independent activities, which are less well-known aspects of gene regulation. PLU1 knockdown significantly inhibited the wound-healing ability of glioma cells. Inhibition of PLU1 affected the ability of glioma cells to migrate to transverse ventricles in glioma cell migration and invasion experiments. Epithelial-mesenchymal transition (EMT) is a process by which epithelial cells lose intercellular adhesion and acquire migratory and invasive properties. EMT is associated with enhanced N-cadherin expression and predicts unfavorable prognosis. 21 Our study showed that PLU1 knockdown regulates N-cadherin expression. However, the relationship between N-cadherin and PLU1 requires further investigation. In conclusion, we found a correlation between PLU1 and glioma progression and revealed the inhibitory role of PLU1 in glioma cell proliferation, migration, and invasion. This study provides a valuable therapeutic strategy to control glioma progression.
Altered tumor cell metabolism is now considered to be a hallmark of tumor cells. Metabolic reprograming in tumor cells has been shown to support tumor cell proliferation and survival. To meet the energy and synthetic requirements for tumor growth, the tumor cell metabolism undergoes reprograming. Transcriptome analysis of glioma cells with PLU1 inhibition revealed that multiple metabolism-related molecules were altered, and enrichment analysis of differential genes, 1-carbon pool by folate, fatty acid metabolism, histidine metabolism, and other metabolic pathways were altered. Further metabolomic and energy metabolite analyses showed that glucose and its metabolism-related molecules were significantly altered. The mechanism by which PLU1 regulates glucose metabolism and the reason for glucose concentration changing the expression of PLU1 needs to be further investigated. Many histone methylase also catalyze the demethylation of nonhistone proteins. For example, LSD1 can also catalyze the demethylation of HIF1α and inhibit its ubiquitination degradation. 12 Catalytic demethylation of p53 by KDM4A is necessary for SCF-dependent ubiquitination degradation of p53. 22 In our study, it was also found that after treating with JIB04, RNA levels of many glucose metabolization-related molecules such as ENO1, ENO2, HK2, etc., were changed, so we guessed that PLU1 could also play the role of its demethylase to catalyze glucose metabolization-related enzymes. Unfortunately, this was not confirmed in this study, and we will verify it in the future.
Conclusion
In conclusion, we identified a correlation between PLU1 and glioma progression and revealed the inhibitory role of PLU1 in glioma cell proliferation, migration, and invasion. PLU1 is also involved in the regulation of glioma metabolism-related genes and, thus, in the metabolic reprograming of glioma cells. This study provides a valuable therapeutic strategy for controlling glioma development.
Footnotes
Author Contributions
Formal analysis was performed by Qi Tu and Tian Zhou; Methodology was designed by Jianlie Yuan and Minfeng Tong; Resources were handled by Ting He; Writing—original draft was done by Lude Wang and Yi Pan; Writing—review and editing was done by Wentao Dong.
Declaration of Conflicting Interests
The authors declared no potential conflicts of interest with respect to the research, authorship, and/or publication of this article.
Ethical Approval
This study was approved by the Jinhua Municipal Central Hospital Seal of Institutional Review Board, (Study)2020-141-001.
Funding
The authors disclosed receipt of the following financial support for the research, authorship, and/or publication of this article: This work was supported by Jinhua Science and Technology Research Program (2020-3-049, 2021- 3-061, 2019-3-008), Jinhua City Key Disciplines (Neurosurgery) (JYZDXK-2019-17).