
Abstract
Keywords
Introduction
Primary pulmonary sarcoma (PPS) is a very rare and aggressive non-epithelial (mesenchymal) malignancy originating in the mesenchymal tissue of bronchial wall, blood vessels, and lung mesenchyme. 1 Incidence of PPS accounts 0.4% to 1.1% among all other types of lung malignant tumors. 2 PPS infiltrates into the lung parenchyma and spreads into the bronchi. 3 However, PPS is more aggressive and exhibits a worse prognosis followed by 35% of 5-year overall survival (OS) when compared to non-small cell lung cancer (NSCLC).4–6 Lungs are the most metastatic sites for soft tissue sarcomas, and the formation of extrapulmonary metastatic sarcomas tend to be more common in terms of occurrence than PPS.7,8
Diagnosis of PPS is considered as an intricate process due to the difficulty in distinguishing PPS with primary and extrapulmonary metastatic sarcoma, pulmonary epithelial tumors, pulmonary sarcomatoid carcinoma, and malignant melanoma. 9 Therefore, a patient's comprehensive medical history, and a more detailed examination of biopsy, or pathological samples are required to confirm the sarcoma of lung origin. 10
Very limited patients cases with PPS have been reported in the literature so far due to the low, and sporadic incidence rate.11,12 Generally, the prediction of survival rate of patients with PPS is based on the personal experience of doctors. 2 Till now, there is no standard predictive model for the risk and prognosis of PPS patients. Therefore, it is necessary to establish a prediction model to help clinicians for evaluating the prognosis of PPS patients more accurately.
Five-year OS rate pertinent to PPS is influenced by several factors including patient age, tumor size, surgery, metastasis, degree of histological malignancy, and therapeutic modalities.2,11,12 Tumor prognosis can be accurately predicted using nomograms. Data pertinent to PPS patients procured from the registry of ‘Surveillance, Epidemiology, and End Results (SEER) program database’. Thus, nomogram is an effective predictive model for evaluating tumor outcomes by integrating multiple prognostic factors based on variable regression coefficients. 13 In certain cancers, nomogram has been proved to have better predictive ability than traditional tumor node and metastasis (TNM) classification. 14 In present work, a nomogram was constructed based on the SEER database to evaluate the survival probability and prognostic factors more accurately for PPS patients subsequently to prefer personalized therapeutic regimen. In addition, PPS patients were stratified according to the degree of risk based on nomogram, and the influence of adjuvant radiotherapy and chemotherapy on the prognosis of different groups was analyzed.
Methods
Data Sources
Data collection was performed from the SEER database; the data acquired from this database was approved by the local ethical committee for analysis. Hence, our study has not required any ethical approval statement. The SEER program registry has the authoritative registered malignant tumor data in the United States which has been collecting data from 18 cancer registries, and covering 30% of the U.S. population. We obtained the information of patients diagnosed with PPS during the period of 1998 to 2015 in SEER database and collected the following clinical data including, age, sex, race, marital status, ICD-O-3 histological type, location of primary tumors, number of primary tumors, degree of differentiation, tumor size, involved lymph nodes, laterality, number of positive lymph nodes, surgery, lymph node resection, summary stage, radiotherapy, chemotherapy, follow-up time, survival status, and cause of death.
Inclusion and Exclusion Criteria
Inclusion criteria was performed according to the factors such as (1) the diagnosis time, 1998 to 2015, (2) the primary sites of PPS in lung and bronchus (C34.0-C34.9), (3) ICD-O-3 histological type confirmed by pathology: epithelioid hemangioendothelioma, hemangiosarcoma, pleuropulmonary blastoma, chondroma, monophasic/biphasic synovial sarcoma, pulmonary artery/vein sarcoma, and (4) exact follow-up information.
Exclusion criteria were executed according to the factors including (1) non-pathologically positive data and (2) unknown survival time.
Statistical Methods
The patient's age diagnosed with PPS and tumor diameter were analyzed by x-title software to obtain the best cut-off value in our study. Later, they were grouped as per the obtained value. Baseline characteristics of PPS patients were described with the aid of descriptive statistics. Categorical variables were compared by Chi-squared test or Fisher's exact test using SPSS21.0 software. The results of univariate and multivariate Cox risk regression analysis were expressed in risk ratio (HR) and corresponding 95% confidence interval.
Based on the cox proportional risk model, a nomogram was constructed using R4.1.0. Nomogram performance was evaluated by the concordance index (C-index), receiver operating characteristic (ROC) curves and calibration curves. Kaplan–Meier method was used to calculate the survival probability and draw the survival curve. Log-rank test was used to compare the differences between groups. A two-sided P value < .05 was considered statistically significant.
Establishment of Nomogram
Data were randomly segregated into ‘training group’ and ‘validation group’ (7:3 ratio) using R studio software “sample” package. For the training group, we used univariate and multivariate Cox regression analysis to predict the independent risk factors pertinent to OS; subsequently HR and corresponding 95% confidence interval were calculated. Forward logistic regression analysis was performed to eliminate redundant variables. Forest map was drawn with the aid of “forest” package in R statistical computing software to further visualize results of multivariate Cox regression analysis. This study used “rms”, “foreign” and “survival” packages to obtain the nomogram model and to assess the prediction ability and accuracy of nomogram. P values < .05 indicate statistical significance.
Validation of Nomograph
The accuracy and reliability of nomogram was verified in the training group and validation group respectively. C-Index was determined in order to assess the ability of a model for predicting occurrence of the event. The value range of C index was 0.5 to 1. When the C index was equal to 0.5, then the model cannot be distinguished. A higher value of C index indicates the stronger ability of its model to predict the occurrence of events. In addition, we used the “risk regression” package to obtain the ROC curve of multivariate Cox regression to quantify the prediction ability of nomogram. A higher area under the curve (AUC) of ROC depicts a stronger prediction and judgment ability of the model. Bootstrap self sampling method was used internally to verify the effectiveness of nomogram-survival prediction model. The calibration curve was obtained by resampling the above data for 1000 times. It can be used to evaluate the accuracy of the model based on the difference between the probability of events predicted by the model and the observed outcome frequencies. A closer predicted calibration curve to the standard curve indicates higher accuracy of the model.
Risk Stratification Based on Nomogram
Total score related to the individual patient was determined using nomogram formula package. The optimal cutoff value was calculated using the “surv_cutpoint” function. We divided the training group and validation group into high-risk group and low-risk group according to the best cut-off value for determining nomogram accuracy. Subsequently, we performed Kaplan–Meier survival analysis for assessing the significance of survival differences between low-risk and high-risk groups; P < .05 was considered as statistically significant.
Effects of Adjuvant Radiotherapy and Chemotherapy in Different Risk Groups
The influence of adjuvant radiotherapy and chemotherapy in high risk and low risk groups were deciphered as per the OS analysis and prognosis.
Results
The Best Cutoff Values for Age and Tumor Size
The results of X-title software analysis showed that the best cut-off values for age were 50 and 80 years old, therefore, the patients were segregated into three age groups viz.,
Clinicopathological Features of Training Group and Validation Group
Patients diagnosed for PPS during the time period of 1998 to 2015 were obtained from SEER database; a total of 515 eligible patients were included in this study. Training group composed of 360 patients whereas validation group composed of 155 patients after random division as per the ratio of 7:3. Significant differences in ‘tumor laterality distribution’ and ‘surgery on other sites’ between the two groups (P < .05) was observed. The demographic distribution and pathological characteristics of two groups were described in Table 1.
Demographic Characteristics Distribution and Clinical Characteristics of Training Group and Validation Group.

Univariate and Multivariate cox Regression Analysis
Univariate analysis of cox proportional regression model showed that age, sex, marital status, ICD-O-3 histological type, degree of differentiation, tumor size, involved lymph nodes, laterality, summary stage, number of positive lymph nodes, surgery of primary site, lymph node resection, and chemotherapy could significantly affect the survival state (P < .05). Consequently, we further incorporated these factors analyzed through multivariate cox proportional regression analysis (P < .05). Age, tumor size, histological type, lymph node resection, summary stage and degree of differentiation were significantly correlated with OS of the patients diagnosed with PPS. Forest map described the results of multivariate cox regression (Figure 1) (Table 2).

Forest map depicts the results obtained through multivariate Cox proportional regression pertinent to the training group analysis.
The Outcomes Observed Through the Univariate and Multivariate Cox Proportional Regression Analysis in Training Group.

Construction of Nomogram
Six important prognostic factors including age, tumor size, histological type, lymph node resection, summary stage and degree of differentiation were determined for the training group using multivariate analysis. A nomogram was built to predict the 1-year, 3-year and 5-year OS of PPS patients based on these factors (Figure 2).
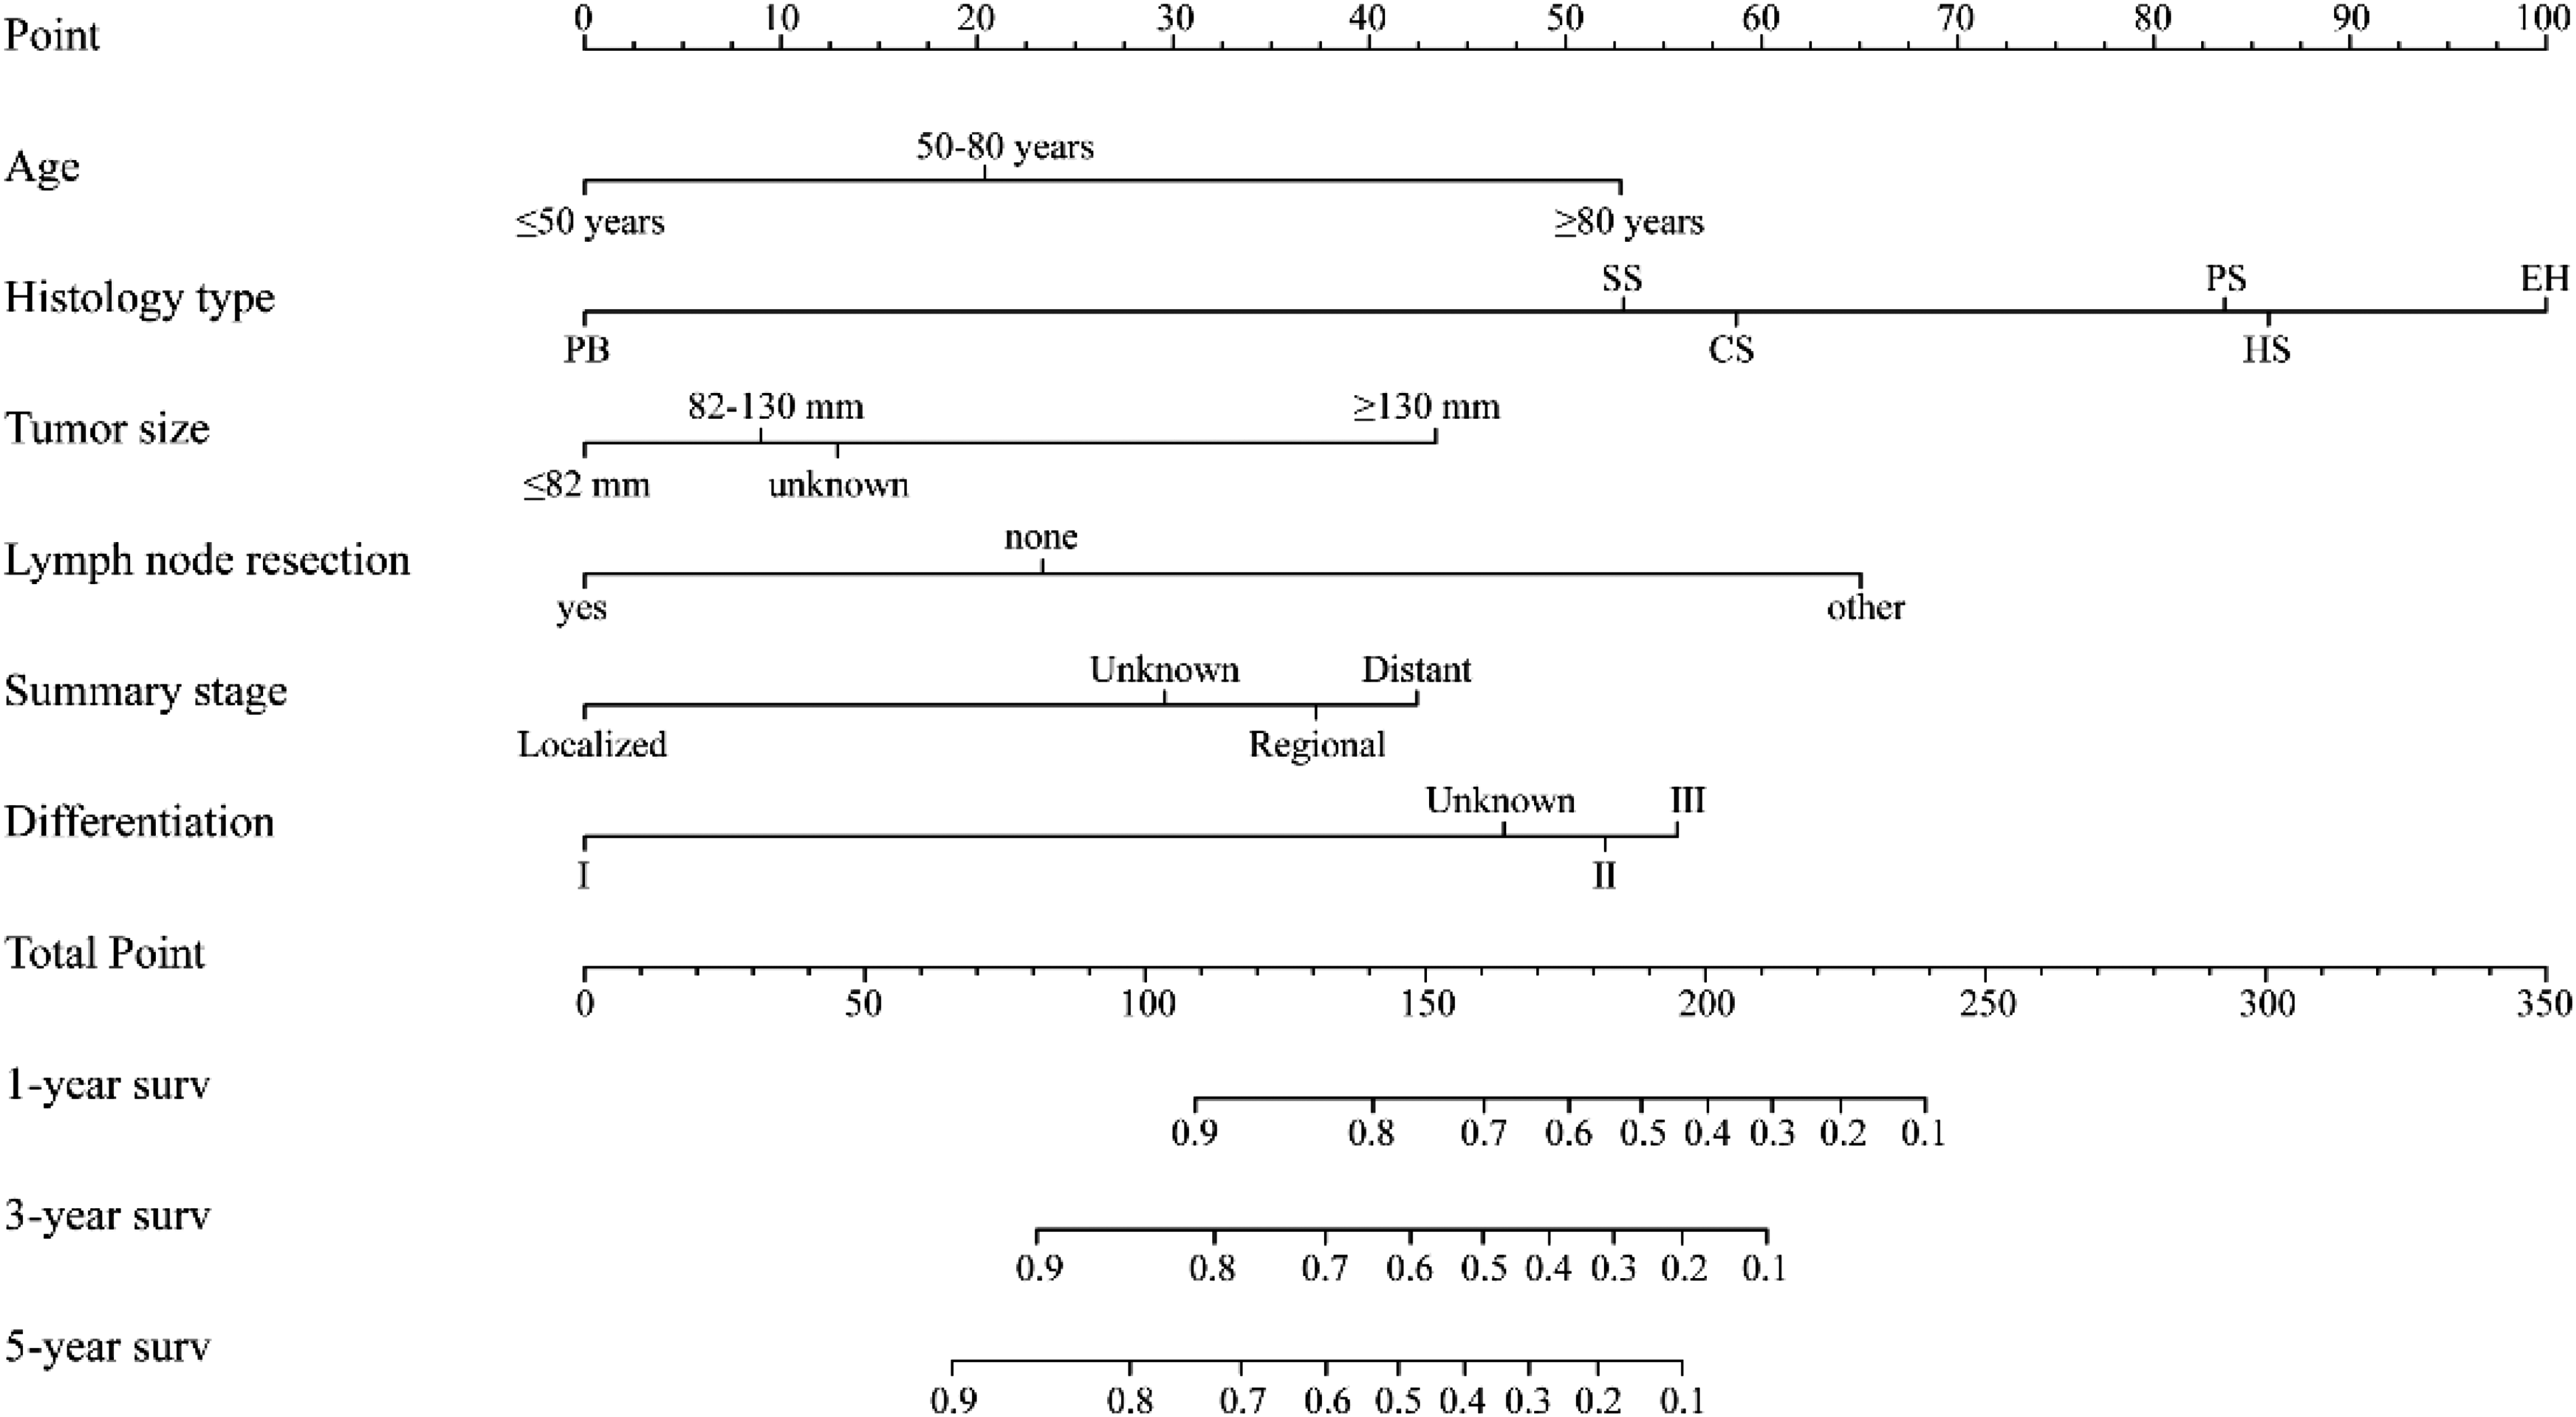
Nomogram pertinent to 1-year, 3-year, and 5-year overall survival (OS). PB: pleuropulmonary blastoma; EH: epithelioid hemangioendothelioma; HS: hemangiosarcoma; CS: chondroma; SS: monophasic/biphasic synovial sarcoma; PS: pulmonary artery/vein sarcoma. I: Well/Moderate, II: Poor, III: Undifferentiated.
Verification of Nomograph
The predictive power of nomogram was verified by the C-index and ROC curves. The C index of patient prognosis model in the training group and the validation group were 0.775 and 0.737 respectively. In the training group, the areas under the ROC curve of 1-year, 3-year and 5-year OS were 87.6 (95% CI:83.8-91.3), 90.1 (95% CI:86.2-94.0), 90.6 (95% CI:85.8-95.4). AUC values of 1-year, 3-year and 5-year OS in the validation group were 83.1 (95% CI: 75.8-90.5), 82.9 (95% CI: 73.2-92.7) and 87.0 (95% CI: 75.9-98.1) respectively (Figure 3a, 3b).
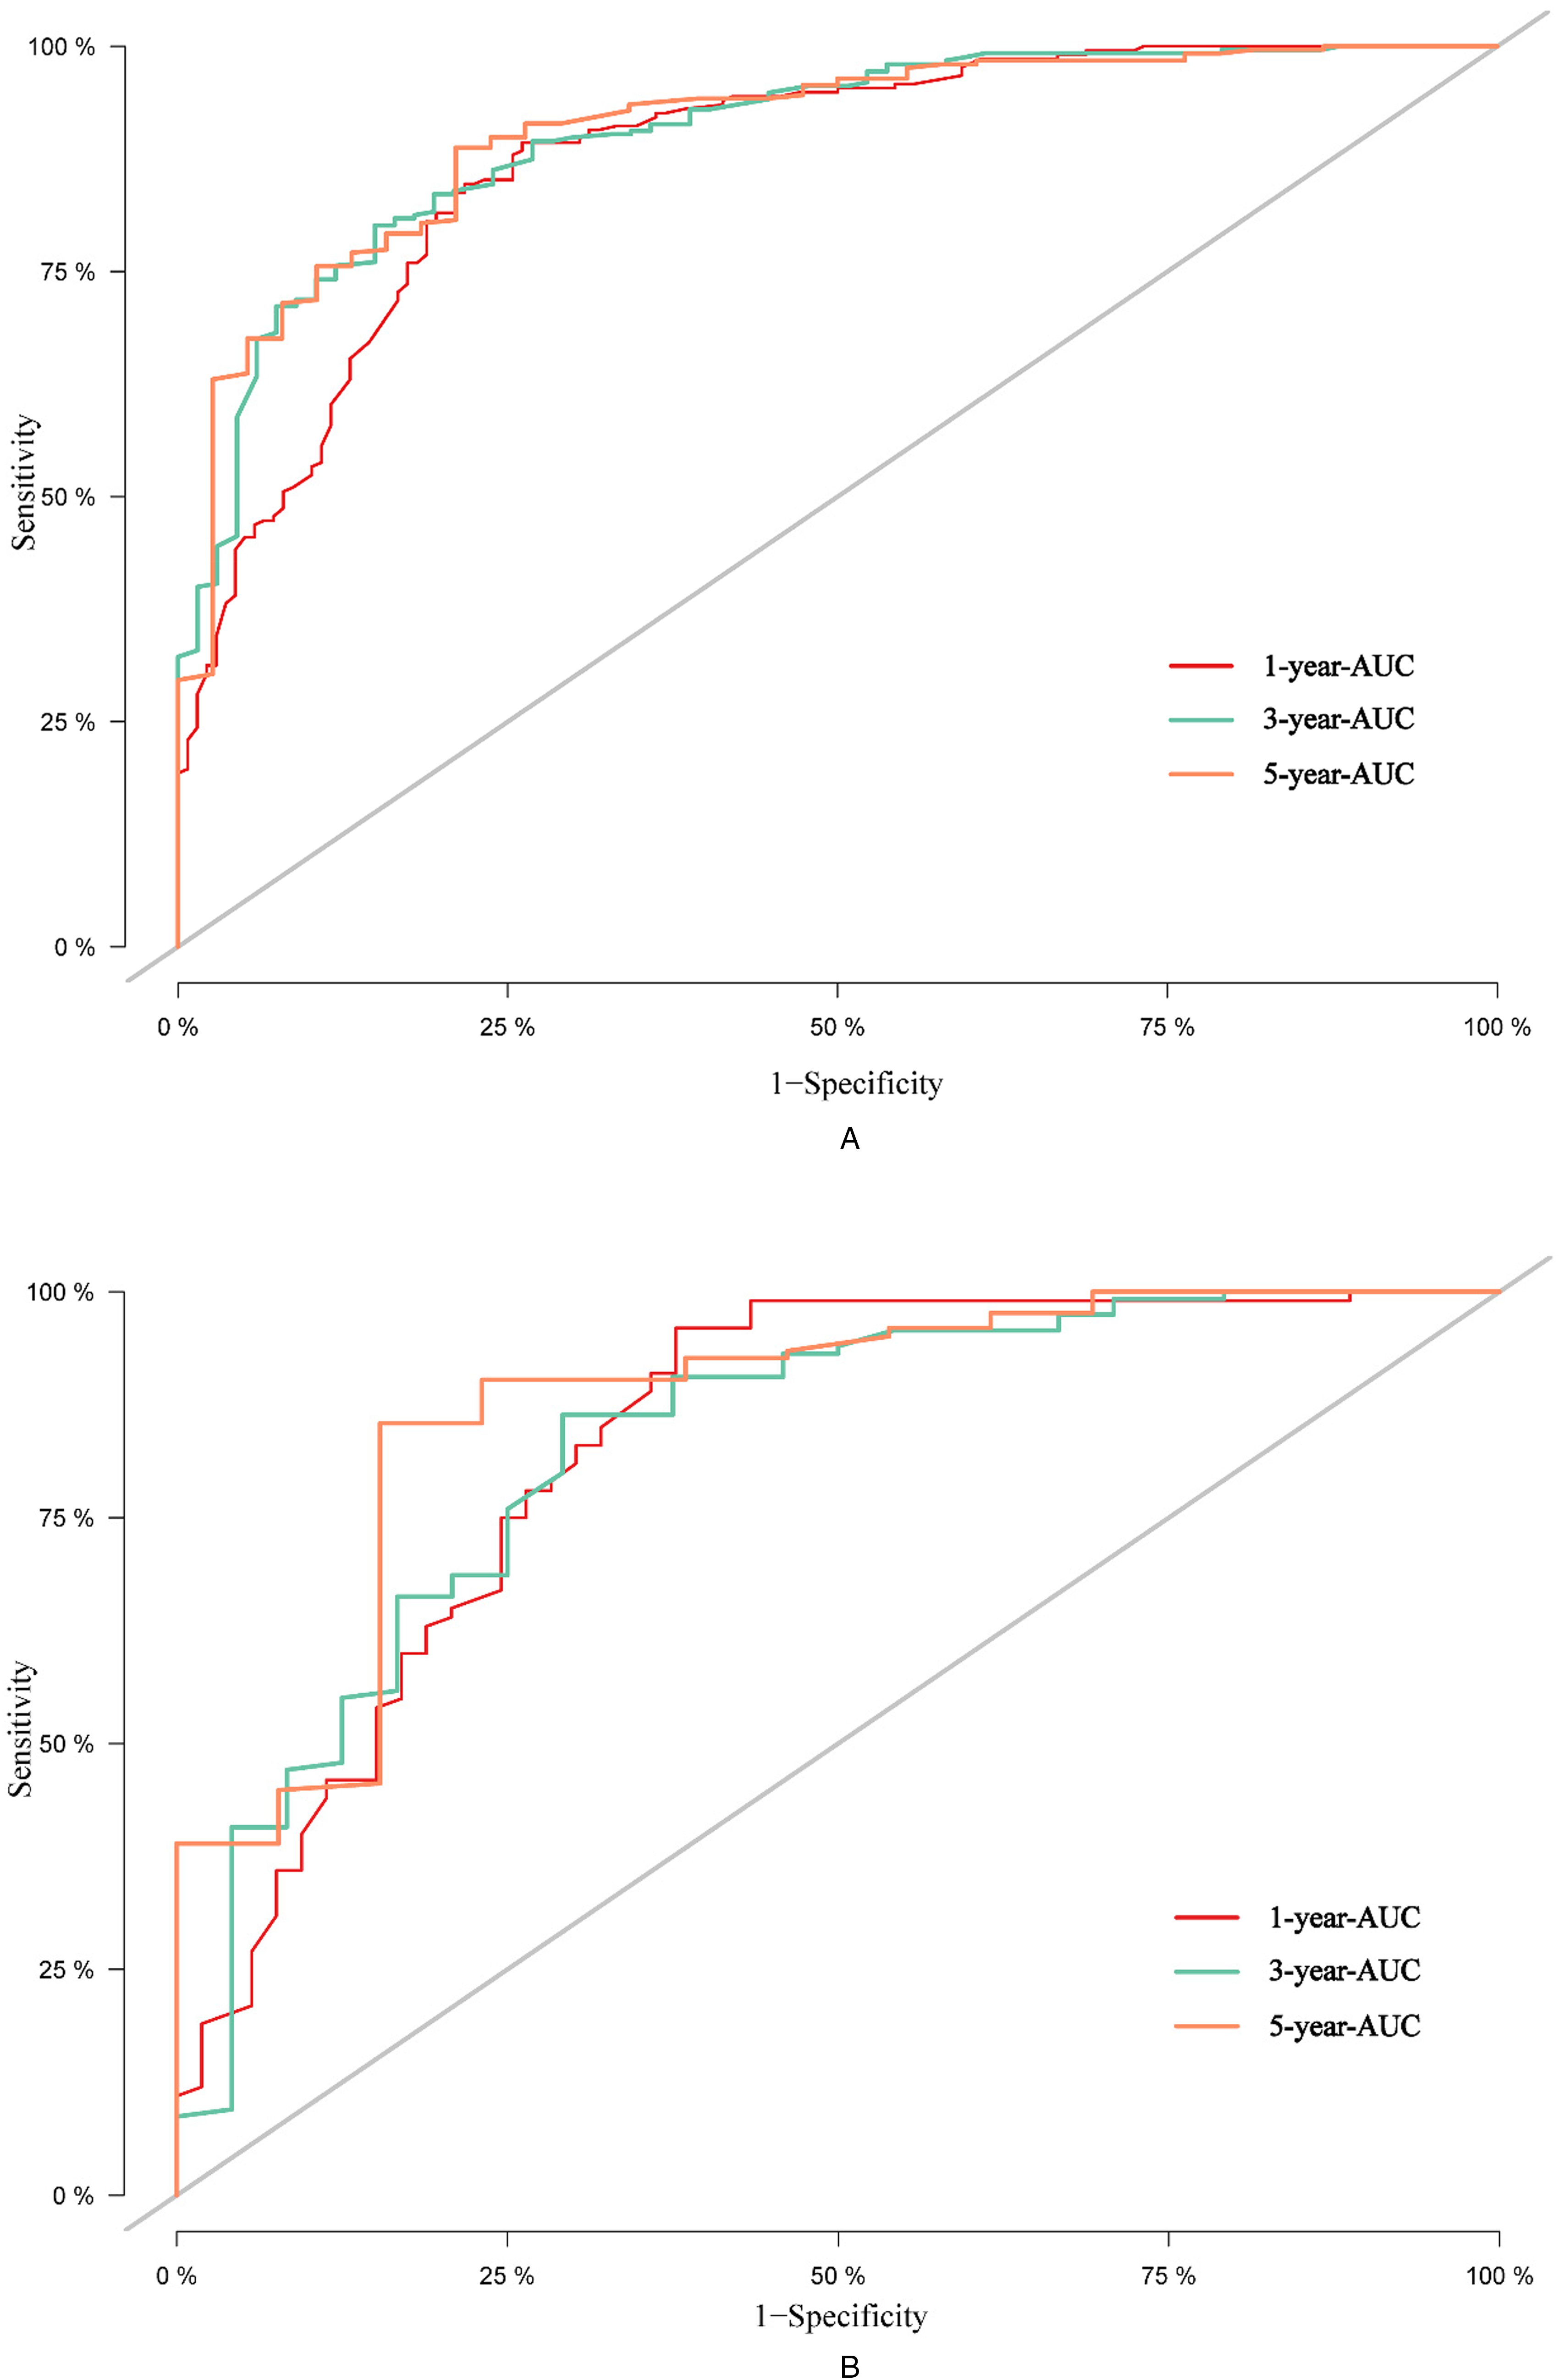
Receiver operating characteristic curve (ROC) and AUC values related to 1-year, 3-year, and 5-year OS in (A) training group and (B) validation group.
C index observed for both high risk and low risk groups was consistent with the AUC values, and concluded that the model exhibited higher prediction ability. The calibration curves were constructed for both training group and validation group in order to ascertain the predictive ability of nomogram (Figure 4a, 4b). They were the same as the actual prediction curves, indicating that the 1-year, 3-year, and 5-year OS predicted by nomogram was consistent with actual results, which indicated the accuracy of the model was relatively high.

Calibration curves depict 1-year, 3-year, and 5-year overall survival in (A) training group and (B) validation group.
Risk Stratification Based on Nomogram
A total nomogram score was determined for individual patients. Subsequently, the best cut-off score was found to be 193 points. Patients were segregated into high-risk group (≥193 points) and low-risk group (<193 points) based on the best cut-off value of prognostic risk score. Kaplan–Meier survival curve showed that the OS rate of the high-risk group in the training group was lesser when compared to low-risk group (P < .05). This was confirmed in the validation group in which the same cut-off value was used to distinguish high-risk group from low-risk group. These curves demonstrated that there was a strong positive correlation between low-risk scores and OS (P < .05), which further verified the discrimination of the model (
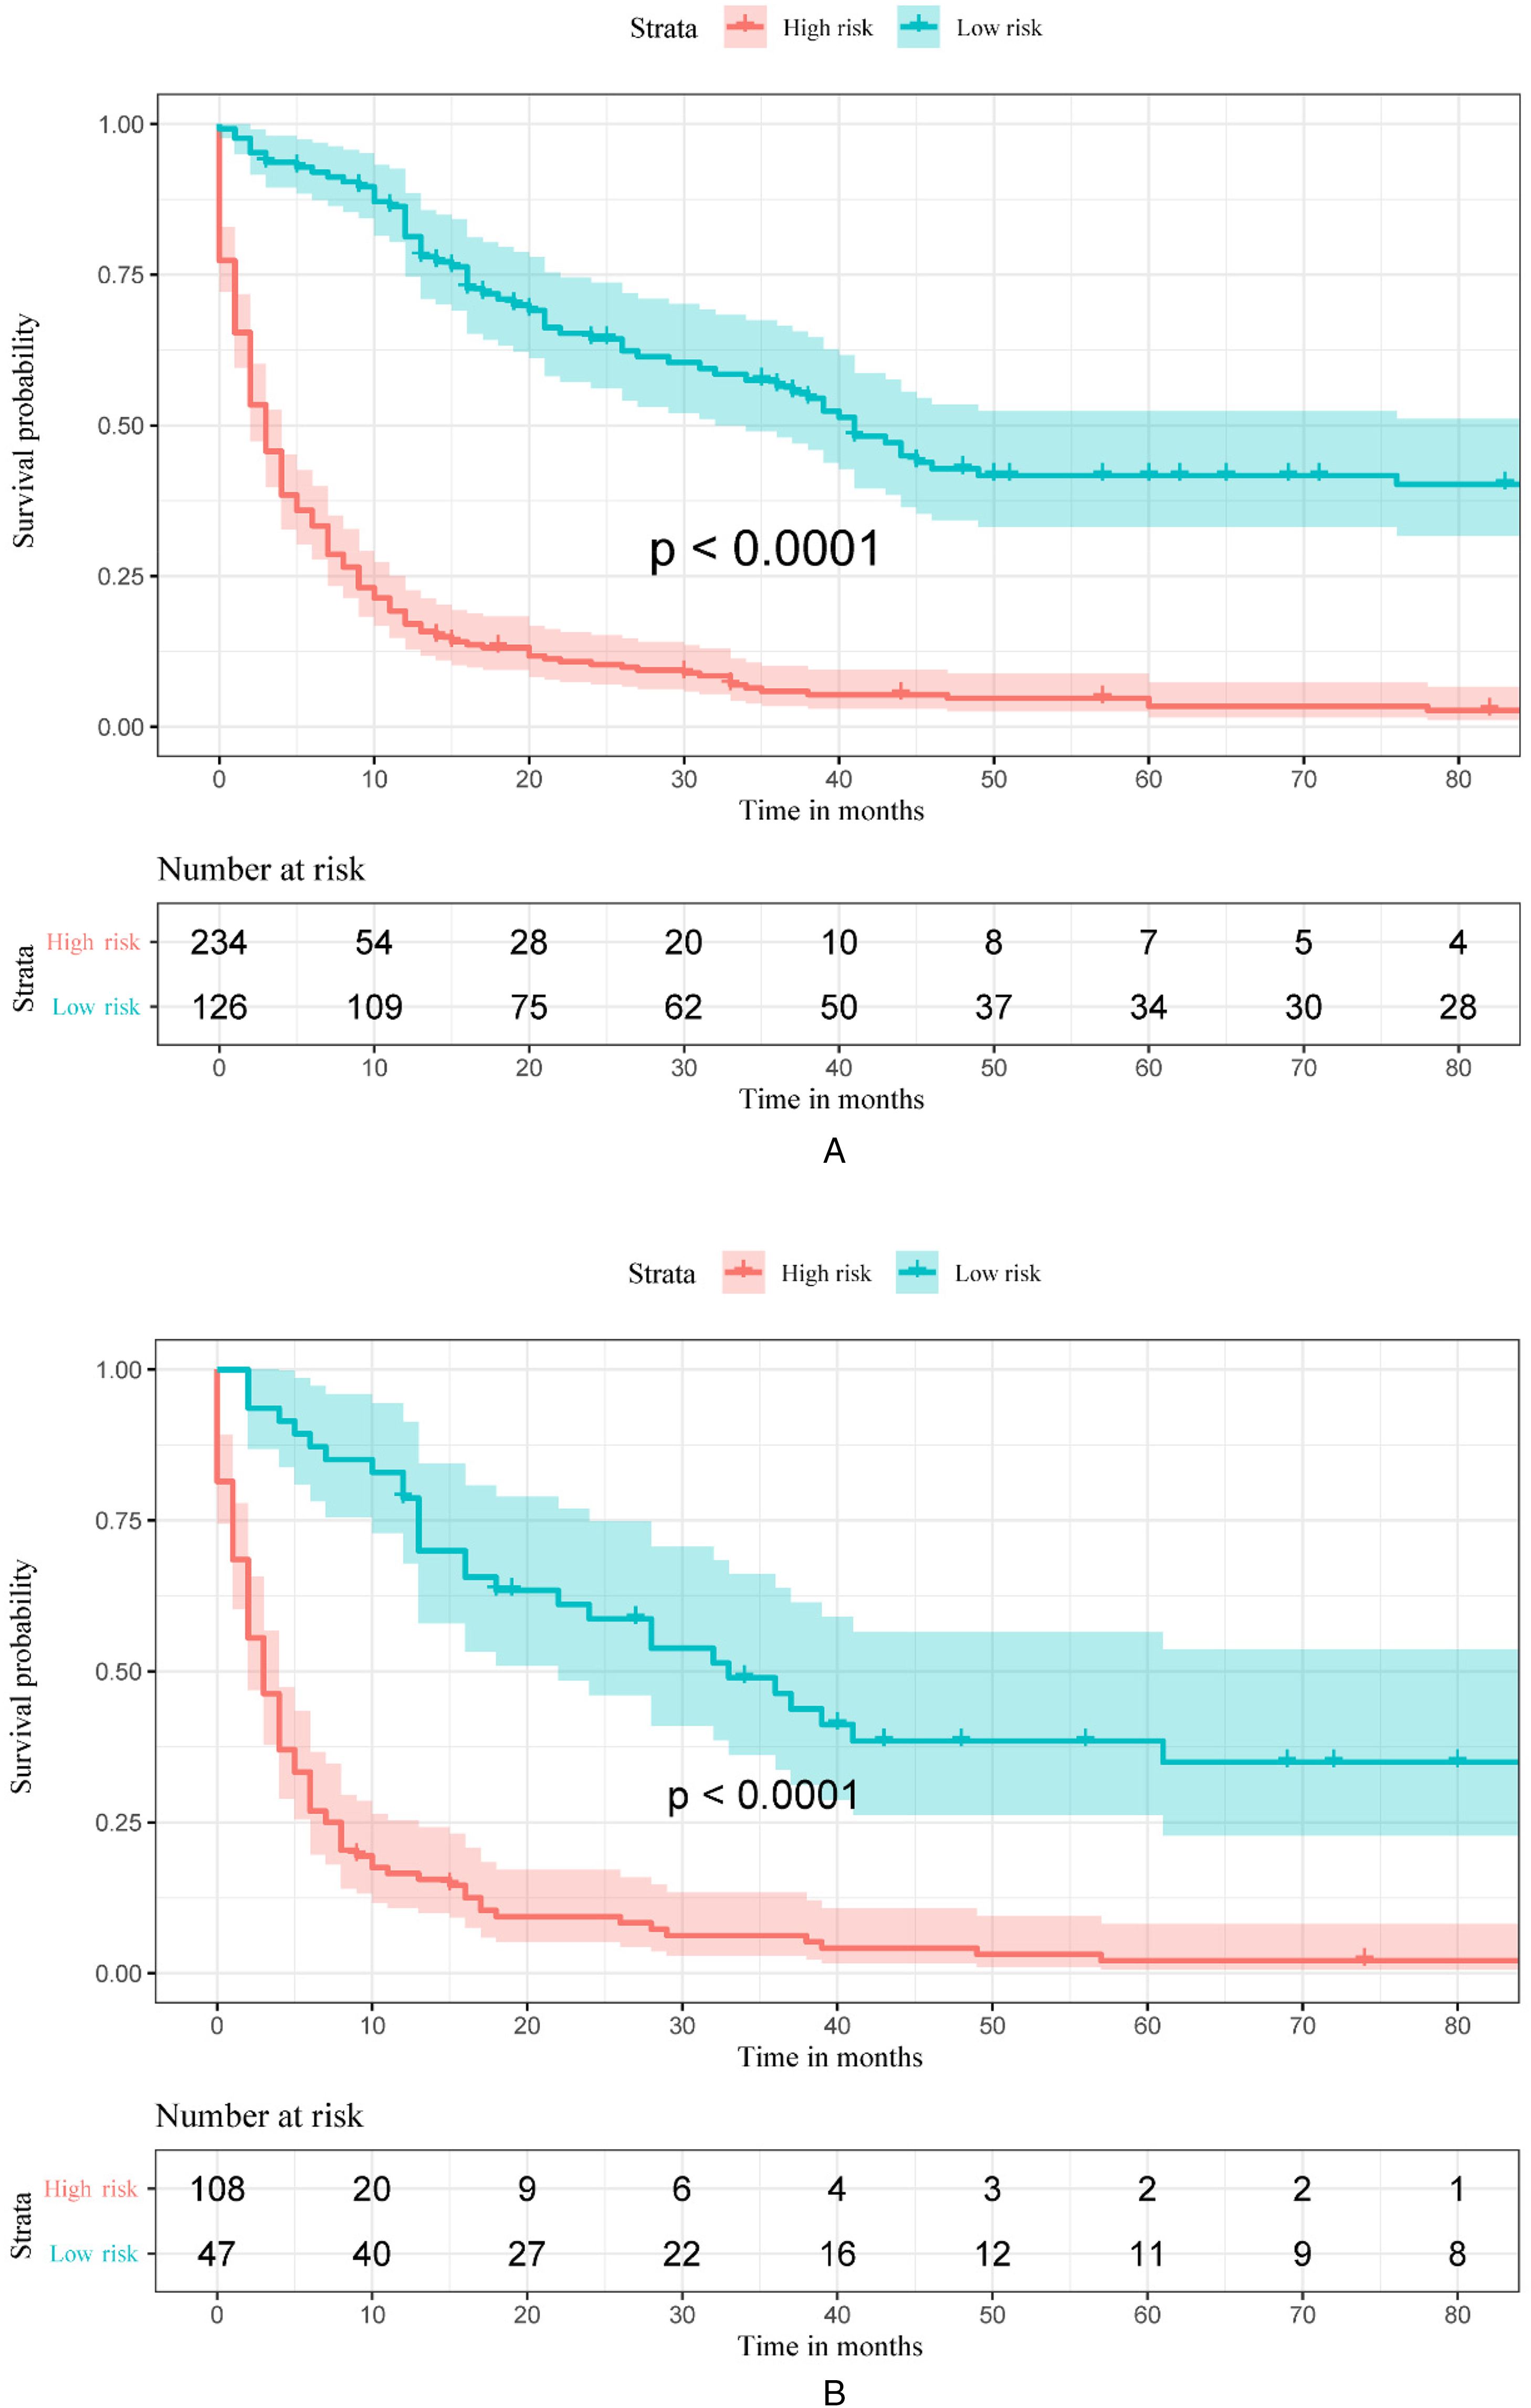
Kaplan–Meier curves depict overall survival (OS) in the patients diagnosed with PPS and differentiated into high-risk and low risk groups, respectively: (A) the training group, (B) validation group.
Role of Adjuvant Radiotherapy and Chemotherapy
Good OS was observed in the high risk group who were treated with adjuvant radiotherapy and adjuvant chemotherapy. Adjuvant radiotherapy was accompanied by the poor OS but the adjuvant chemotherapy was independent of OS in the low risk group (

Kaplan–Meier curves related to overall survival (OS) in different risk groups received different treatment regimens: (A) low risk patients with or without radiotherapy, (B) low risk patients with or without chemotherapy, (C) high risk patients with or without radiotherapy, and (D) high risk patients with or without chemotherapy.
Discussion
PPS is derived from lung mesenchymal tissue and is one of the significant pulmonary malignant tumors. 15 Currently, a minimal number of clinical studies are available related to PPS which mainly focus on the case reports and retrospective analyses. Heterogeneity of PPS is one of the major driving factors making oncologists or clinicians difficult to stratify the prognosis of patients with PPS. The current study was a large cohort study mainly based on the data related to 515 PPS patients in the SEER database. It is aimed to find out the independent prognostic factors affecting the OS of PPS patients and construct a nomogram that can individually evaluate the prognosis of PPS patients.
Our study reported that PPS was more common in the male patients aged 50 to 80 years, and its occurrence mostly could be observed in white individuals. Most of the tumors originating in the upper and lower lobes of the lung were unilateral with a diameter of ≤82 mm. For patients with known tumor differentiation, most tumors are poorly differentiated or undifferentiated. More than half of the patients did not receive surgery, lymph node dissection, adjuvant chemotherapy or radiotherapy. Analysis of the training group concluded that age, tumor size, summary stage and degree of differentiation were independent risk factors affecting the prognosis of PPS patients. However, lymph node dissection and histological types (synovial sarcoma, pleuropulmonary blastoma and chondroma) could improve the OS of PPS patients.
Six variables were selected and incorporated into the nomogram. C index, ROC curve and calibration curve were used to verify the performance and accuracy of nomogram. The results showed that nomogram exhibited good prediction ability and could be used as a reference standard for clinicians to assess the prognosis of patients with different PPS. In addition, we divided the patients into high-risk group and low-risk group, and the OS of the low-risk group was significantly higher than that of the high-risk group, which further verified the discriminative ability of the model. Adjuvant chemoradiotherapy was not an independent prognostic factor for PPS in this study, and there was no unified view on the effect of adjuvant chemoradiotherapy on PPS. Therefore, we performed a subgroup analysis of PPS patients. The results showed that radiation therapy was a risk factor for patients in the low-risk population, while adjuvant chemotherapy was not associated with OS. In high-risk groups, both radiotherapy and adjuvant chemotherapy could improve the prognosis of PPS patients.
Furthermore, most of the PPS patients were diagnosed during the age of 50 to 80 years, and age was an independent risk factor affecting the prognosis of PPS patients. White people were the highest in number in PPS patients, but ethnic differences were not related to the prognosis of PPS patients. These results were consistent with the previous literature. 16 A total of 60% PPS patients were males rather than females, but the difference in the incidence rate between the gender groups was not as obvious as that of lung cancer. 17 Gender was not associated with the prognosis of PPS in present study. However, men exhibited worse OS and PFS than women among the patients who underwent surgery. 7
Malignant fibrous histiocytoma, synovial sarcoma and smooth muscle sarcoma are the three most common histological types of PPS.18,19 However, the most common histological type of PPS among 515 patients was pulmonary artery/vein sarcoma, followed by angiosarcoma. This may be related to the polymorphism and heterogeneity of PPS in histology or the continuous changes of PPS classification standards in recent years. Although some studies have not typically shown the effect of the histological type of PPS on OS in the patients with PPS, our findings suggested that the patients with pathological types mainly related to synovial sarcoma and pleuropulmonary blastoma exhibited a better prognosis.20,21
Many studies have shown that the
PPS is advanced to the stage IV through local invasion and blood metastasis with few lymph node metastases. But, Regnard et aj.
19
described that 5 out of 20 resected patients reported with lymph node
The treatment strategy of PPS was similar to that of lung cancer. Complete resection with a clear edge could be considered as an important strategy of treatment.24,25 Early studies described that the survival rate of patients who could undergo complete surgical resection to treat PPS was significantly higher than that of the patients with positive surgical margin or inoperable surgery.17,23,31 These findings confirmed the results of improved survival in patients who can undergo resection. Gołota et al 25 examined the influence of surgical interventions on OS in the patients with PPS. According to these authors, when compared to the patients with non-anatomical surgery, the patients with anatomical complete resection exhibited lower 5-year OS (6% vs 83%), but were less prone to local recurrence. The high recurrence rate and increased lymph node metastasis rate in the patients undergoing non-anatomical complete resection reported that the metastasis ability of PPS could be similar to that of lung cancer. The scope and type of different surgical procedures affected the survival and recurrence of patients.
Surgical treatment can enhance clinical outcomes in the PPS patients, but the role of
In our study, neither radiotherapy nor chemotherapy was acting as an independent influencing factor of PPS. However, after stratification of PPS patients according to the degree of risk, we found that radiotherapy was a risk factor for low-risk population, but adjuvant chemotherapy has not conferred any influence on the patient's OS in low-risk group. In the high-risk population, the adjuvant radiotherapy or chemotherapy could significantly improve the prognosis of PPS patients. This is suggesting that we may choose the appropriate adjuvant treatment strategy based on the degree of risk in the patients. Unfortunately, we are unable to obtain specific chemotherapy drugs from SEER database, and the optimal chemotherapy needs further research. Risk stratification treatment can provide us with a new idea. According to different risk stratification, different treatment modalities can be adopted, including surgical tumor resection, radiotherapy and chemotherapy regimen. High risk group indicates that the tumor has worse biological behavior, which requires advanced surgical strategies and appropriate adjuvant treatment. Surgical treatment is the first choice for low-risk group, and adjuvant treatment is not recommended temporarily; further studies with larger groups of patients are needed to confirm these findings.
This was the first large-scale data obtained through the SEER database to construct nomogram for evaluating the prognosis of PPS patients. The nomogram contains more predictors and is more accurate than the traditional staging model when compared to the traditional TNM staging. Moreover, it is more convenient to evaluate the individual prognosis by using nomogram due to existing clinical data. There are also some limitations for our current study. First, it was a single center retrospective analysis, which may lead to selection bias. Second, this study was limited by the incomplete information of the SEER database and lacking covariate information such as smoking history, positive or negative surgical margin, clinical symptoms, laboratory examination, and specific radiotherapy technology. Third, the bootstrap self sampling method was used for internal verification, and there was a lack of external verification data.
Conclusion
This study concluded the prognostic factors affecting the OS of PPS patients, subsequently constructed and validated the nomogram; this nomogram could provide a practical, convenient and reliable tool for PPS patients to evaluate the prognosis consequently to choose personalized oncomedicine. Radiotherapy or chemotherapy was not recommended for the low-risk individuals, but the individuals at high risk could benefit from adjuvant chemotherapy or radiotherapy.
Footnotes
Abbreviations
Author Contributions
Hao Gu (HG), Ruixia Song (RS), Narasimha M. Beeraka (NMB), Tingxuan Li (TL), Di Zhao (DZ), Junqi Liu (JL), Ruitai Fan (RF) has conceptualized and collected the literature. HG, NMB, RS, TL performed literature search and developed the manuscript. NMB, JL, RF proof-read the manuscript. All authors have reviewed and approved the manuscript before submission.
Declaration of Conflicting Interests
The author(s) declared no potential conflicts of interest with respect to the research, authorship, and/or publication of this article.
Funding
The author(s) disclosed receipt of the following financial support for the research, authorship, and/or publication of this article: The Natural Science Foundation of Henan Province, (grant number 202300410453).
Informed Consent
Informed consent is not required and not relevant to this study.
Ethics Approval
Data collection was performed from the SEER database; the data acquired from this database was approved by the local ethical committee for analysis. Hence, our study has not required any ethical approval statement.
Consent for Publication
NA.
Correction (May 2023):
Article updated to link authors who contributed equally with contribution statement.