
Abstract
Introduction
Despite decades of advancements in surgery, systemic therapies, and radiation therapy, cancer remains a leading cause of morbidity and death due to largely resistance to standard therapies caused by metastasis and recurrence. Alternative modalities are therefore being investigated to enhance the safety and efficacy of anti-cancer therapies. One innovative approach has been the clinical application of electrical fields, such as the healing of wounds and bone injuries, electrochemotherapy, and treatment of brain cancer.1–5 The efficacy of using alternating electrical fields delivered by the Optune device (Novocure) to treat primary brain tumors has surpassed most expectations. In several phase III clinical trials, this treatment has been shown to inhibit brain tumor growth with effectiveness similar to standard chemotherapy and is now a FDA approved treatment.6–9
The success of the Optune device provides proof of the concept that cancer growth can be abrogated or reduced by electrical fields in a clinically significant manner. Therefore, it follows that other electric currents induced by magnetic flux can also potentially inhibit cancer cell growth. However, published data indicate a mixed response.
Most studies demonstrate an inhibitory effect of pulsed electromagnetic field (PEMF) on a variety of cancer types. Crocetti et al showed that PEMF (20 Hz, 3 mT, 60 min/day × 3 days) increased cell death in MCF-7 breast cancer by 10% to 15%, but not normal breast stromal cells. 10 Vincenzi et al used PEMF (75 Hz, pulse duration of 1.3 ms, 1.5 ± 0.2 mT, induced voltage 2.0 ± 0.5 mV) to cause cell death in pheochromocytoma PC12 and glioblastoma U-87 MG tumor cells. 11 Many other in vitro studies reported similar anti-neoplastic effects of extremely low to ultralow frequency PEMF on ovarian, 12 lymphoma, 13 breast, 14 and colon cancer cells.15, 16 Additional evidence that PEMF weakens cancer cells is suggested by studies revealing that PEMF synergistically enhances the potency of chemotherapy agents such as doxorubicin, 17 vincristine, 18 mitomycin C, 18 cisplatin, 18 and actinomycin. 19 The mechanism(s) underlying these observations remain unclear.
In contrast, other studies have shown that PEMF has no effect or can actually promote tumor growth. The work of Leman et al demonstrated that PEMF (2 Hz, 0.3 mT) did not change the proliferation or invasive ability of MDA-MB-435, MDA-MB-231, and MCF-7 breast cancer cells in vitro. 20 De Mattei's study alternatively indicated that PEMF (75 Hz, 2.3 mT, 1.3 ms pulse duration, 10 min to 24 h treatment time) can increase proliferation of TE-85 and MG-63 osteosarcoma cell lines. 21 Lastly, Loja et al showed that PEMF (125 and 625 Hz, 5 mT, 24-48 h) increased proliferation in colorectal cancer COLO-320DM and breast cancer ZR-75-1 cells. Interestingly, there was no effect when using 15 Hz PEMF on CEM/C2 acute lymphoblastic leukemia, SU-DHL-4 B-cell lymphoma, and MDA-BM-468 breast adenocarcinoma cell lines. 22
These published studies reveal that the effects of PEMF on cancer cells vary widely. One possible reason for these differing observations is the heterogeneity of the PEMF being examined. To date, there is very little consistency in the employed frequency of the PEMF signals ranging from 2 to 625 Hz. Additionally, the variability of the results occurs due to differing experimental conditions such as the strength of the magnetic field or induced electrical field, pulse duration, slew rate, duration of exposure, and the cancer type being studied.
The present study investigates the effects of clinically utilized osteogenic PEMF signals on cancer cells. Osteogenic PEMF has been used to promote bone healing in the laboratory and in clinical settings.23–25 Counterintuitively, osteogenic PEMF potentially has inhibitory effects on cancer cells as well. The basis for this hypothesis is that osteogenic PEMF occupies a frequency band (kHz) that is very closer to that of tumor treating fields created by the Optune device (300 kHz). To our knowledge, no previous studies have examined how osteogenic PEMF in this frequency range affects cancer cells. Possible effects include direct cytotoxicity or modulation of drug uptake resulting in changes in chemosensitivity, both of which have been seen with other PEMF signals. We thus hypothesized that osteogenic PEMF would alter the proliferation or chemosensitivity of cancer cells. Indeed, our data show osteogenic PEMF induced apoptosis and gene expression changes that modestly inhibited breast and lung cancer cell growth both in vitro and in vivo.
Materials and Methods
Cell Lines
Breast cancer cell line MCF7 and lung cancer cell line A549 were selected based on the high prevalence of breast and lung cancer in humans, as well as reported studies demonstrating the response to similar electromagnetic fields.10, 26 They were both (MCF-7, ATCC® HTB-22™ and A549, ATCC, CCL-185) purchased from the American Type Culture Collection (ATCC). MCF-7 cells were grown in EMEM medium (ATCC® 30-2003) supplied with 10% fetal bovine serum (FBS) (Omega Scientific, FB-04), 1% penicillin/streptomycin (Gibico, 15240-062) and 0.01 mg/mL insulin (Santa Cruz, sc-360248). A549 cells were grown in F-12K medium (Corning, 100025-CV) containing 10% FBS (Omega Scientific, FB-04) and 1% penicillin/streptomycin (Gibico, 15240-062). MCF-7 and A549 expressing the luciferase gene were generated (MCF-7/luc and A549/luc, respectively) by transfecting cells with pGL4.20 plasmids (Promega, E675A) using Lipofectamine 2000 per manufacturer's instruction (Invitrogen, 11668019), followed by G418 (Santa Cruz, sc-29065A) selection for 3 weeks and sequential verification using bioluminescence imaging with the presence of D-luciferin (Thermofisher Scientific, L2916). For in vitro experiments, A549 cells were seeded in 12-well plates at 8.0 × 10³ cells/well; MCF-7 cells were seeded in 12-well plates at 2.0 × 10⁴ cells/well unless otherwise noted. Cell density correspondingly varied according to the culture area of plates or dishes based on the cell number on the 12-well plate. Each experiment was conducted at least in triplicate. Cells were incubated under humidified conditions in a 5% CO2 and 37 °C tissue culture incubator.
Chemotherapy Drugs
Cisplatin and pemetrexed are 2 commonly used chemotherapy drugs against breast and lung cancers. Both drugs rely on membrane transport mechanisms that are hypothetically disrupted by electrical field changes. Based on clinical practice, cisplatin was only used for the treatment of A549 cells and pemetrexed was only used for the treatment of MCF-7 cells. Cisplatin (479306) was obtained from Millipore Sigma. Pemetrexed (100710) was purchased from Medkoo Bioscience. Both cisplatin and pemetrexed were dissolved in DMSO (cat#: D2650, Sigma) for in vitro experiments and in 0.9% sodium chloride irrigation USP (Braun Medical, R5201-011) for the in vivo experiments. They were freshly prepared before each experiment. To determine the concentration of cisplatin and pemetrexed used for treating tumor cells in combination with PEMF, a series of concentrations of cisplatin (0, 4 µM, 8 µM, 16 µM, 32 µM, 64 µM, 96 µM) and pemetrexed (0, 6.4 nM, 32 nM, 160 nM, 0.8 µM, 4 µM, 20 µM, 100 µM, 500 µM) were tested on A549 and MCF-7 cells using ATP or MTT assays, respectively, then the dose-response curves were generated (Figure S1). Based on the dose-response curves, we selected the doses at 4 and 8 µM for cisplatin (A549), 5 nM and 50 µM for pemetrexed (MCF-7), which caused minor (∼20%) or moderate (∼50%) cell death of A549 and MCF-7, respectively. Negligible cell death was represented by negative controls. We chose not to induce major cell death because synergistic or additive effect of PEMF would be difficult to detect.
PEMF Settings and In Vitro Treatments
Cells were seeded in 12- or 6-well plates or a 60 mm dish for 18 h prior to PEMF treatments. Two settings of PEMF were used in our experiments, defined as PMF1 and PMF2. PMF1 has an amplitude of 0.68 mT and a pulsed frequency of 3.846 kHz, that is similar to the FDA approved signal of Spinal-Stim®, Orthofix Medical Inc. (Lewisville, TX). PMF2 has an amplitude of 1.19 mT and a pulse frequency of 40.85 kHz, a variation of the FDA approved signal of Physio-Stim®, Orthofix Inc. (Lewisville, TX). The 2 signals were generated by the custom-made PEMF exposure systems. The amplitude and frequency of both signals were regularly checked and verified throughout the experiments. The homogeneity of the field for both signals used in the in vitro and in vivo systems was verified and maintained throughout the experiments. The in vitro PEMF device setting is illustrated in Figure S2A. Cells were treated with PMF1 or PMF2 daily at an exposure duration of 0, 4, 6, 8, or 24 h (as indicated in designed experiments design) alone or in combination with chemotherapy drugs including cisplatin (4.0 or 8.0 µM) or pemetrexed (5.0 nM, or 50.0 µM) as well as corresponding treatment controls for 3 or 5 days, followed by various assays as described in Material and Methods. Controls are vehicle (DMSO) and media only.
Immunocytochemistry Staining
Cell preparation: MCF-7 cells were seeded at a density of 2.0 × 10⁴ cells/well on cover slips in a 12-well plate and incubated overnight then, treated with PEMF (PMF1 and PMF2) alone or in combination with pemetrexed at 5.0 nM and 50.0 µM, or non-PEMF control for 4, 6, 8, or 24 h, control non-PEMF treatment is labelled as 0 h. After treatment, coverslips were gently removed from plate wells and washed with PBS before staining.
Cell staining and imaging: To detect the changes in autophagic activity of treated MCF-7 cells, partial cells were stained with primary antibody marker LC3 (D11) XP® Rabit (1:500) (Cell Signaling, 3868), followed by secondary antibody Alexa Fluor® 488 (Thermofisher Scientific, A11001), partial cells were stained with Acridine Orange (Millipore Sigma, A6014) at a final concentration of 5.0 µM. Autophagy staining and detection using Acridine Orange as well as western blot were performed as previously described. 27 To investigate the distribution change of Tubulin and Actin in treated MCF-7 cells, partial cells were stained with CellLight™ Tubulin-GFP BacMam 2.0 (Thermofisher Scientific, C10508) at 1:200 dilution. Partial cells were stained with Alexa Fluor® 568 phalloidin (Thermofisher Scientific, A12380) at 1:200 dilution. Finally, stained cells were coated with Prolong® Diamond Antifade mounting medium with DAPI (Thermofisher Scientific, P36962) and images were randomly captured via fluorescence microscopy. Marker LC3 (D11) XP® Rabit (3868) was purchased from Cell Signaling Technology. Prolong® Diamond Antifade mounting medium with DAPI (P36965), CellLight™ Tubulin-GFP BacMam 2.0 (C10613) Alexa Fluor® 488, and Alexa Fluor® 568 phalloidin (A12380) were purchased from Thermo Fisher Scientific.
Cell Viability Assay
MTT assay: Cells were incubated in their respective culture medium containing 0.5 mg/mL MTT reagent (Millipore Sigma, M5655) for 1 h until the purple precipitate was visible. DMSO was added to each well and incubated at room temperature in the dark for 10 min. The absorbance of the developed color was recorded at 570 nm using Spectra Max® M3 multi-mode microplate reader (Molecular Devices).
ATP cell viability assay: A549 cells were seeded in 96-well plates at a density of 3.0 × 10³ cells/well prior to the treatment with cisplatin at varying concentrations. After 2-day treatment, we employed the kit of Cell Titer-Glo® 2.0 Cell Viability Assay (Promega, G9241) to assess cell viability according to the manufacture instructions.
Apoptosis Assessment
To assess the effects of PEMF treatment on cell apoptosis, we used the Caspase-Glo® 3/7 Assay (Promega, G8092) per manufacturer's instructions. Luminescence was measured using a microplate reader (DTX880 multimode detector, Beckman Coulter). We also assessed it with Annexin V–FITC Apoptosis Detection Kit from Abcam (14085) following the manufacturer's instructions. Percentages of apoptotic cells were measured by flow cytometry using a Beckman Coulter Cyan™ ADP (Franklin Lakes,) at City of Hope's analytical cytometry core. Cell preparation is described in the PEMF settings and the in vitro treatments sections.
Cell Cycle Analysis
Cell cycle analysis was performed using Propidium Iodide Flow Cytometry Kit (Abcam, ab139418) and a CyAn™ ADP flow cytometry instrument at City of Hope's analytical cytometry core. Cell preparation is described in the PEMF settings and the in vitro treatments section.
Cell Membrane Permeability Examination
MCF-7 cells were plated at a density of 1.0 × 10⁵ cells/well in 12-well plates containing a coverslip overnight. After pemetrexed was added, plates were continually exposed to PMF1 for 2 h or 12 h/day for 3 days. On day 3, cells were incubated for 2 h in 100 µg/mL Lucifer Yellow solution (Millipore Sigma, L259). After washing with PBS, Hochest solution (Cat#: 62249, Thermosisher Scientific, 62249) was added. Lucifer yellow fluorescence was examined using a 485 nm excitation and 530 nm emission filters. Hoechst staining was detected at 350 nm. Ten images were randomly captured per slides via fluorescence microscopy (Zeiss, Confocal LSM 880) at City of Hope.
Reverse Transcription and Quantitative PCR (qRT-PCR)
Cell growth, division, and proliferation related gene alterations were assessed by qRT-PCR. Briefly, total RNA was extracted from cells using Trizol Reagent (Thermofisher Scientific,15596018). 2.0 µg of total RNA was used for reverse transcription using Maxima First Strand cDNA Synthesis Kit (Thermofisher Scientific, K1672), followed by qRT-PCR in a master mix containing SYBR green supermix (Bio-Rad, Inc,1708884) and primers (Table 1). The reaction was conducted using CFX96 TM Real-Time system (Bio-Rad, Inc) under the following conditions: 3 min at 95 oC, followed by 40 cycles of 95 oC for 10 s and 60 oC for 40 s. Expression fold change was calculated with the standard 2−ΔΔCt formula. GAPDH was used as an internal loading control.
Primers List for qRT-PCR.

Generating Tumor-Bearing Mice Models
A549/luc tumor-bearing mice were generated by implanting 100 µL of 1.5 × 10⁶ A549/Luc cells into 6 to 8-week-old NOD/SCID/IL-2Rγnull (NSG) mice subcutaneously on their left flank. After 3 weeks, mice bearing tumors were evenly grouped based on tumor size (average of ∼40 mm3) before PEMF treatment. To generate MCF-7/luc tumor bearing mice, NSG mice were first implanted with E2 pellets (90-day release, 0.72 mg/pellet, Innovative Research of America, NE-121) on the lateral side of the neck. Four days later, 100 µL of 4.0 × 10⁶ MCF-7/luc cells mixed in 40% matrigel (BD,356234) were implanted into the mammary fat pad of 6 to 8-week-old female NSG mice. After 2 weeks, mice bearing tumors were grouped based on tumor size (average of ∼50 mm3) prior PEMF treatment.
In Vivo PEMF Treatments
Eight mice in each group were treated to assess the effect of PEMF on tumor growth inhibition. Two PEMF perimeters are the same as used for in vitro settings: PMF1 and PMF2. Mice bearing A549/Luc or MCF-7/Luc tumors (housed in cages without metal racks and tag holders) were placed in the PEMF device shelf (as illustrated in Figure S2B) for 12 h of PEMF exposure alone or in combination with chemotherapy drugs including cisplatin (1.0 or 3.0 mg/kg) and pemetrexed (50.0 or 150.0 mg/kg) as well as the carrier (0.9% Sodium Chloride Irrigation USP) administered intraperitoneally twice a week for 4 weeks. The doses of cisplatin and pemetrexed were determined by our pilot experiments (Figure S1D and E). DietGel and HydroGels were supplied during the PEMF-treatment period.
PEMF signals were checked routinely every week for accuracy. Tumor dimensions were measured weekly using a perpendicular caliper. Tumor volumes were calculated using the formula V = (a × b2)/2, in which “a” is the longest and “b” is the shortest diameter of the tumor. At the end of the experiment, bioluminescence images were captured using the Xenogen In Vivo Imaging System (Xenogen) before mice were euthanized via the inhalation of CO2. Tumor tissues were collected for further analysis. This study was carried out in strict accordance with the recommendations in the Guide for the Care and Use of Laboratory Animals of the National Institutes of Health. 28 The protocol was approved by the Committee on the Ethics of Animal Experiments of City of Hope (Protocol Number: 14032). The reporting of this study conforms to ARRIVE 2.0 guidelines. 29 All surgery (implantation of E2 pellets) was performed under Ketamine/Xylazine anesthesia (Ketamine 90-150 mg/kg and Xylazine 7.5-16 mg/kg), and all efforts were made to minimize suffering.
Statistics
Quantitative data were presented as the mean ± standard error of mean (SEM) or standard deviation (STDEV). For tumor growth, stochastic dependencies in longitudinal data were addressed by reducing the data to one number per mouse, focusing on the week 4 data, expressed as percentage growth from baseline. Other weeks were treated in the same way for certain supportive claims where multiple comparisons were not an issue (such as the 2 forms of PEMF being similar within the margin of error at all-time points). We used ANOVA with post-hoc testing among groups of 3 or more or Student's T-test with 2 groups (GraphPad Prism 7.0, GraphPad Software). Analytical methods were validated by the biostatistics core at City of Hope.
Results
PEMF Moderately Suppressed Cancer Cell Growth in Selected Breast and Lung Cancer Cell Line Models
To test PEMF's cell growth inhibition effect, we used MTT assay and examined the changes of cell viabilities of MCF7 and A549 cells untreated, treated with PEMF alone or in combination with chemotherapy drugs (Figure 1). Our data shown cell viabilities of cancer cell line A549 were slightly decreased after exposing to PEMF for 4 to 24 h (Figure 1A and B). When cells were exposed to PEMF while incubating with chemotherapy drugs, their viabilities were significantly decreased, with the strongest effect shown for MCF 7 cells treated with 50 µM of pemetrexed even at 4 h regardless of PEMF settings (Figure 1C and D). It seems PMF2 is better for both cell lines (Figure 1B and D).
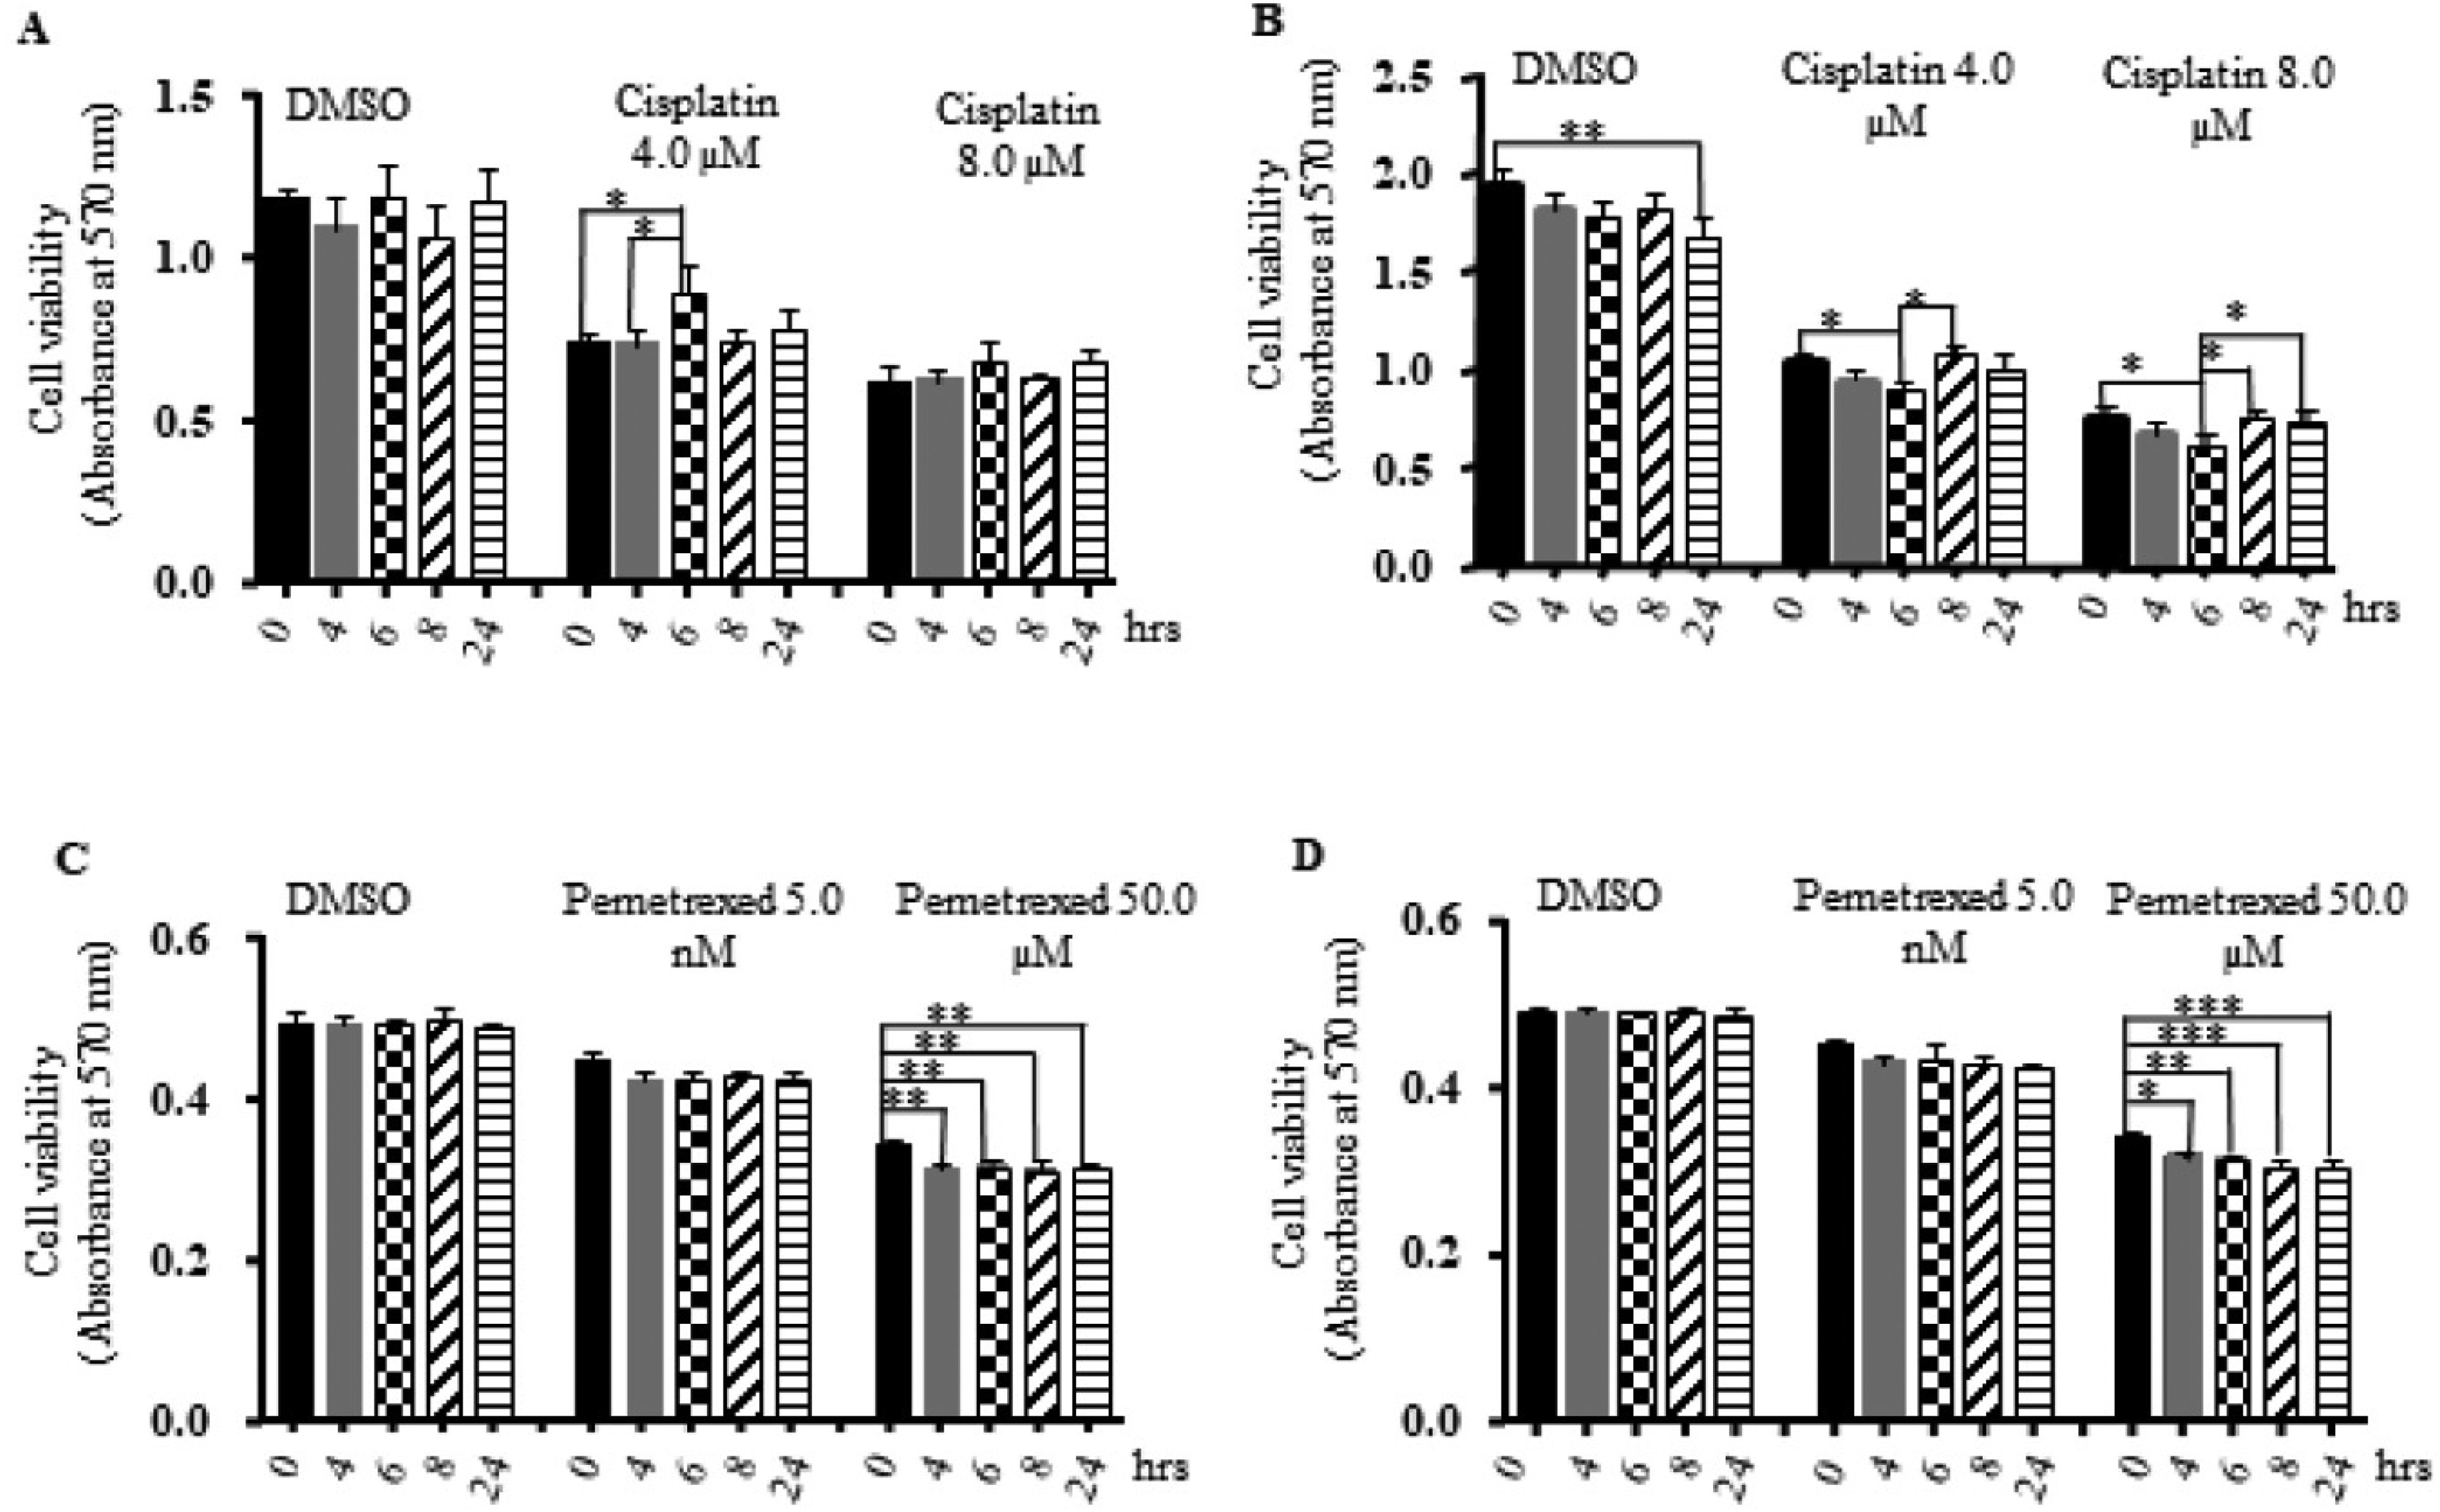
Cell viabilities of MCF 7 and A549 cells untreated or treated with PEMF alone or in combination with chemotherapy drugs. Cells were incubated for 3 days with either DMSO, cisplatin 4 µM, cisplatin 8 µM, pemetrexed 5 nM, or pemetrexed 50 µM. PEMF was applied daily for indicated duration. (A) A549 treated with PMF1; (B) A549 treated with PMF2; (C) MCF7 treated with PMF1; (D) MCF 7 treated with PMF2. Each treatment has at least 3 replicates. “*” P < .05, “**” P < .01, and “***” P < .001.
When the data shown in Figure 1 was summarized in Tables S1 and S2 respectively, we found that Osteogenic PEMF inhibited growth compared to controls in 16 out of 60 experimental conditions. Generally, the magnitude of the inhibition was small, even with statistical significance (P < .5). To gain a sense of the overall effect, all results were grouped together by PEMF type, regardless of other variables such as duration of exposure or dose of chemotherapeutic agent.
PMF1 and PMF2 respectively caused a −3.7 ± 0.7% and −5.8 ± 0.4% decrease in cell viability compared to controls. Post-hoc analysis indicates that PMF1, PMF2, and controls were all significantly different from one another (P < .01).
While overall PEMF suppressed A549 cell growth in vitro, the effect of each dose, as measured by duration of daily PEMF exposure, was less clear. When the data was solely grouped by the duration of exposure, the only significant comparison, exclusive of those involving negative controls, was seen in cells treated for 4 h (−3.3 ± 0.6%) versus 8 h (−6.2 ± 0.7%) (P = .03). Further sub-analysis based on PEMF type yielded unremarkable differences.
Collectively, the effect of PEMF on breast cancer MCF-7 cells (−5.2 ± 0.3%) was marginally more (P = .34) than on lung cancer A549 cells (−4.4 ± 0.6%). The maximum amount of inhibition in A549 experiments was 25.99 ± 4.85% on day 1 with 24 h/day of PMF1 and 4.0 µM cisplatin (Table S1). The maximum amount of inhibition in MCF-7 experiments was 12.1 ± 0.003%, which was evident on day 5 using 8 h/day of PMF2 in combination with 50.0 µM pemetrexed (Table S2).
It was also hypothesized that chemotherapeutic agents may act synergistically with PEMF to decrease cancer cell proliferation. Compared to respective controls, neither 4.0 nor 8.0 µM of cisplatin led to much difference in the effect of PEMF on suppressing A549 growth. However, PEMF did have an effect, as both PMF1 (−5.5 ± 1.3%) and PMF2 (−4.3 ± 1.0%) alone without cisplatin decreased viability of A549 cells (P = .01). In contrast, 5.0 nM pemetrexed (−5.5 ± 0.2%) and 50.0 µM (−9.8 ± 0.3%) combined with PEMF significantly (P < .01) inhibited MCF-7 growth with each increasing dose. Interestingly, neither PMF1 nor PMF2 caused significant effects on MCF-7 cell proliferation without pemetrexed.
Cell Cycle Might not be Affected by PEMF Exposure in our Cancer Cell Line Models
One potential mechanism by which PEMF may decrease proliferation is through repression or disruption of the cell cycle. There were some significant differences noted (Tables S3 and S4) in individual experiments determining the distribution of MCF-7 cells in cell cycle phases treated with PMF1 or PMF2 after 24 or 48 h. Overall, PEMF had minor effects on G1 (0.9%), G2 (−0.2%), S (−2.5%), and G0 (8.5%) compared to respective controls independent of other variables (P > .05).
Effect of Osteogenic PEMF on Apoptosis and Autophagy
To understand the underline mechanisms of PEMF associated cell growth inhibition, we looked at if PEMF cause necrosis or programed cell death in A549 or MCF 7 cancer cells. The 2 major mechanisms of programmed cell death, apoptosis, and autophagy were investigated as endpoints for the suppressive effects of PEMF on cell viability or cell growth. Caspase 3/7 levels, indicative of apoptosis, were significantly increased (P < .05) on days 3 and 5 in MCF-7 and A549 cells treated with PMF1/2 alone (Figure 2). Likewise, exposure of MCF-7 to PMF1/2 with or without pemetrexed resulted in small but significant increases in annexin V staining (P < .05) (Figure 3, Table S5). Without accounting for pemetrexed dose or duration of PEMF exposure, PMF1, compared to untreated controls, respectively increased R2 (dead cells) and R3 (late apoptotic) by 9.4 ± 5.4% and 6.2 ± 2.7%, and decreased R5 (early apoptotic) and R4 (living) by 0.6 ± 2.1% and 0.02 ± 0.1% (P > .1). Likewise, PMF2's effects were a respective increase of R2, R3, and R5 by 23.0 ± 6.9%, 40.1 ± 8.2%, and 46.9 ± 11.3% (P ≤ .01) while there was a decrease of R4 by 2.2 ± 0.3% (P < .01). Collectively, PMF1 and PMF2 respectively increased annexin V staining (percent change compared to untreated controls) of dead or apoptotic cells (R2 + R3 + R5) by 2.2 ± 1.8% (P = .47) and 33.1 ± 6.5% (P < .01).
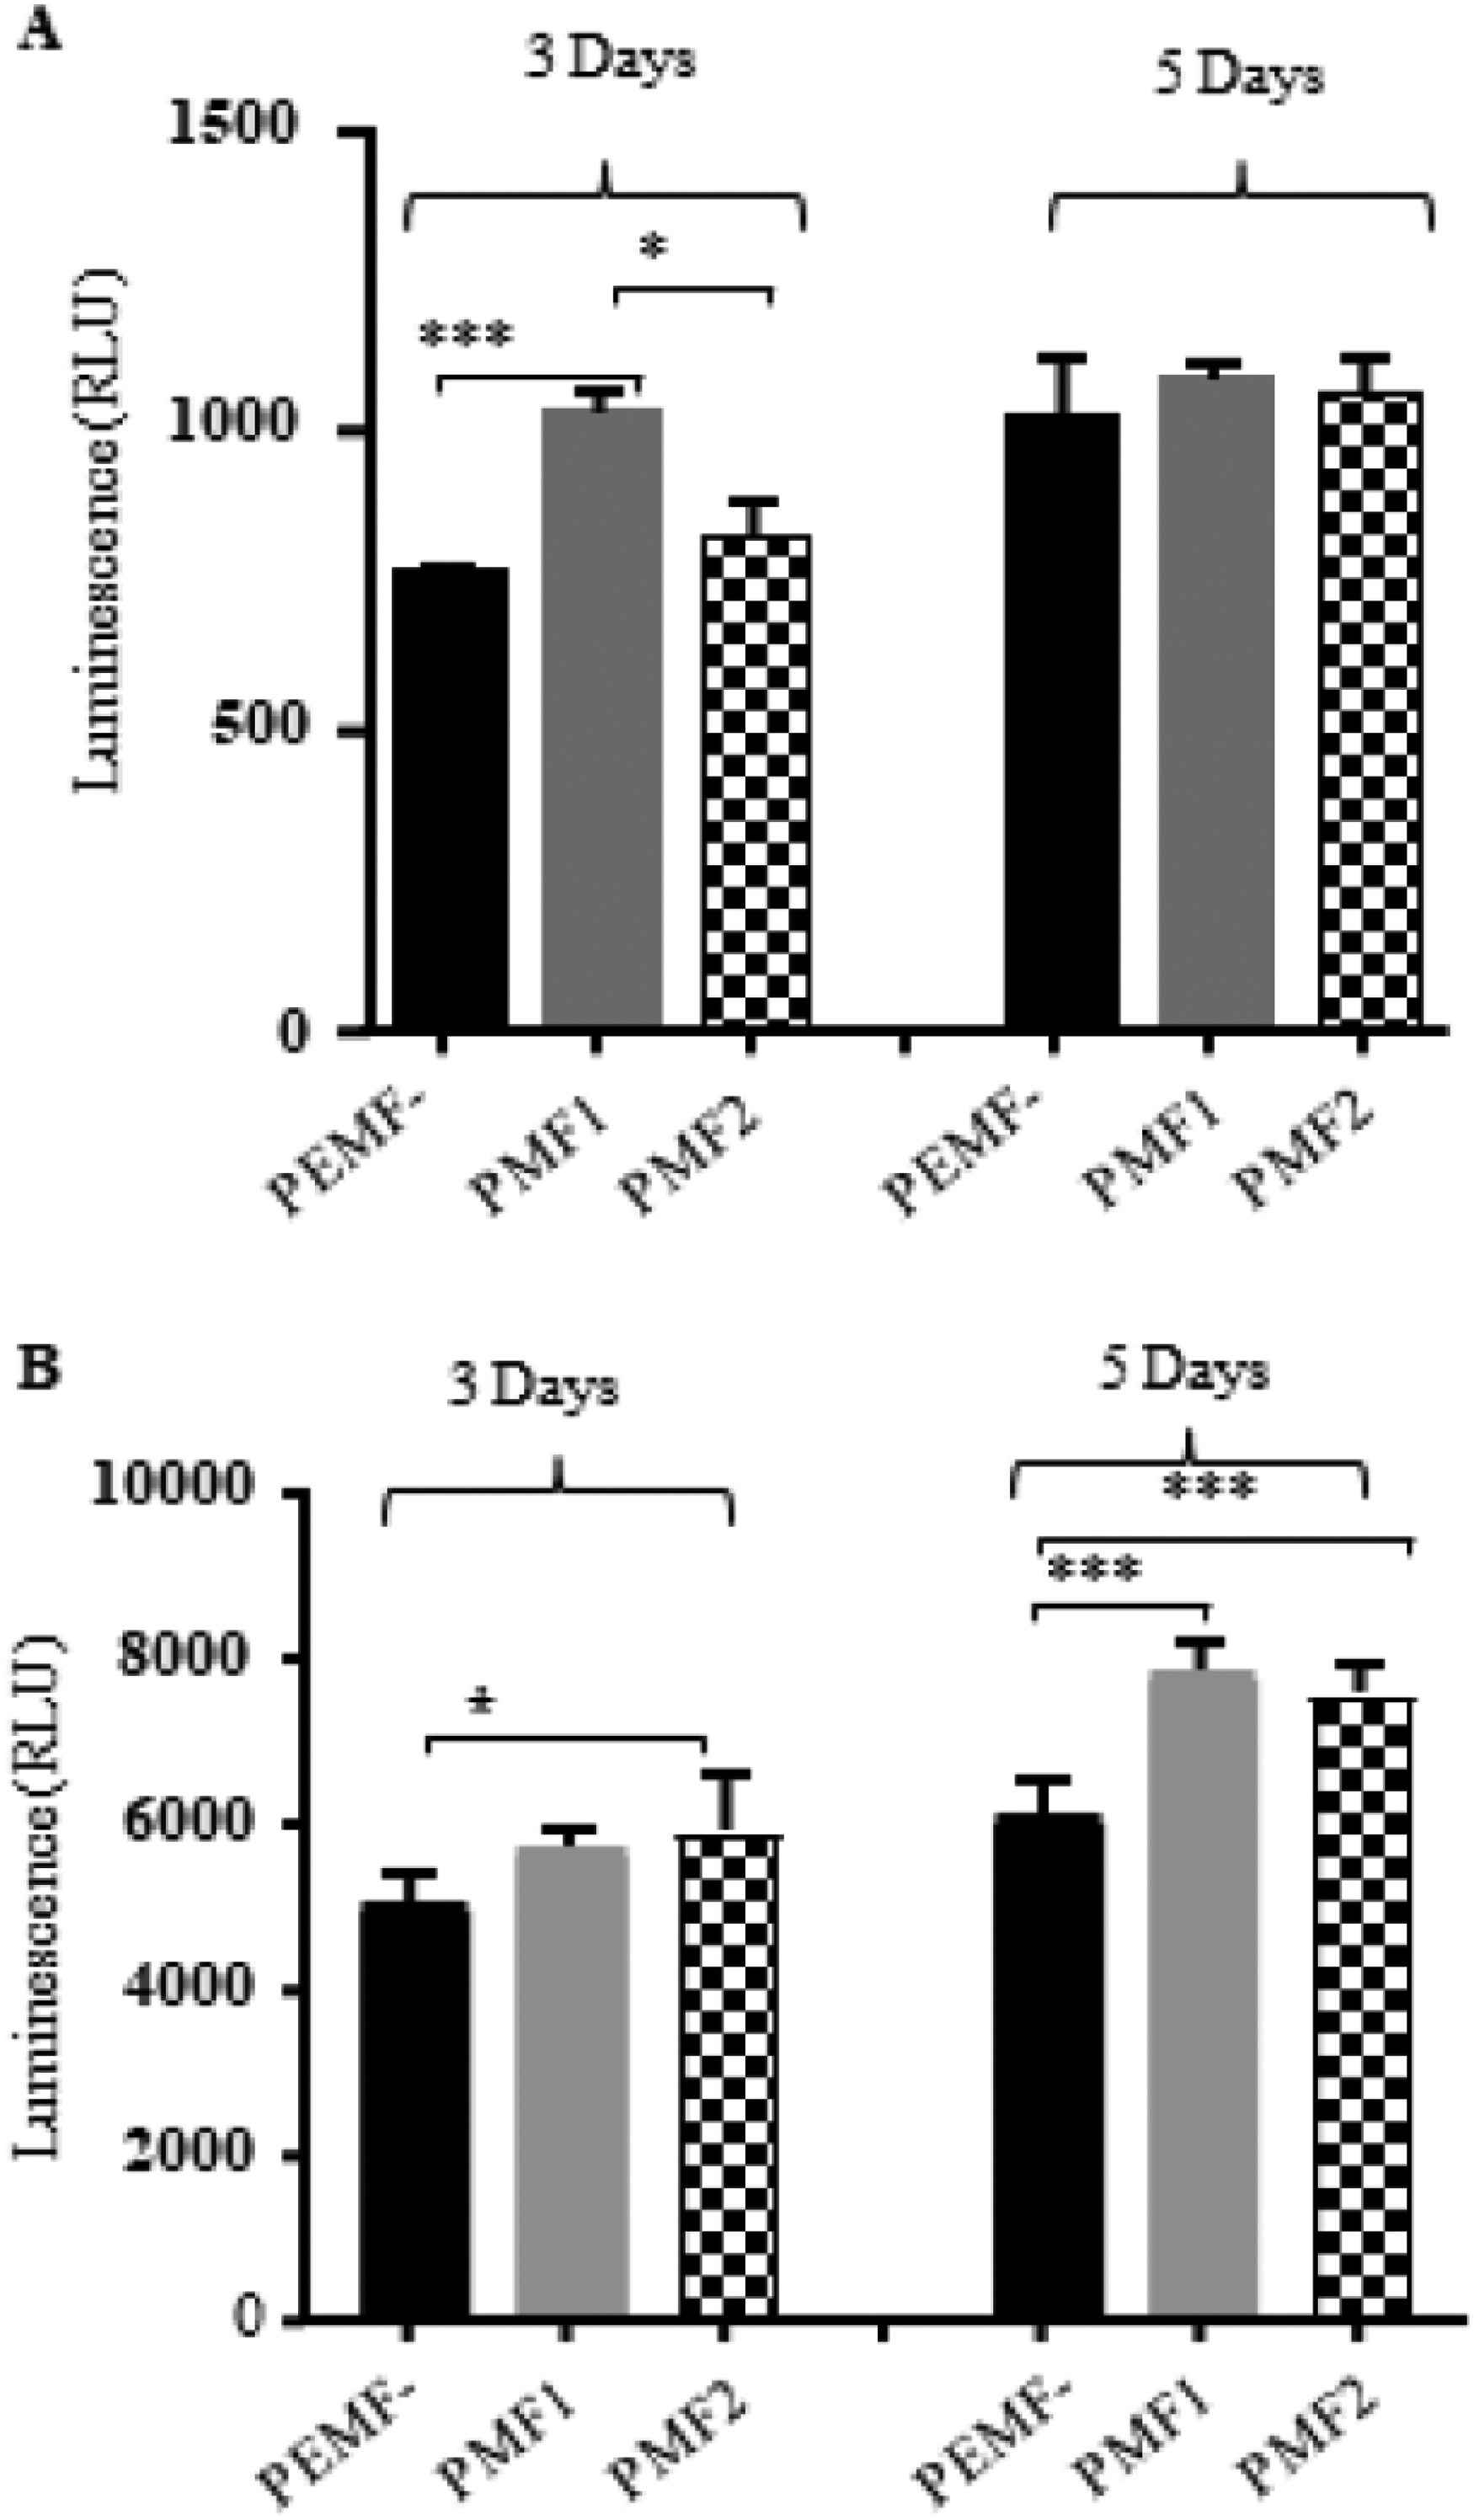
Effect of PEMF on the apoptosis of A549 and MCF-7 cells via caspase 3/7 assay. Two hours of daily PMF1/2 for 3 or 5 days induced caspase 3/7 activation in both A549 (A) and MCF-7 (B) cell lines. Significant findings are marked “*” (P < .05) and “***” (P < .001).

Apoptotic cells shown in MCF-7 cells treated with PEMF and pemetrexed by flow cytometric assessment. Annexin V staining assay was used. MCF-7 cells treated with different daily exposure lengths of PMF1 (A) or PMF2 (B) alone or in combination with various doses of pemetrexed for 48 h. Each treatment has 3 replicates. R2: dead cells; R3: late apoptosis cells; R4: living cells; R5: early apoptosis cells. (A) PMF1, (B) PMF2.
The effect of duration of PEMF exposure on annexin V staining was also examined. Increasing PMF1/2 dosage from 6 to 12 to 24 h significantly altered the amount of apoptosis or cell death in some experiments (Table S5). Grouped PMF1/2 results (independent of pemetrexed dose) did not reveal a statistically significant dose-response curve. Interestingly, the maximal percent increase in annexin V staining of dead and apoptotic cells (R2 + R3 + R5) relative to respective controls was evident in the low dose (5 nM) pemetrexed group with both PMF1 (13.5%) and PMF2 (74.5%) (P < .01). Correspondingly, maximal percent decrease in living cells (R4) also occurred in the low dose (5 nM) pemetrexed group with both PMF1 (−0.8%) (P < .01) and PMF2 (−4.3%) (P < .01). Above all, our data suggest that the decreased cell viability of cancer cells after treating with PEMF is associated with both cell necrosis and programmed cell death.
Autophagy (type II) was assessed in MCF-7 cells as well. Acridine orange staining decreased significantly with PMF2 alone, but was increased by the combination of PMF2 and pemetrexed. However, PMF2 alone or in combination with pemetrexed did not significantly affect the level of LC3B (light chain 3B) expression. Given the specificity of LC3B, our results suggested that PEMF might not have a major effect on autophagy (data not shown).
Effect of Osteogenic PEMF on Cell Membrane Permeability
The experiments above indicated that apoptosis was increased maximally when PEMF was used in combination with low dose pemetrexed. One explanation for this combined effect that has been previously reported by others30–32 is that PEMF can increase cell permeability. Towhidi et al 30 found that the uptake of large molecules into the cells was enhanced by the electric field with a field strength value as low as 2.5 V/cm. The intensity of electric field induced by the PEMF is determined by the slew rate (db/dt), the intensity change of magnetic field over time. The 2 signals used in this study can induce an electric field with an intensity of ∼1 V/cm (unpublished data), which is in the same order of magnitude of the electric signal in Towhidi's study. Therefore, we speculate that our signal will also enhance the cell permeability, and potentially promote the entry of cytotoxic agents. In our investigation, 12 h, but not 2 h, of PMF1 exposure significantly increased lucifer yellow uptake in MCF-7 cells compared to the corresponding non-PEMF controls (data not shown). These results suggest that longer PEMF exposure may be required to increase cell membrane permeability.
Effect of Osteogenic PEMF on Morphology and Mitotic Spindle Apparatus
Clinically used alternating electric fields disrupt mitotic spindles thereby preventing replication of glioblastoma. 1 Extremely low-frequency PEMF has also been shown to increase and reorganize actin in breast cancer cells. 14 The possibility that PMF2 may have such an effect was studied using immunostaining of tubulin and actin and qualification of their staining. As shown in Figure 4, 6 h PMF2 alone significantly suppressed levels of actin and tubulin expression, and correspondingly altered cellular morphology or disrupted the formation of mitotic spindles. With the presence of pemetrexed, PMF2 slightly reduced the amounts of tubulin, but caused more reduction in actin, especially at a concentration of 5.0 nM of pemetrexed, where a significant difference was seen. These results indicated that PMF2 exposure potentially caused structural damage to cancer cells of our in vitro MCF-7 model.

Immunostaining of tubulin and actin of MCF-7 cells treated with PEMF and pemetrexed. (A) pemetrexed only; (B) PEMF + pemetrexed; (C) quantification of A; (D) Quantification of B. Each treatment has 3 replicates. “*” P < .05.
Effect of Osteogenic PEMF on Gene Expression
The expression levels of genes involved with tumor suppression, DNA damage, cell cycle progression/arrest, and apoptosis in MCF-7 and A549 cells before and after exposing to PEMF have been investigated by q-RT-PCR. Numerous changes caused by PEMF have been observed (Figure 5). CHEK2 and p53 responded minimally to PMF1/2 with statistically significant changes occurring in less than 3 out of 8 experimental conditions for each gene. Moderate response (3-5 conditions) to PEMF was seen in ATM, BCL-2, Cyclin D1, and TNFRSF10B. P21 and proliferating cell nuclear antigen (PCNA) were highly responsive (6 or more out of 8).

Relative expression of selected gene measured by qRT-PCR. (A) qRT-PCR data of different genes in A549/luc cells treated and untreated with PEMF for 3 and 5 days (Days = D); (B) qRT-PCR data of different genes in MCF-7/luc cells treated and untreated with PEMF for 3 and 5 days. Each treatment has 3 replicates. “*” P < .05, “**” P < .01, and “***” P < .001.
Further analysis was performed for the moderately and highly affected genes. ATM, which causes cell cycle arrest or apoptosis, was upregulated in 4/8 conditions (1/4 P < .05) and downregulated in 3/8 (2/3 P < .05). The anti-apoptotic gene Bcl-2 was upregulated in 4/8 (3/4 P < .05) and downregulated in 4/8 (2/4 P < .05) conditions. The cell cycle promoter cyclin D1 was upregulated in 2/8 (1/2 P < .05) and downregulated in 6/8 (2/6 P < .05) conditions. TNFRSF10B (TNF Receptor Superfamily Member 10b), a transducer of apoptosis signals was upregulated in 5/8 (3/5 P < .05) and downregulated in 2/8 (2/2 P < .05) conditions favoring an anti-tumor effect. Cyclin-dependent kinase inhibitor p21 expression was also changed by PEMF, resulting in an anti-tumor effect with 6/8 upregulated (5/6 P < .05) and downregulated in 2/8 (1/2 downregulated P < .05) conditions. PCNA, an auxiliary protein of DNA polymerase delta that is critical for replication was upregulated in 4/8 (2/4 P < .05) and downregulated in 4/8 (4/4 P < .05) conditions. Collectively, in the moderately and highly affected groups, there were 17 statistically significant results associated with tumor inhibition, whereas only 9 statistically significant results were linked to tumor growth.
A549 and MCF-7 cells were similarly responsive as significant changes in both cell lines were seen in 16 out of 32 possible conditions. Exposure to PMF1 (18/32 overall, 10/18 in A549, and 8/18 in MCF-7) resulted in more significant changes compared to PMF2 (14/32 overall, 6/14 in A549, and 8/14 in MCF-7). Exposure over 3 or 5 days did not seem to make a difference as there was an equal number (16/32 in A549 and 16/32 in MCF-7) of significant responses regardless of experimental duration. A cluster of PMF2 induced changes was seen in MCF-7 cells on day 3 with 7 out of 8 possible conditions being statistically significant.
Effect of Osteogenic PEMF on Tumor Growth In Vivo
To further validate the effects of osteogenic PEMF on breast and lung cancer cells, experiments with similar dosage of PEMF and chemotherapeutic agents were performed in mice xenografted models. Representative and summarized results are depicted in Figure 6. With the PEMF treatments, the average tumor size after 4 weeks was smaller than that of corresponding controls in A549 tumors, although these changes were statistically insignificant. In MCF-7 tumors, the effect of PEMF on tumor sizes at week 4 was also minimal (Figure 6).

Effect of 12-h PEMF and chemotherapy drug on the tumor growth in NSG mice model. Representative bioluminescent images of A549/Luc (A) and MCF-7/Luc (B) were captured at the end of the experiments (week 4). Tumor size was measured once weekly using a caliper during daily PEMF treatment and intermittent chemotherapy drug administration. Graphs depicting the tumor growth curve at different weeks (wk 1, 2, 3, 4) with the treatment of PEMF and chemotherapy drug in A549/Luc (C) (16 mice from the combination of 2 groups) and MCF-7/Luc (D) cells (8 mice per group).
Analysis by normalizing tumor size at each time point by the starting tumor size at week 0 was also performed (Figure S3). This seemed appropriate because there was significant variability in starting tumor size. At the end of 4 weeks, grouped PEMF-, PMF1, and PMF2 A549 tumor sizes were respectively 822 ± 148%, 588 ± 95%, and 600 ± 101% (mean ± SEM) compared to starting tumor size at week 0 (P < .01). Thus, PMF1 and PMF2 treated tumors were respectively 28.4% and 27.0% smaller than A549 controls at the end of 4 weeks. However, even with this method of analysis, the effects of PEMF were not as apparent in the in vivo MCF-7 model. Overall, PEMF-, PMF1, and PMF2 tumor sizes after 4 weeks were respectively 649 ± 67%, 668 ± 63%, and 591 ± 88% compared to starting tumor size (P = .7). PMF1 treatment slightly increased tumor size by 2.8% compared to controls, whereas PMF2 treated tumors were 9.0% smaller after 4 weeks.
In the A549 mouse model, there were no significant differences between the effects of PMF1 and PMF2 at any time point. Reflecting the effects of chemotherapy, tumors were significantly smaller with increasing cisplatin dose. However, there was no clear synergy between PMF1/2 and low or high dose cisplatin. In fact, the most suppression of growth occurred in tumors treated with PEMF alone. Averaging effects over 4 weeks, PEMF-A549 tumors were 28% and 34.6% larger than respective PMF1 and PMF2 tumors (P < .05).
In MCF-7 implants, the effect of PEMF was difficult to discern. Differences in tumor size among PMF1/2 and controls were noted to be the greatest at week 3. At that time point, PMF1 and PMF2 treated tumors were on average 13.5% and 9.0% smaller than respective PEMF-controls (P = .6). There was no significant difference between the effects of PMF1 and PMF2 at any time point. PMF 1 and 2 alone, without pemetrexed, did not significantly alter tumor growth. Because potential combined effects between PEMF and pemetrexed was noted in vitro, the effects of PMF1/2 were also analyzed when only in combination with chemotherapy. Under these conditions, PMF1 and PMF2 tumors were 8.3% and 24.8% smaller than respective PEMF-MCF-7 tumors at the end of 4 weeks (P > .05).
Discussion
Osteogenic PEMF is typically used to promote spinal fusion (arthrodesis) after surgery or as a treatment for long-bone non-union in the clinical setting. The effect of PEMF in this frequency range on cancer cells has not been previously investigated. Given that osteogenesis involves cellular proliferation, it is possible that osteogenic PEMF may induce cancer cell proliferation. Alternatively, there is ample evidence to suggest that the opposite may occur. Multiple studies examining a variety of PEMF waveforms with lower or higher frequencies have shown an inhibitory effect.1, 16, 33–36 The main objective of this study was to determine the effects of 2 different osteogenic PEMF signals on the proliferation and chemosensitivity of breast and lung cancer in vitro and in vivo. Additionally, cellular and genetic changes were studied for correlation and to gain further insight into the mechanism(s) underlying osteogenic PEMF functions. These “mechanistic” studies were usually performed in MCF-7 because data suggested there was a greater PEMF effect in this cell line.
The effect of PMF1/2 on tumor cell proliferation was inhibitory. Collectively, growth in vitro was modestly decreased on average by −3.7 ± 0.7% (PMF1) and −5.8 ± 0.4% (PMF2). Statistical significance (P < .05) was evident in approximately half of the experiments. In a very small fraction of experiments (1/60), PEMF signals caused the proliferation of the cancer cells. We attribute the lack of achieving statistical significance in more experiments and occasional outliers due to the small magnitude of the mean effect and the large number of experiments performed.
Interestingly, the effect of osteogenic PEMF on A549 tumor growth was more pronounced in vivo. In particular, negative controls were 28.4% and 27.0% larger than PMF1 and PMF2 treated counterparts in A549 implants. In contrast, the response of MCF-7 implants to PMF1/2 was comparable in vitro and in vivo. PMF1 treated MCF-7 implants were 2.8% larger than PMF-controls at the end of 4 weeks. PMF2 resulted in a 9.0% reduction in MCF-7 implants. We are intrigued by our observation that growth inhibition was more remarkable in A549 in vivo experiments compared to A549 in vitro and MCF-7 in vivo experiments. The A549 in vivo experiments were repeated with the same results, diminishing the possibility of experimental error. One explanation is that through other mechanisms such as the anti-angiogenic effect,36, 37 conditions for tumor response in vivo may favor an enhanced PEMF activity. However, the lack of a similar response in MCF-7 implants seemingly argues against this hypothesis. It should be noted that MCF-7 implants were grown in Matrigel with estrogen supplementation, both of which are strong proliferative stimulants that potentially negated the suppressive effects of PEMF.
Changes in the phase distribution of cells within cell cycle corresponded to the decrease in cell proliferation. Overall, G1 and G2 were minimally affected by PMF1/2. Although statistical significance was obtained in certain individual experiments, only S (synthesis) phase and G0 (cell cycle arrest) trended towards a respective decrease of 2.5% and an increase of 8.5% compared to controls (P > .05). Similarly, studies by others using ELF-PEMF have demonstrated minimal cell cycle effects on lymphoma, colon adenocarcinoma, and osteosarcoma cells.17, 38
As these changes in cell cycling were minor, another mechanism (s) probably account for the suppressive effect of PMF1/2 on cell viability. Consistent with numerous reports, we found that PEMF can induce apoptosis.11–13, 15, 16, 33, 34, 37 Our data showed that caspase 3/7 levels were significantly elevated by 3 or 5 days of PMF1/2 alone. Likewise, annexin staining revealed a general increase in the percentage of apoptotic or dead cells with a corresponding decrease in living cells. Unlike one report in which glioblastoma cells were exposed to extremely low-frequency PEMF, 35 there was no increase in the amount of autophagy seen in our study with MCF-7 cells treated with PMF1/2.
We also determined the effects of PMF1/2 on the expression of 8 genes (CHEK2, p53, ATM, BCL-2, Cyclin D1, TNFRSF10B, P21, and PCNA) involved with tumor suppression, DNA damage, cell cycle progression/arrest, and apoptosis. It is notable that statistically significant changes were seen in all of the genes and evident in half of all possible experimental conditions, which strongly support our findings in the suppression of cell growth in vitro and in vivo as well as the observed changes in cell membrane permeability and morphology. As the list of genes that were studied was arbitrarily compiled, it is extremely likely that further analysis would reveal global alterations in gene expression. Furthermore, although there were many changes, not all of them were anti-tumor. For example, BCL2 exhibited in opposite directions in expression under PMF1 and PMF2 settings, which may reflect BCL2 potential function as anti-apoptotic or pro-apoptotic gene depending on the exposure program. However, taken together, there was about a 2:1 ratio of statistically significant gene expression changes associated with tumor inhibition compared to tumor growth. Grossly, our findings are in general agreement with other studies examining how ELF-PEMF affects gene expression in cancer cells.11, 33, 34
The attenuation of cancer cell survival mechanisms potentially amplifies chemosensitivity. PMF1/2, in vitro and in vivo, did not significantly increase cisplatin cytotoxicity, whereas it did significantly shift dose-response curves of pemetrexed. Beyond the differences in the mechanism of action of the 2 agents, one explanation for this observation is that PMF1/2 affected the cell lines differently. In vitro and in vivo, PMF1/2 alone suppressed A549, but not MCF-7 growth. Cell line and cytotoxic agent dependency of chemosensitization by ELF-PEMF have been previously observed.7, 18, 26
To increase the modest ability of PMF1/2 to inhibit tumor growth, PEMF dose was intensified by increasing the duration of daily exposure (increasing field strength was prohibitive due to equipment limitations). The in vitro dose-response curves over 4 (−3.3%), 6 (−4.4%), 8 (−6.2%), and 24 h (−5.1%) were relatively flat, no significant difference. To a degree, these results contrast with Crocetti et. al.'s work, in which longer exposure time (30-90 min) decreased the viability of MCF-7 cells with extremely low-frequency PEMF. 7 Others such as De Mattei have noted that cancer cells require only brief (30 min) daily exposure for PEMF effects to occur. 18 The lack of significant additional response to greater exposure times in the present study (minimal daily exposure was 4 h) may then have been due to exceeding the threshold at which PEMF effects would occur.
With the aim of further increasing the effect of osteogenic PEMF on cancer cells, 2 signals were investigated. However, PMF1 and PMF2 comparably inhibited tumor growth in vitro and in vivo. It is perhaps not surprising that significant differences were difficult to appreciate, as a 10-fold difference is fairly small given the scale of the lower portion of the electromagnetic spectrum (3 Hz to 300 kHz).
The results of this study in combination with previous studies (less than 200 Hz and greater than 300 kHz) suggest that there is a fairly broad spectrum where anti-proliferative effects can occur. However, the mechanism at different frequencies may vary. Similar to the studies that others have performed with lower and higher frequencies, our experiments did demonstrate changes in the cytoskeletal organization or membrane permeability.1, 26, 30, 31, 33 Dissimilarities may be caused by differences in PEMF parameters, apparatus setup, and cell lines, which also lead to the limitations of our study. In future, we will expand our study with various PEMF setting, chemodrugs, and cell lines to explore the effect of PEMF on cancer cells.
In summary, osteogenic PEMF moderately inhibited tumor growth in vitro and in vivo. Perturbances in cell cycling and gene expression, as well as increased cell membrane permeability and changes in morphology that were consistent with a proapoptotic effect were evident. However, the exact mechanism through which the observed changes occurred remains elusive. Though promising, inhibitory effects of osteogenic PEMF are modest and would require amplification for utility as an anti-neoplastic therapy.
Supplemental Material
sj-docx-1-tct-10.1177_15330338221124658 - Supplemental material for In Vitro and in Vivo Study of the Effect of Osteogenic Pulsed Electromagnetic Fields on Breast and Lung Cancer Cells
Supplemental material, sj-docx-1-tct-10.1177_15330338221124658 for In Vitro and in Vivo Study of the Effect of Osteogenic Pulsed Electromagnetic Fields on Breast and Lung Cancer Cells by Mike Y. Chen, Jing Li, Nianli Zhang and Erik I. Waldorff, James T. Ryaby, Philip Fedor, Yongsheng Jia, Yujun Wang in Technology in Cancer Research & Treatment
Supplemental Material
sj-xlsx-2-tct-10.1177_15330338221124658 - Supplemental material for In Vitro and in Vivo Study of the Effect of Osteogenic Pulsed Electromagnetic Fields on Breast and Lung Cancer Cells
Supplemental material, sj-xlsx-2-tct-10.1177_15330338221124658 for In Vitro and in Vivo Study of the Effect of Osteogenic Pulsed Electromagnetic Fields on Breast and Lung Cancer Cells by Mike Y. Chen, Jing Li, Nianli Zhang and Erik I. Waldorff, James T. Ryaby, Philip Fedor, Yongsheng Jia, Yujun Wang in Technology in Cancer Research & Treatment
Supplemental Material
sj-xlsx-3-tct-10.1177_15330338221124658 - Supplemental material for In Vitro and in Vivo Study of the Effect of Osteogenic Pulsed Electromagnetic Fields on Breast and Lung Cancer Cells
Supplemental material, sj-xlsx-3-tct-10.1177_15330338221124658 for In Vitro and in Vivo Study of the Effect of Osteogenic Pulsed Electromagnetic Fields on Breast and Lung Cancer Cells by Mike Y. Chen, Jing Li, Nianli Zhang and Erik I. Waldorff, James T. Ryaby, Philip Fedor, Yongsheng Jia, Yujun Wang in Technology in Cancer Research & Treatment
Supplemental Material
sj-xlsx-4-tct-10.1177_15330338221124658 - Supplemental material for In Vitro and in Vivo Study of the Effect of Osteogenic Pulsed Electromagnetic Fields on Breast and Lung Cancer Cells
Supplemental material, sj-xlsx-4-tct-10.1177_15330338221124658 for In Vitro and in Vivo Study of the Effect of Osteogenic Pulsed Electromagnetic Fields on Breast and Lung Cancer Cells by Mike Y. Chen, Jing Li, Nianli Zhang and Erik I. Waldorff, James T. Ryaby, Philip Fedor, Yongsheng Jia, Yujun Wang in Technology in Cancer Research & Treatment
Supplemental Material
sj-xlsx-5-tct-10.1177_15330338221124658 - Supplemental material for In Vitro and in Vivo Study of the Effect of Osteogenic Pulsed Electromagnetic Fields on Breast and Lung Cancer Cells
Supplemental material, sj-xlsx-5-tct-10.1177_15330338221124658 for In Vitro and in Vivo Study of the Effect of Osteogenic Pulsed Electromagnetic Fields on Breast and Lung Cancer Cells by Mike Y. Chen, Jing Li, Nianli Zhang and Erik I. Waldorff, James T. Ryaby, Philip Fedor, Yongsheng Jia, Yujun Wang in Technology in Cancer Research & Treatment
Footnotes
Abbreviations
Authors’ Note
All data generated or analyzed during this study are included in this manuscript. All experiments including animals are in compliant with protocol#14032 approved by City of Hope IACUC.
Acknowledgments
We thank Dr Jeff Longmate for kindly assisting data analysis and Ms Gloria Yang-Kolodji for editing support. Research reported in this publication included work performed in the Analytical Cytometry, Light Microscopy Digital Imaging, Animal facility, Biostatistics and Mathematical Modeling cores supported by the National Cancer Institute of the National Institutes of Health under grant number P30CA033572. The content is solely the responsibility of the authors and does not necessarily represent the official views of the National Institutes of Health. The project is partially supported by Orthofix Medical Inc. of Lewisville TX, USA.
Declaration of Conflicting Interests
The authors declared no potential conflicts of interest with respect to the research, authorship, and/or publication of this article.
Funding
The authors disclosed receipt of the following financial support for the research, authorship, and/or publication of this article: This work was supported by the Orthofix Medical Inc.
Supplemental Material
Supplemental material for this article is available online.
References
Supplementary Material
Please find the following supplemental material available below.
For Open Access articles published under a Creative Commons License, all supplemental material carries the same license as the article it is associated with.
For non-Open Access articles published, all supplemental material carries a non-exclusive license, and permission requests for re-use of supplemental material or any part of supplemental material shall be sent directly to the copyright owner as specified in the copyright notice associated with the article.