
Abstract
Among all malignancies worldwide, gastric cancer is the fifth most common cancer with the third highest mortality rate. One of the main reasons for the low survival rate is the recurrence and metastasis that occurs in many patients after surgery. Numerous studies have shown that abnormal TRIM33 expression is associated with the progression of malignant tumors. TRIM33 can function either as a tumor suppressor or tumor promoter in different cancers. Our data showed that TRIM33 was highly expressed in stomach cancer, and in human gastric cancer tissues, low expression of TRIM33 was associated with poor prognosis in patients with gastric cancer. To clarify the function of TRIM33 in survival and epithelial–mesenchymal transition in gastric cancer cells, we investigated the effect of TRIM33 knockdown in several gastric cancer cell lines. Downregulation of TRIM33 in BGC-823 and SGC-7901 cells enhanced the proliferation, colony formation, and migratory ability of these gastric cancer cells. It also promoted epithelial–mesenchymal transition; transfection of cells with siRNA targeting TRIM33 led to the upregulation of vimentin and N-Cadherin expression, and downregulation of E-Cadherin expression. Meanwhile, the transforming growth factor beta pathway was activated: levels of transforming growth factor beta were elevated and the expressions of p-Smad2, Smad2, Smad3, and Smad4 were activated. To confirm the role of TRIM33 in vivo, a xenograft model was established in nude mice. Immunohistochemical analysis identified that the protein levels of TRIM33, p-Smad2, Smad2, Smad3, Smad4, vimentin, and N-Cadherin were increased, and E-Cadherin levels were decreased, in xenograft tumors from the si-TRIM33 group. Taken together, these results suggest that TRIM33 may be a potential marker for the diagnosis and prognosis of gastric cancer. Furthermore, it may also serve as a novel target for gastric cancer treatment.
Introduction
Among all malignancies worldwide, gastric cancer (GC) is the fifth most common cancer, with the third highest mortality rate. The 5-year survival rate for GC has been less than 25% for the last 2 decades. 1 Various complex genetic, epigenetic, and microenvironmental factors are involved in the development and progression of GC. One of the main reasons for the low survival rate in GC is recurrence and metastasis in many patients post-surgery.2–7 Thus, the identification of novel molecular mediators conferring malignant potential to GC cells, which could be used as markers for predicting the risk of GC progression, is crucial.
Tripartite motif-33 (TRIM33) is a member of the TRIM family of proteins having 3 conserved domains: a zinc finger domain (RING finger), 1 or 2 B-box domains, and a coiled-coil region. Of these, the B-box is a characteristic domain of the TRIM family. 8 Functionally, zinc finger domain-containing proteins act as E3 ubiquitin ligases, which mediate the ubiquitination of the protein itself or of different substrates.9–12 Perplexingly, TRIM33 can function either as a tumor suppressor or tumor promoter in different cancer types. For example, TRIM33 acts as a tumor suppressor in non-small-cell lung cancer, breast cancer, and clear cell renal cell carcinoma13–15 whereas, it acts as a tumor promoter in pancreatic cancer and cervical carcinoma.16,17 These contrasting activities suggest that the TRIM33 function varies in different tumor types. Studies have shown that TRIM33 can activate transforming growth factor beta (TGF-β) signaling to initiate formation of the TRIM33-Smad2/3 complex, thereby silencing downstream genes. 18 However, the TGF-β signaling system often activates different downstream transcription factors playing opposite roles. TRIM33 plays a crucial role in determining the function of TGF-β signaling. To date, the expression pattern and biological role of TRIM33 in human GC remain unclear.
We aimed to define the role of TRIM33 in the proliferation and invasion of GC, and to analyze changes in TGF-β signaling molecules affected by TRIM33. This study may provide novel insight into the occurrence and progression of GC. This is a prospective study with research implications.
Materials and Methods
Materials
The GC cell lines (BGC-823, MGC-803) were purchased from Shanghai Zhong Qiao Xin Zhou Biotechnology Co., Ltd. Human gastric epithelial cells (GES) were purchased from Shanghai Huiying Biological Technology Co., Ltd, and SGC-7901 cells were a gift from Tangshan Yanyi Biotechnology Co., Ltd Roswell Park Memorial Institute (RPMI) medium and fetal bovine serum (FBS) were purchased from HyClone, and F12 Complete Medium from Zhong Qiao Xin Zhou Biotech. siRNA plasmids targeting TRIM33 were synthesized by Life Technologies, and Lipofectamine 2000 was purchased from Invitrogen. Bicinchoninic acid (BCA) and 5-ethynyl-2′-deoxyuridine (EdU) kits were both purchased from Keygen. The rabbit antibody against human TRIM33 (Cat No. 55374-1-AP) was purchased from ProteinTech; rabbit antibodies against human phospho-Smad2 (p-Smad2; #18338), Smad2 (#5339), Smad3 (#9523), Smad4 (#46535), vimentin (#5741), N-Cadherin (#13116), E-Cadherin (#3195), and β-actin (#5125), as well as a horseradish peroxidase-linked goat anti-rabbit antibody (#7074), were purchased from Cell Signaling Technology. Cell Counting Kit-8 (CCK8) kits were purchased from Dojindo, enzyme-linked immunosorbent assays (ELISAs) from Jiangsu Meimian Industrial Co., Ltd, and 24-well plate Transwell chamber systems from Corning.
TCGA Database Analysis
The TRIM33 expression data of all tumors in this study were derived from The Cancer Genome Atlas (TCGA) database (https://portal.gdc.cancer.gov/) and the online analysis software GEPIA2 (http://gepia2.cancer-pku.cn/#index).
Survival Analysis
To evaluate the clinical significance of TRIM33 in GC, we investigated the differences in survival time between patients with GC and high TRIM33 expression, and patients with GC and low TRIM33 expression. Kaplan-Meier (KM) survival analysis for GC and the subsequent log-rank test were performed using the KM Plotter database (http://kmplot.com/analysis/index.php?p=service&cancer=gastric). Briefly, Affy ID 210266_s_at (TRIM33) was selected for survival analysis. Totally 875 patients with GC were included for the analysis of overall survival (OS; survival time from diagnosis until death from any cause), 640 patients for analysis of first progression survival (FPS; survival time without progression of the disease), and 498 patients for analysis of post-progression survival (PPS; survival time following progressive disease during treatment). Moreover, there were 241 and 204 patients with primary tumor (pT)2 and pT3 stage disease, respectively. To determine the association between TRIM33 expression and OS, 67 patients with stage I GC, 140 patients with stage II GC, 305 patients with stage III GC, and 148 patients with stage IV GC were analyzed.
Cell Culture
The GES, BGC-823, MGC-803, and SGC-7901 cell lines were cultured in complete RPMI containing 10% FBS, and 1% penicillin and streptomycin, in an incubator at 37 °C and 5% CO2. Cells were grown in sterile culture dishes and passaged with 0.25% trypsin when they reached approximately 89% confluency.
si-TRIM33 Plasmid Transfection
Human GC cell lines BGC-823, MGC-803, and SGC-7901, and human GES in the logarithmic growth phase were plated in 35 mm dishes at 1 × 10⁵ cells/dish. Cells were incubated at 37 °C with 5% CO2 until they reached 50% to 80% confluency, then transfected with plasmids encoding either TRIM33-targeting siRNA (si-TRIM33 transfection group) or non-coding (NC) siRNA (control group). For each well, 100 µL solution A (40 µL si-TRIM33/si-NC + 60 µL Opti-RPMI) and solution B (6 µL Lipofectamine 2000 + 94 µL Opti-RPMI) were prepared, and incubated for 5 min. Solution B was then added to solution A, mixed, and incubated at room temperature for 30 min. This mixture was then added to cells, which were then cultured in an incubator at 37 °C with 5% CO2 for 8 h; the medium was then replaced with complete RPMI medium containing 10% FBS and 1% streptomycin.
CCK8 Assay
BGC-823 and SGC-7901 cells were digested, centrifuged, and collected. Cells were then resuspended and, after their density was adjusted, plated in a 96-well plate with 100 µL medium/well containing 6000 cells. Four wells were assigned to each group, with 6 plates being placed in a constant temperature incubator (37 °C, 5% CO2) and incubated overnight to allow cells to adhere to plates. Cells were then transfected, and 24 or 48 h later, 10 µL CCK8 solution was added to the wells. Following incubation for 2 h, the absorbance (optical density [OD] value) at 450 nm was measured.
EdU Assay
BGC-823 cell density was adjusted to 4 × 10⁴ cells/mL, and cells were then seeded into 3 24-well plates at 500 μL/well. Cells were then cultured in an incubator at 37 °C with 5% CO2. After overnight culture to allow cells to adhere to plates, cells were then transfected; after 24 h, an EdU incorporation assay was performed with an EdU assay kit according to the manufacturer's instructions. Briefly, cells were incubated in EdU solution for 2 h and then fixed with 4% paraformaldehyde; Triton X-100 (0.5%) was used to increase permeability. Staining was performed using Click-iT, and DNA counterstaining was performed using Hoechst. Images were captured using a fluorescence microscope. The percentage of EdU-positive cells was calculated by dividing the number of EdU-positive cells by the number of Hoechst-stained cells.
Plate Colony Assay
BGC-823 and SGC-7901 cells in the logarithmic growth phase were digested and counted using standard procedures. Cells were then transfected with plasmids encoding either NC or TRIM33-targeting siRNAs for 24 h and plated in 3 35-mm cell culture dishes (1000 cells/dish). Cells were incubated for 12 days in medium containing 10% FBS, then carefully washed twice with phosphate-buffered saline (PBS) and fixed in 3 mL 4% paraformaldehyde for 15 min. Subsequently, the fixing solution was discarded, crystal violet was added for 30 min, and the stained cells then carefully washed and air-dried. The number of colonies were directly counted by naked eye, or the number of spheres with more than 50 cells was counted under a microscope.
Wound Healing Assay
Crosshairs were drawn on the underside of 35 mm dishes with a marker. Next, 4 × 10⁵ SGC-7901 cells were seeded in these dishes and cultured overnight. When the confluency reached 80% to 90% on the following day, the original horizontal line of the crosshairs was traced along the cell monolayer with a pipette tip. Cells were washed thrice with PBS to remove detached cells, and imaged to record the scratch width at 0 h. Transfections were performed using the recommended concentrations of plasmids, and images were captured at 12, 24, 48, 72, 96, 120, and 144 h. For imaging, a field containing 8 scratches was randomly selected, cell motility near the scratches observed, and images captured. Image-ProPlus 6.0 software was used to determine the relative width of scratches, reflective of cell migratory ability. Each experiment was repeated at least 3 times.
Transwell Assay
A cell suspension of 2.5 × 10⁵ cells/mL was prepared in media without FBS, 110 µL of which was added to the upper chamber of a Transwell chamber, which was immediately placed onto a 24-well plate. The lower chamber was filled with complete medium containing 20% FBS. After incubation for 24 h, a cotton swab was used to remove any cells remaining in the upper chamber. Cells that had migrated to the other side of the membrane were fixed with ice-cold methanol for 30 min and stained with 0.1% crystal violet for 4 h. The stained chambers were left to dry, and then imaged.
ELISA
BGC-823 cells in the control and si-TRIM33 transfection groups were cultured for 24 h. TGF-β protein concentrations were then measured by ELISA, following the manufacturer's instructions. The OD value was read within 15 min of adding the stop solution.
Western Blotting
BGC-823 cells in the control and si-TRIM33 transfection groups were cultured for 24 h. The media was then discarded and cells washed twice with PBS. Cells were then lysed on ice with radioimmunoprecipitation assay buffer for 30 min. After complete lysis, cells were centrifuged at 15,000 × g at 4 °C for 10 min, and the supernatant was gently collected. A BCA kit was used to determine protein concentrations. Protein samples were then separated using 6% sodium dodecyl sulfate-polyacrylamide gel electrophoresis and transferred onto polyvinylidene fluoride membranes. After blocking with 5% skim milk for 1 h at room temperature, cropped membranes were incubated with primary antibodies against TRIM33, p-Smad2, Smad2, Smad3, Smad4, E-Cadherin, vimentin, N-Cadherin (all 1:1000), and β-actin (1:5000) at 4 °C overnight followed by 1 h at room temperature. The membranes were then washed thrice and incubated with HRP-conjugated secondary antibodies (Boster) for 1 h at 37 °C. The membranes were then washed again, and protein bands were detected using an enhanced chemiluminescence kit (Bio-Rad). The OD of bands was determined using Photoshop CC 2017 software.
Tumor Xenograft Model
A total of 5 × 10⁶ 19 cells were collected and injected subcutaneously into the flank regions of 4-week-old female BALB/c nude mice (Vital River). Their weights were measured at the indicated time after inoculation. After 3 weeks, nude mice were anesthetized by nasal suction with Ning Fen isoflurane anesthetic to enable tumor tissue to be obtained. Sections of tumor tissues were analyzed by immunohistochemistry (IHC), using the same antibodies as western blotting. Mice in the si-TRIM33 group died of cachexia on days 9 (2021-4-13), 11 (2021-4-15), 14 (2021-4-18), and 19 (2021-4-23). Mice in the control group survived, and were healthy, to the experimental end point (day 21), and all remaining mice were euthanized on day 21.
All animal procedures were conducted following the Guide for the Care and Use of Laboratory Animals in the Chinese Laboratory Animal Use Regulations. This study was approved by the Medical Research Ethics Review Committee of The General Hospital of Ningxia Medical University (KYLL-2021-419), and was performed in line with ARRIVE 2.0 guidelines. 20 In the process of animal experimentation, we always paid attention to the physical health and living environment of the animals, took full care of their psychological health, minimized the number of animals used, and minimized the pain they experienced. This experiment follows the guidelines for the care and use of laboratory animals, 8th edition. 21
Statistical Analysis
Statistical analysis was performed using IBM SPSS 21.0 software. One-way analysis of variance followed by Sheffe's post-hoc test were used for analysis of group differences. Data were expressed as the mean ± standard deviation, and each independent experiment was repeated thrice. Statistical significance was defined as P < .05.
Results
Association Between TRIM33 Expression and the Survival of Patients With GC
We examined TRIM33 expression in TCGA database. The TRIM33 expression appeared different among the 31 tumor types, including cholangiocarcinoma, colon adenocarcinoma, esophageal carcinoma, glioblastoma multiforme, kidney chromophobe, kidney renal clear cell carcinoma, liver hepatocellular carcinoma, stomach adenocarcinoma (STAD), thyroid carcinoma, and uterine corpus endometrial carcinoma (Figure 1A). Results of the survival analysis showed that low expression levels of TRIM33 were significantly associated with a high probability of shorter OS and FPS times, but not PPS times, compared with times in GC patients who had high TRIM33 expression levels. The median OS and FPS times were 26.7 and 16.3 months, respectively, in the low TRIM33 expression group, whereas they were 30.4 and 22.4 months, respectively, in the high TRIM33 expression group (P < .05, Figure 1B). Moreover, the association between TRIM33 expression and the OS of patients with different tumor stages was analyzed. The results revealed that low expression levels of TRIM33 were significantly associated with poorer survival in GC patients in the advanced stages (pT3, and tumor, node, and metastasis [TNM] stage IV), but not in those in the early pT stage (pT2) or TNM stages (stages I, II, and III), when compared with survival in GC patients who had high TRIM33 expression levels. The median OS time for patients with low and high TRIM33 expression with pT3 stage disease was 15.3 and 28.13 months, respectively, and 13.5 and 20.13 months for patients with stage Ⅳ disease, respectively. Collectively, these results indicate that low expression of TRIM33 may be a sign of poor prognosis in patients with GC (P < .05, Figure 1C and D).

The expression of TRIM33 in pan-cancer, and association between TRIM33 expression and the survival of patients with GC. (A) TRIM33 expression in 31 tumors from TCGA database. Red bars represent tumor samples, blue bars represent normal tissue samples. (B) OS, FPS, and PPS curves in patients with GC. (C) Survival curves of different pTNM stages in patients with GC. (D) Survival curves of different pT stages in patients with GC. *P < .05, **P < .01, ***P < .001 versus normal tissue samples.
Knockdown of TRIM33 Promoted the Proliferation of BGC-823 and SGC-7901 Cells
To determine whether TRIM33 is also highly expressed in GC cell lines, and whether knocking down TRIM33 changes their biological behavior, we analyzed the expression levels of TRIM33 in 4 cell lines: normal GES, and the GC cell lines BGC-823, MGC-803, and SGC-7901. Of the 3 GC cell lines, si-TRIM33 transfection resulted in the lowest levels of TRIM33 protein expression in the SGC-7901 and BGC-823 cells (P < .001; Figure 2A and B). Thus, BGC-823 and SGC-7901 cells were selected for subsequent experiments. TRIM33 protein levels were significantly lower in the si-TRIM33 transfection groups than in the control groups (P < .05; Figure 2C and D). This result indicates that si-TRIM33-encoding plasmids downregulated the expression of TRIM33 in BGC-823 and SGC-7901 cells. To investigate the effect of TRIM33 knockdown on the proliferation of BGC-823 and SGC-7901 cells, we performed a CCK8 assay, and measured the absorbance of cells cultured for 24 and 48 h. The CCK8 assay showed that the OD values of the si-TRIM33 group were higher at 24 and 48 h after transfection than those of the control group (P < .05, Figure 2E).

Knockdown of TRIM33 promoted the proliferation of BGC-823 and SGC-7901 cells. (A&B) Western blot analysis of TRIM33 expression in GES, BGC-823, MGC-803, and SGC-7901 cell lines. (C&D) Western blot analysis of TRIM33 protein expression in cells transfected with si-TRIM33 encoding plasmids. (E) CCK8 assays were used to measure BGC-823 and SGC-7901 cell viability in the control and si-TRIM33-transfected group; the viability of the si-TRIM33 transfection groups was enhanced. (F&G) EdU assays were used to evaluate proliferation in the control and si-TRIM33 transfection groups in BGC-823 cells; the percentage of EdU-positive cells in the si-TRIM33 group was significantly greater than in the control group. *P < .05, **P < .01; ns, non-significant.
During DNA replication, EdU is readily incorporated into cellular DNA. EdU assays are used for measuring cell proliferation based on well-preserved cellular and chromatin ultrastructure. We observed a significantly greater percentage of EdU-positive cells in the si-TRIM33 group than in the control group (P < .05, Figure 2F and G).
Knockdown of TRIM33 Enhanced Colony Formation and Migratory Ability
To investigate the effect of TRIM33 knockdown on the cloning efficiency of BGC-823 and SGC-7901 cells, we performed colony formation experiments. The results showed that the number of colonies was significantly higher in the si-TRIM33 than the control groups (P < .05, Figure 3A and B). To investigate the effect of TRIM33 knockdown on migration, Transwell and wound healing assays were performed in control and si-TRIM33 SGC-7901 cells. In the Transwell assay, there were more transmembrane cells in the si-TRIM33 group than in the control group (P < .01, Figure 3C and D); the wound healing assay demonstrated that the wound healing rate was accelerated in si-TRIM33 cells (P < .01, Figure 3E and F). These results further verify that downregulation of TRIM33 enhanced SGC-7901 cell migratory ability, consistent with the patient data showing that low TRIM33 expression is associated with poor prognosis in GC.
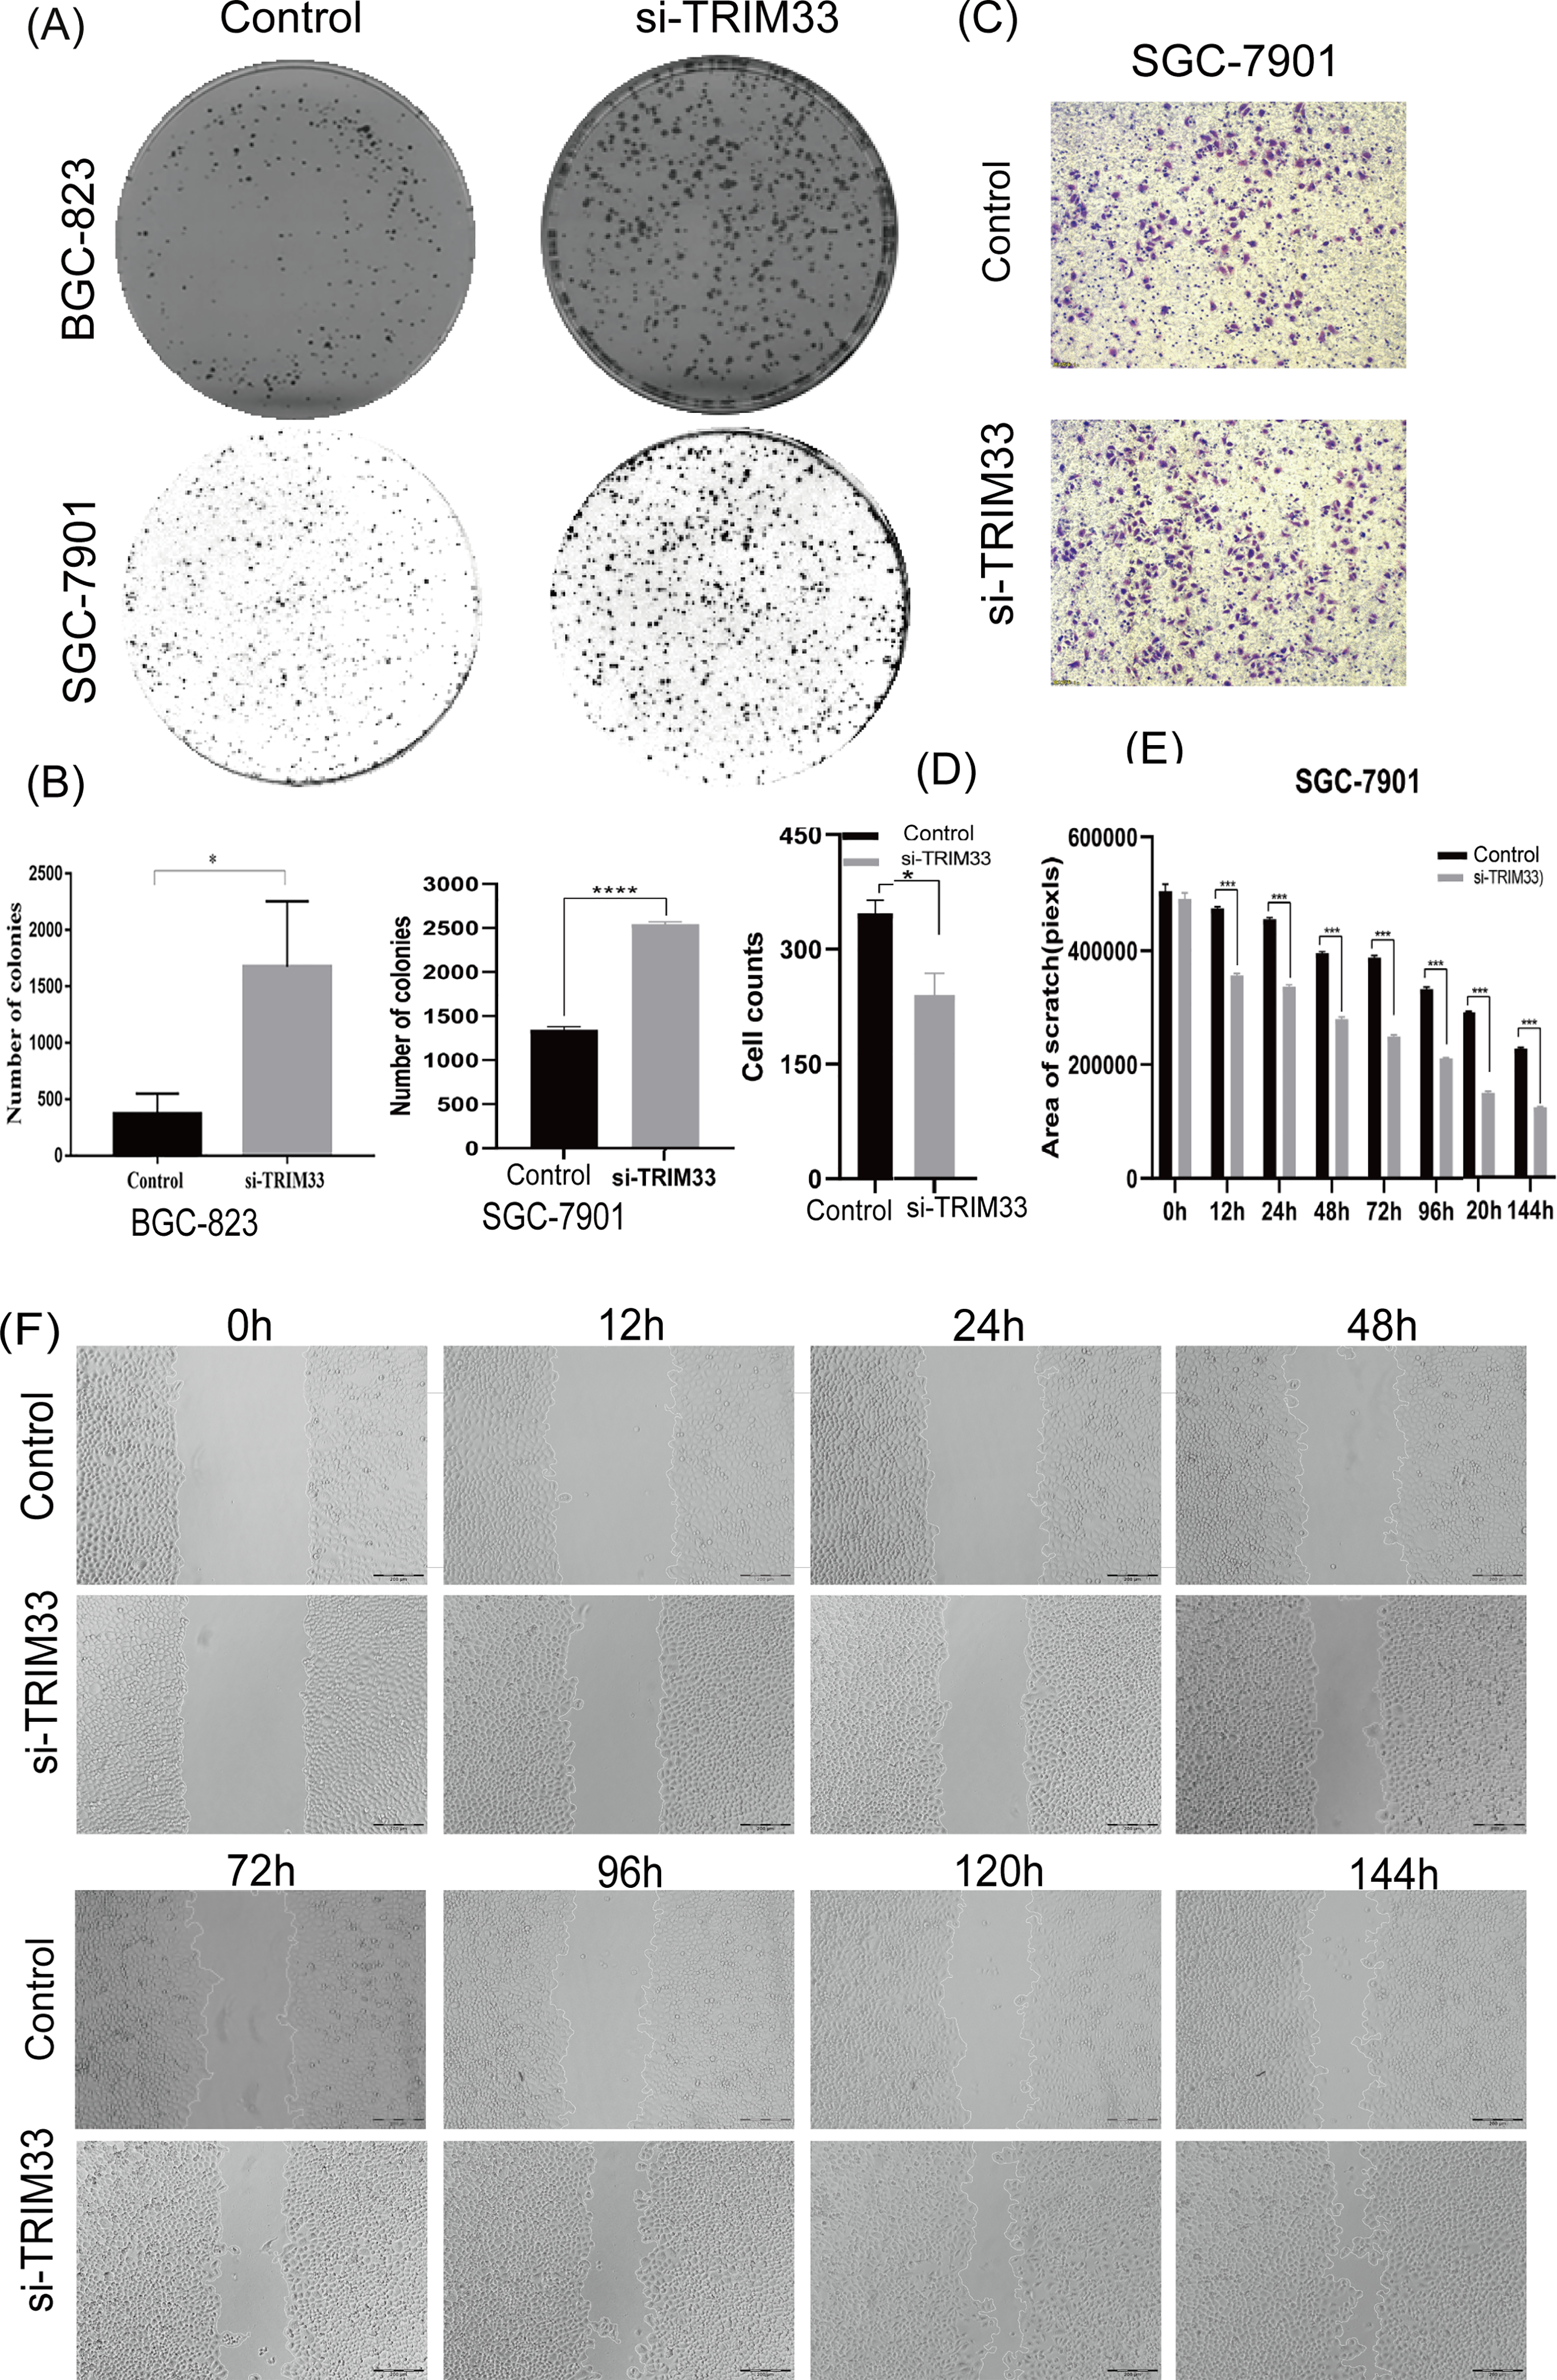
Downregulation of TRIM33 enhanced colony formation and migratory ability. (A&B) Downregulation of TRIM33 promoted colony formation in BGC-823 and SGC-7901 cells. (C&D) After 24 h, the number of cells passing through the Transwell membrane was higher in the si-TRIM33 group than in the control group (×100 magnification, corresponding to a scale of 200 μm). (E&F) After 12, 24, 48, 72, 96, 120, and 144 h, the width of the residual scratch was narrower in the si-TRIM33 group than in the control group (×100 magnification, corresponding to a scale of 200 μm). *P < .05, **P < .01.
Knockdown of TRIM33 Affected Expression of TGF-β Pathway-Associated Proteins
The above results indicated that TRIM33 knockdown promoted proliferation and migration in BGC-823 and SGC-7901 cells. In addition, we found that knockdown of TRIM33 upregulated TGF-β expression (P < .01, Figure 4A), suggesting that it resulted in activation of the TGF-β signaling pathway. To investigate the underlying mechanism, and the effect of TRIM33 knockdown on this pathway, we examined a panel of growth- and migration-related factors and signaling pathways (Figure 4B and C). We found that expression of p-Smad2 (Ser465/467), Smad2, Smad3, Smad4, vimentin, and N-Cadherin was upregulated, and expression of E-Cadherin was downregulated, in si-TRIM33 cells compared to expression in control and si-NC cells. The above results suggest that downregulation of TRIM33 activated TGF-β signaling in GC cells, signaling which may be responsible for driving tumor proliferation and migration. Quantification of protein expression verified that the expression of E-cadherin decreased in the si-TRIM33 cells compared to both the non-transfected control and si-NC cells (1.48 ± 0.09 vs 1.93 ± 0.19 and 1.84 ± 0.16, respectively). The expression levels of all other proteins analyzed were significantly increased in the si-TRIM33 cells compared to the non-transfected control and si-NC cells: vimentin (1.52 ± 0.07 vs 0.76 ± 0.05 and 0.85 ± 0.03, respectively); N-cadherin (1.42 ± 0.10 vs 0.65 ± 0.06 and 0.68 ± 0.19, respectively); p-Smad2 (Ser465/467) (1.65 ± 0.07 vs 1.39 ± 0.04 and 1.38 ± 0.07, respectively); Smad2 (0.99 ± 0.06 vs 0.82 ± 0.02 and 0.75 ± 0.05, respectively); Smad3 (1.19 ± 0.07 vs 0.74 ± 0.06 and 0.83 ± 0.07, respectively); and Smad4 (1.23 ± 0.04 vs 0.88 ± 0.02 and 0.94 ± 0.04, respectively) (P < .05, Figure 4B and C).

Knockdown of TRIM33 upregulated TGF-β expression. (A) ELISA analysis of TGF-β expression in the si-TRIM33 and control groups identified that knockdown of TRIM33 upregulated TGF-β expression, suggesting activation of the TGF-β signaling pathway. (B&C) Western blot analysis of the expression of proteins in the TGF-β signaling pathway in control, si-NC, and si-TRIM33 cells. Expression of p-Smad2 (Ser465/467), Smad2, Smad3, Smad4, vimentin, and N-Cadherin was upregulated, and E-Cadherin expression was downregulated, in si-TRIM33 cells. *P < .05, **P < .01.
Knockdown of TRIM33 Promoted GC Growth In Vivo
Assessment of tumor mass revealed that tumors were significantly larger in the si-TRIM33 group than in the control group (Figure 5A). We next used IHC analysis to examine the expression of TRIM33 (Figure 5B), and TGF-β signaling-associated proteins (Figure 5C) in tumor tissues. The protein levels of TRIM33, p-Smad2 (Ser465/467), Smad2, Smad3, Smad4, vimentin, and N-Cadherin were increased, and levels of E-Cadherin were decreased, in xenograft tumors from the si-TRIM33 group; these findings are consistent with the protein expression changes in si-TRIM33 cells previously identified by western blot. In summary, downregulation of TRIM33 activated the TGF-β signaling pathway and promoted EMT.

Knockdown of TRIM33 promoted GC growth in vivo. (A) The xenograft model of TRIM33-knockdown revealed that tumors were significantly larger in si-TRIM33 animals than in controls. (B&C) Immunohistochemical analysis identified that the protein levels of TRIM33, p-Smad2 (Ser465/467), Smad2, Smad3, Smad4, vimentin, and N-Cadherin were increased, and levels of E-Cadherin were decreased, in xenograft tumors from the si-TRIM33 group (×100 and ×400 magnification in left- and right-hand side images, corresponding to a scale of 200 and 50 μm, respectively).
Discussion
With the increasing incidence and mortality of GC, it is critical to discover biological markers for the diagnosis, prognostic prediction, and clinical management of this cancer. The TRIM (tripartite motif) protein superfamily currently contains more than 70 protein members that are involved in a wide range of biological processes. Abnormal expression of these proteins often causes many pathological abnormalities, including developmental abnormalities, neurodegenerative diseases, viral infections, and cancer.14,22,23 TRIM33 regulates p53 through ubiquitination, thereby promoting tumorigenesis. 24 However, studies have shown that TRIM33 protein also possesses a cancer inhibitory function, wherein it can act as a ubiquitinated E3 ligase to degrade the β-catenin protein in the nuclei of glioma and bowel cancer cells, in turn inhibiting the WNT signaling pathway. 25 Accumulating evidence has shown that TRIM33 regulates different processes in several malignant tumors. Thus far, TRIM33 has been shown to act as a tumor suppressor gene in various cancers, such as glioma, liver cancer, chronic myeloid leukemia, pancreatic cancer, and breast cancer.26–28 However, TRIM33 has not yet been associated with GC development, especially in the context of the biological behavior of GC cells.
We examined TRIM33 expression in TCGA database and found that TRIM33 was highly expressed in STAD normal tissues (P < .05). Next, the association between TRIM33 expression and the prognosis of patients with GC was analyzed. By comparing the differences in OS, FPS, and PPS between patients with low and high TRIM33 expression, we discovered that low expression levels of TRIM33 were positively associated with a decreased OS and FPS compared with high expression levels. Furthermore, we explored the association between TRIM33 expression and the OS of patients with GC at different pT or pTNM stages; GC patients in the advanced stages (pT3 or pTNM IV) with low expression levels of TRIM33 had significantly worse OS compared with patients with high TRIM33 expression levels in the same stages.
A significant decrease in TRIM33 expression was detected in 2 cell lines transfected with siRNA targeting TRIM33, BGC-823, and SGC-7901 cells. TRIM33 downregulation led to a significant increase in the proliferation of BGC-823 and SGC-7901 cells, as revealed by CCK8 and EdU assays, after 24 and 48 h transfection. Moreover, plate colony assays further confirmed that downregulation of TRIM33 increased the rate of new colony formation. This is consistent with the results reported in liver cancer, leukemia, and other malignant tumors. 2 As it is known that recurrence and metastasis are the main causes of death in patients with advanced GC, we investigated whether TRIM33 downregulation had any effects on the migration and metastasis of GC cells. We performed wound healing assays and found that significantly smaller scratch areas remained for the si-TRIM33 group than for the control group. Transwell assays showed similar findings, the number of migrating cells was higher in the si-TRIM33 group than in the control group. These Transwell and wound healing results were consistent with previous reports 13 suggesting that inhibition of TRIM33 could promote the occurrence of EMT in small-cell lung cancer, and that TRIM33 inhibited EMT by promoting Snoni-like ubiquitination in 293T cells. Other studies have shown that TRIM33 regulates the TGF-β signaling pathway by inhibiting the formation of the Smad nuclear complex, thus changing the proliferative and invasive behavior of malignant tumors. 29 In conclusion, TRIM33 knockdown enhanced the metastasis of the SGC-7901 cell line.
Further experiments were carried out to explore the signaling pathways regulated by TRIM33. Recent studies have revealed that TRIM33 regulates the TGF-β signaling pathway in several cancer types by inhibiting the formation of the Smad nuclear complex.30,31 Thus, we first examined the expression levels of TGF-β, finding that TRIM33 knockdown resulted in a marked increase in TGF-β levels. Next, we examined changes in the expression levels of a series of proteins downstream of TGF-β signaling in response to TRIM33 knockdown. The Smad protein is a direct substrate for TGF-β, and Smad2/3 activates signaling pathways by binding to the TGF-β receptor. Co-Smad, also known as Smad4, is present in vertebrates. This protein cannot be phosphorylated, however it binds to phosphorylated R-Smad and stabilizes its oligomers, which allows the Smad complex to maintain efficient transcriptional activity.32,33 The binding of phosphorylated R-Smad to Co-Smad forms a heterologous complex, which transmits signals from the cytoplasm to the nucleus to regulate a variety of factors inhibiting the synthesis of E-Cadherin and promoting the expression of vimentin. These changes sequentially attenuate cell polarity; tumor cells lose their epithelial features, and gain interstitial features that are conducive to distant metastasis and invasion. 34 After exploring several cancer-related signaling pathways, we identified that TRIM33 could modulate Smad2. Our results showed that after TRIM33 knockdown, the expression of p-Smad2 (Ser465/467), Smad2, Smad3, Smad4, vimentin, and N-Cadherin was upregulated, and the expression of E-Cadherin was downregulated. These findings suggest that the effects of si-TRIM33 on TGF-β signaling likely induce cell growth, and further suggest that TRIM33 regulates biological functions in GC cells through TGF-β signaling. The TGF-β family are a family of key signaling molecules that maintain homeostatic functions related to cell differentiation, proliferation, migration, adhesion, and intercellular signaling.
We established a tumor xenograft model, and performed IHC analysis of the series of proteins downstream of TGF-β/Smad signaling. This analysis showed that in xenograft tumors from the si-TRIM33 group, protein levels of TRIM33, p-Smad2 (Ser465/467), Smad2, Smad3, Smad4, vimentin, and N-Cadherin were upregulated, and levels of E-Cadherin were downregulated, compared to in tumors from the control group. This was consistent with our previous results in GC cells obtained from western blot. Surprisingly, mice in the si-TRIM33 group died of cachexia on days 9, 11, 14, and 19. Combined with the results from our in vitro experiments, we speculate that the cause of death in the si-TRIM33 group may have been the metastasis of tumor cells. In short, these results suggest that TRIM33 may be an important factor in GC proliferation and migration.
Conclusion
In summary, although TRIM33 is highly expressed in GC, it may still function as a tumor suppressor gene. This high expression could be a reactive change to the disrupted balance of TGF-β in tumor tissues.
Thus, this study demonstrated the abnormal expression of TRIM33 in GC, and identified that downregulation of TRIM33 can enhance the proliferation and migration of GC cells. We also showed here that low TRIM33 expression is related to poor prognosis in GC patients.
Footnotes
Author Contributions
Xiangmei Cao and P. Andy Li conceived the design of the present study. Fang Wang, Wenjun Wang, and Xiaoting Wu performed the experiments and data analysis, and contributed to the writing of the manuscript. Wenjun Wang and Xiaoting Wu performed the CCK8, EdU, colony assay, ELISA and western blot experiments. Fang Du performed the database analysis and revised the paper. Hui Xu was involved in the technical aspects of experiments. Zhiguo Lu and Cui Tang performed the Transwell assay and scratch assays, and participated in photo collation. Zhuoyang Zhang revised the paper and checked the data. Xiaoting Wu performed the data analysis in the KM-plotter and TCGA databases. Xiaoting Wu and Zhiguo Lu performed the tumor xenograft model and histological experiments.
Data Availability
The data used to support the findings of this study are included within the article.
Declaration of Conflicting Interests
The authors declared no potential conflicts of interest with respect to the research, authorship, and/or publication of this article.
Funding
The authors disclosed receipt of the following financial support for the research, authorship, and/or publication of this article: The National Natural Science Foundation of China (grant numbers 81560501, 81860442, and 62062058); The National Natural Science Foundation of Ningxia (grant number 2021AAC03126); First-Class Discipline Construction Founded Project of NingXia Medical University; and the School of Clinical Medicine.
Ethical Approval
All animal procedures were conducted following the Guide for the Care and Use of Laboratory Animals in the Chinese Laboratory Animal Use Regulations and were approved by the Institutional Animal Care of Ningxia Medical University, and the Ethics Review Committee of Ningxia Medical University General Hospital (KYLL-2021-419).