
Abstract
Introduction
Pulmonary sarcomatoid carcinoma (PSC) is a rare and aggressive type of lung cancer, accounting for approximately 0.1% to 0.4% of all lung malignancies1 and approximately 1% of non-small-cell lung cancers (NSCLCs).2 According to the World Health Organization (WHO) classification in 2015, PSCs can be categorized into the following 5 subgroups: pleomorphic carcinoma, spindle cell carcinoma, giant cell carcinoma, carcinosarcoma, and pulmonary blastoma.3 PSCs have poorly differentiated pathological features, reflecting their unfavorable prognosis, and tend to have a poor prognosis irrespective of the stage of disease, with a median overall survival (OS) ranging from 8 to 19 months and a 5-year survival rate ranging from 17% to 29%,4–6 presenting relatively worse clinical outcomes than NSCLC.7 Because of its inherent rarity, there have been limited systematic reports describing its clinical manifestation, treatment and prognosis, and there were no significant differences in malignant behavior compared with NSCLSs. The patterns and incidence of distant metastasis of PSCs, especially the brain, bone, adrenal gland, lung and liver, are considered to be found in the majority of diagnosed patients.8,9 Surgical resection, when feasible, is considered the main treatment, and the role of chemoradiotherapy is controversial and rarely effective.10
The prognosis of these patients remains controversial. To date, the most important prognostic factors for PSC have been proposed by the American Joint Committee on Cancer (AJCC) staging system, which is based on the depth of tumor invasion (T), the number of metastatic lymph nodes (N), and distant metastases (M). According to the AJCC staging system, age and therapeutic approaches were not involved, which might affect survival. Thus, we need a dedicated clinical model to accurately estimate the prognostic outcome for patients with PSC. Recently, the nomogram, which is specific to an individual patient, has been considered a commonly viable predictive model by graphical calculation, incorporating all the effective clinical features, and has been widely used to estimate the prognosis in multiple malignancies.11 Therefore, we constructed a survival nomogram to predict the prognosis of PSC patients.
The Surveillance, Epidemiology, and End Results (SEER) database is a U.S. population-based cancer database that provides profusion and integral information for different cancers from 20 cancer registries covering ∼28% of the population.12 Given the rarity of PSCs and the resulting prognostic data, we sought to better understand PSCs by the SEER database. To meet current clinical needs, our study sought to establish and validate a nomogram to predict the survival of PSC patients based on SEER data.
Methods
Patients and Study Design
Information on patients diagnosed with PSC, lung adenocarcinoma (LADC) and lung squamous cell carcinoma (LSCC) from 2010 to 2016 was retrieved from the SEER 21 registry database using SEER*Stat 8.3.5 software. Among 134 903 patients diagnosed with PSC (ICD-O-3 8022/3, 8031/3, 8032/3, 8980/3), LADC (ICD-O-3 8040/3, 8144/3, 8230/3, 8250/3, 8253/3, 8254/3, 8333/3, 8480/3, 8551/3), and LSCC (ICD-O-3 8070/3, 8071/3, 8072/3, 8083/3) were identified from the SEER database. Patients with unknown information about race, tumor stage, surgery status, metastatic status, and follow-up information were excluded. Finally, a total of 400 cases with PSC, 58 474 cases with LADC and 33 637 cases with LSCC without missing values were assigned as training sets (Figure 1).

Flow chart of patients’ cohort selection. Abbreviations: PSC, pulmonary sarcomatoid carcinoma; LADC, lung adenocarcinoma; LSCC, lung squamous cell carcinoma.
Demographic or clinical information, including age, sex, race, pathological characteristics of tumors, treatments and distant metastasis (bone, brain, lung, and liver), was extracted from the SEER database. The clinical characteristics of the patients included age (<50, 50-69 and ≥70 years), sex (male, female), and race (white, black, others). The pathological characteristics of the tumors included the primary site (main bronchus, upper lobe, middle lobe, lower lobe, others) and T stage (T0, T1, T2, T3, T4), N stage (N0, N1, N2, N3), and disease stage according to the seventh edition of the AJCC classification (I, II, III, IV). The treatments included surgery (yes, no), radiotherapy (yes, no/unknown) and chemotherapy (yes, no/unknown).
The primary outcome was OS, which was defined as the duration from diagnosis to death, regardless of the cause of death, or was censored at the date of the last follow-up evaluation. The follow-up time was recorded as the period from the last day of the available survival information or the day of diagnosis to death. The information of OS updated to 2016 in SEER database.
Statistical Analysis
Demographic and clinical characteristics of the patients with PSC, LADC, and LSCC were compared using Pearson's chi-squared test or Fisher's exact test. OS was estimated using the Kaplan–Meier method by log-rank test with ggplot2, survminer, and survival packages in R software version 3.6.0. After meeting the proportional hazards (PHs) assumption, adjusted hazard ratios (HRs) with 95% confidence intervals (CIs) were calculated using Cox PHs regression models to estimate prognostic factors associated with OS. SPSS (26.0) was used for statistical analysis in this study, and all P values less than .05 were statistically significant.
Development of the Nomogram
On the basis of the results of the multivariable analyses, a nomogram was constructed that can provide visualized risk prediction using survival. We used univariate and multivariable Cox regression analyses to screen out risk factors and independent prognostic factors for OS, including age, T stage, and disease stage according to the seventh edition of the AJCC classification, and surgery and radiation, based on the SEER database. Nomograms for 1-, 3- and 5-year OS were constructed on the basis of the identified independent prognostic factors. We then developed a novel visual nomogram.
Validation of the Nomograms
The accuracy of the nomogram was assessed by discrimination and calibration evaluation. Harrell's concordance index (C-index) and decision curve analysis (DCA) were used to evaluate the predictive accuracy of the nomogram. The C-index was defined as the ratio of all patient pairs predicted to be consistent with the results. Furthermore, 1-, 3-, and 5-year receiver-operating characteristic (ROC) curves were used to assess the predictive accuracy of the constructed nomogram. DCA is a method for evaluating alternative diagnostic or prognostic tools and can be used to visualize the clinical consequences of a treatment method;13 thus, DCA was carried out to help us more intuitively understand the value of the nomogram in this study. In addition, to verify the independent discriminatory ability of the nomogram, the patients were divided into high-, moderate-, and low-risk groups according to their total risk score by X-tile. Survival curves for different risk groups were generated using Kaplan–Meier analyses and were detected using the log-rank test. Based on the above, we further plotted clinical impact curves to evaluate the clinical impact of the nomograms to help us more intuitively realize their significant value. The nomogram for predicting OS demonstrated that cost/benefit ratios were lower when the risk threshold was less than 0.3 (Figure 2B)

DCA for nomograms (A). In the figure, x-axis is the threshold probability, y-axis is the net benefit rate. “All” refers to the assumption that all patients reached the endpoint and “none” to the hypothesis that no patients reached the endpoint. Clinical impact curves of the nomograms for OS (B) in PSC patients. The number of high-risk patients and the number of high-risk patients with the outcome are plotted at different threshold probabilities within a given population. Abbreviations: OS, overall survival; DCA, decision curve analysis; PSC, pulmonary sarcomatoid carcinoma.
Results
Patient Characteristics
The demographic or clinical characteristics of the patients are presented in Table 1. We identified 400 eligible patients diagnosed with PSC from 2010 to 2016 and 58 474 and 33 637 patients diagnosed with LADC and LSCC, respectively, in the SEER database. Among the patients with PSC, 31 (7.75%), 194 (48.50%) and 175 (43.75%) patients were aged <50, 51 to 69 and ≥70 years old at diagnosis, respectively. By comparison, more LADC patients were 51 to 69 years old (51.95%, P < .01), and more LSCC patients were aged ≥70 years (51.23%, P < .01) at diagnosis. Among PSC patients, 58.25% were male, and 41.75% were female, compared to 46.79% of patients who were male and 53.21% of patients who were female among LADC patients, and 62.10% who were male, and 37.90% who were female among LSCC patients. The majority of PSC patients were white, with tumors located in the upper lobe, and their disease stage was more advanced. In detail, more PSC patients than LSCC patients had stage T3 disease (33.25% vs 23.81%, P < .01). Moreover, compared to LADC patients, more PSC patients had stage T3 disease, and fewer patients had stage T1 disease (33.25% vs 19.86%, 12.25% vs 28.08%, P < .01). PSC patients were more frequently diagnosed with N0 and N2 stages of disease and less frequently diagnosed with N1 and N2 stages of disease. Significantly more PSC patients than LADC patients had stage II and III disease (20.50% vs 8.76%, 22.75% vs 17.74%; P < .01), and more PSC patients than LSCC patients had stages II and IV of disease (20.50% vs 14.66%, 40.25% vs 30.06%; P < .001). Approximately half of the PSC patients underwent surgery and chemotherapy, while one-third received radiation. Fewer LADC and LSCC patients were treated with surgery than PSC patients, but they received more radiotherapy.
Demographic and Clinical Characteristics of Patients With PSC, LADC, and LSCC.

Abbreviations: PSC, pulmonary sarcomatoid carcinoma; LADC, lung adenocarcinoma; LSCC, lung squamous cell carcinoma. P-value*: Comparison between PSC with LADC. P-value**: Comparison between PSC and LSCC.
Survival
The OS for patients with PSC, LADC, and LSCC can be illustrated by Kaplan–Meier plots (Figure 3). PSC patients exhibited a worse OS than the other patient groups (P < .001, Figure 4, Table 2). The survival analyses also showed that older patients had much poorer survival than younger patients (P = .0045, Figure 5A). In addition, the OS of PSC patients with an advanced T stage was significantly shorter than that of PSC patients with a low-T stage (P < .0001, Figure 5B). Moreover, these patients had a better prognosis according to the earlier seventh edition of the AJCC guidelines (P < .0001, Figure 5C). Patients who underwent surgery had better OS than those who did not (P < .0001, Figure 6A). Similar to surgery, the prognosis of patients receiving radiation was much better than that of patients without radiation (P = .014, Figure 6B).

The Kaplan–Meier overall survival in PSC, LADC, and LSCC. Abbreviations: PSC, pulmonary sarcomatoid carcinoma; LADC, lung adenocarcinoma; LSCC, lung squamous cell carcinoma.
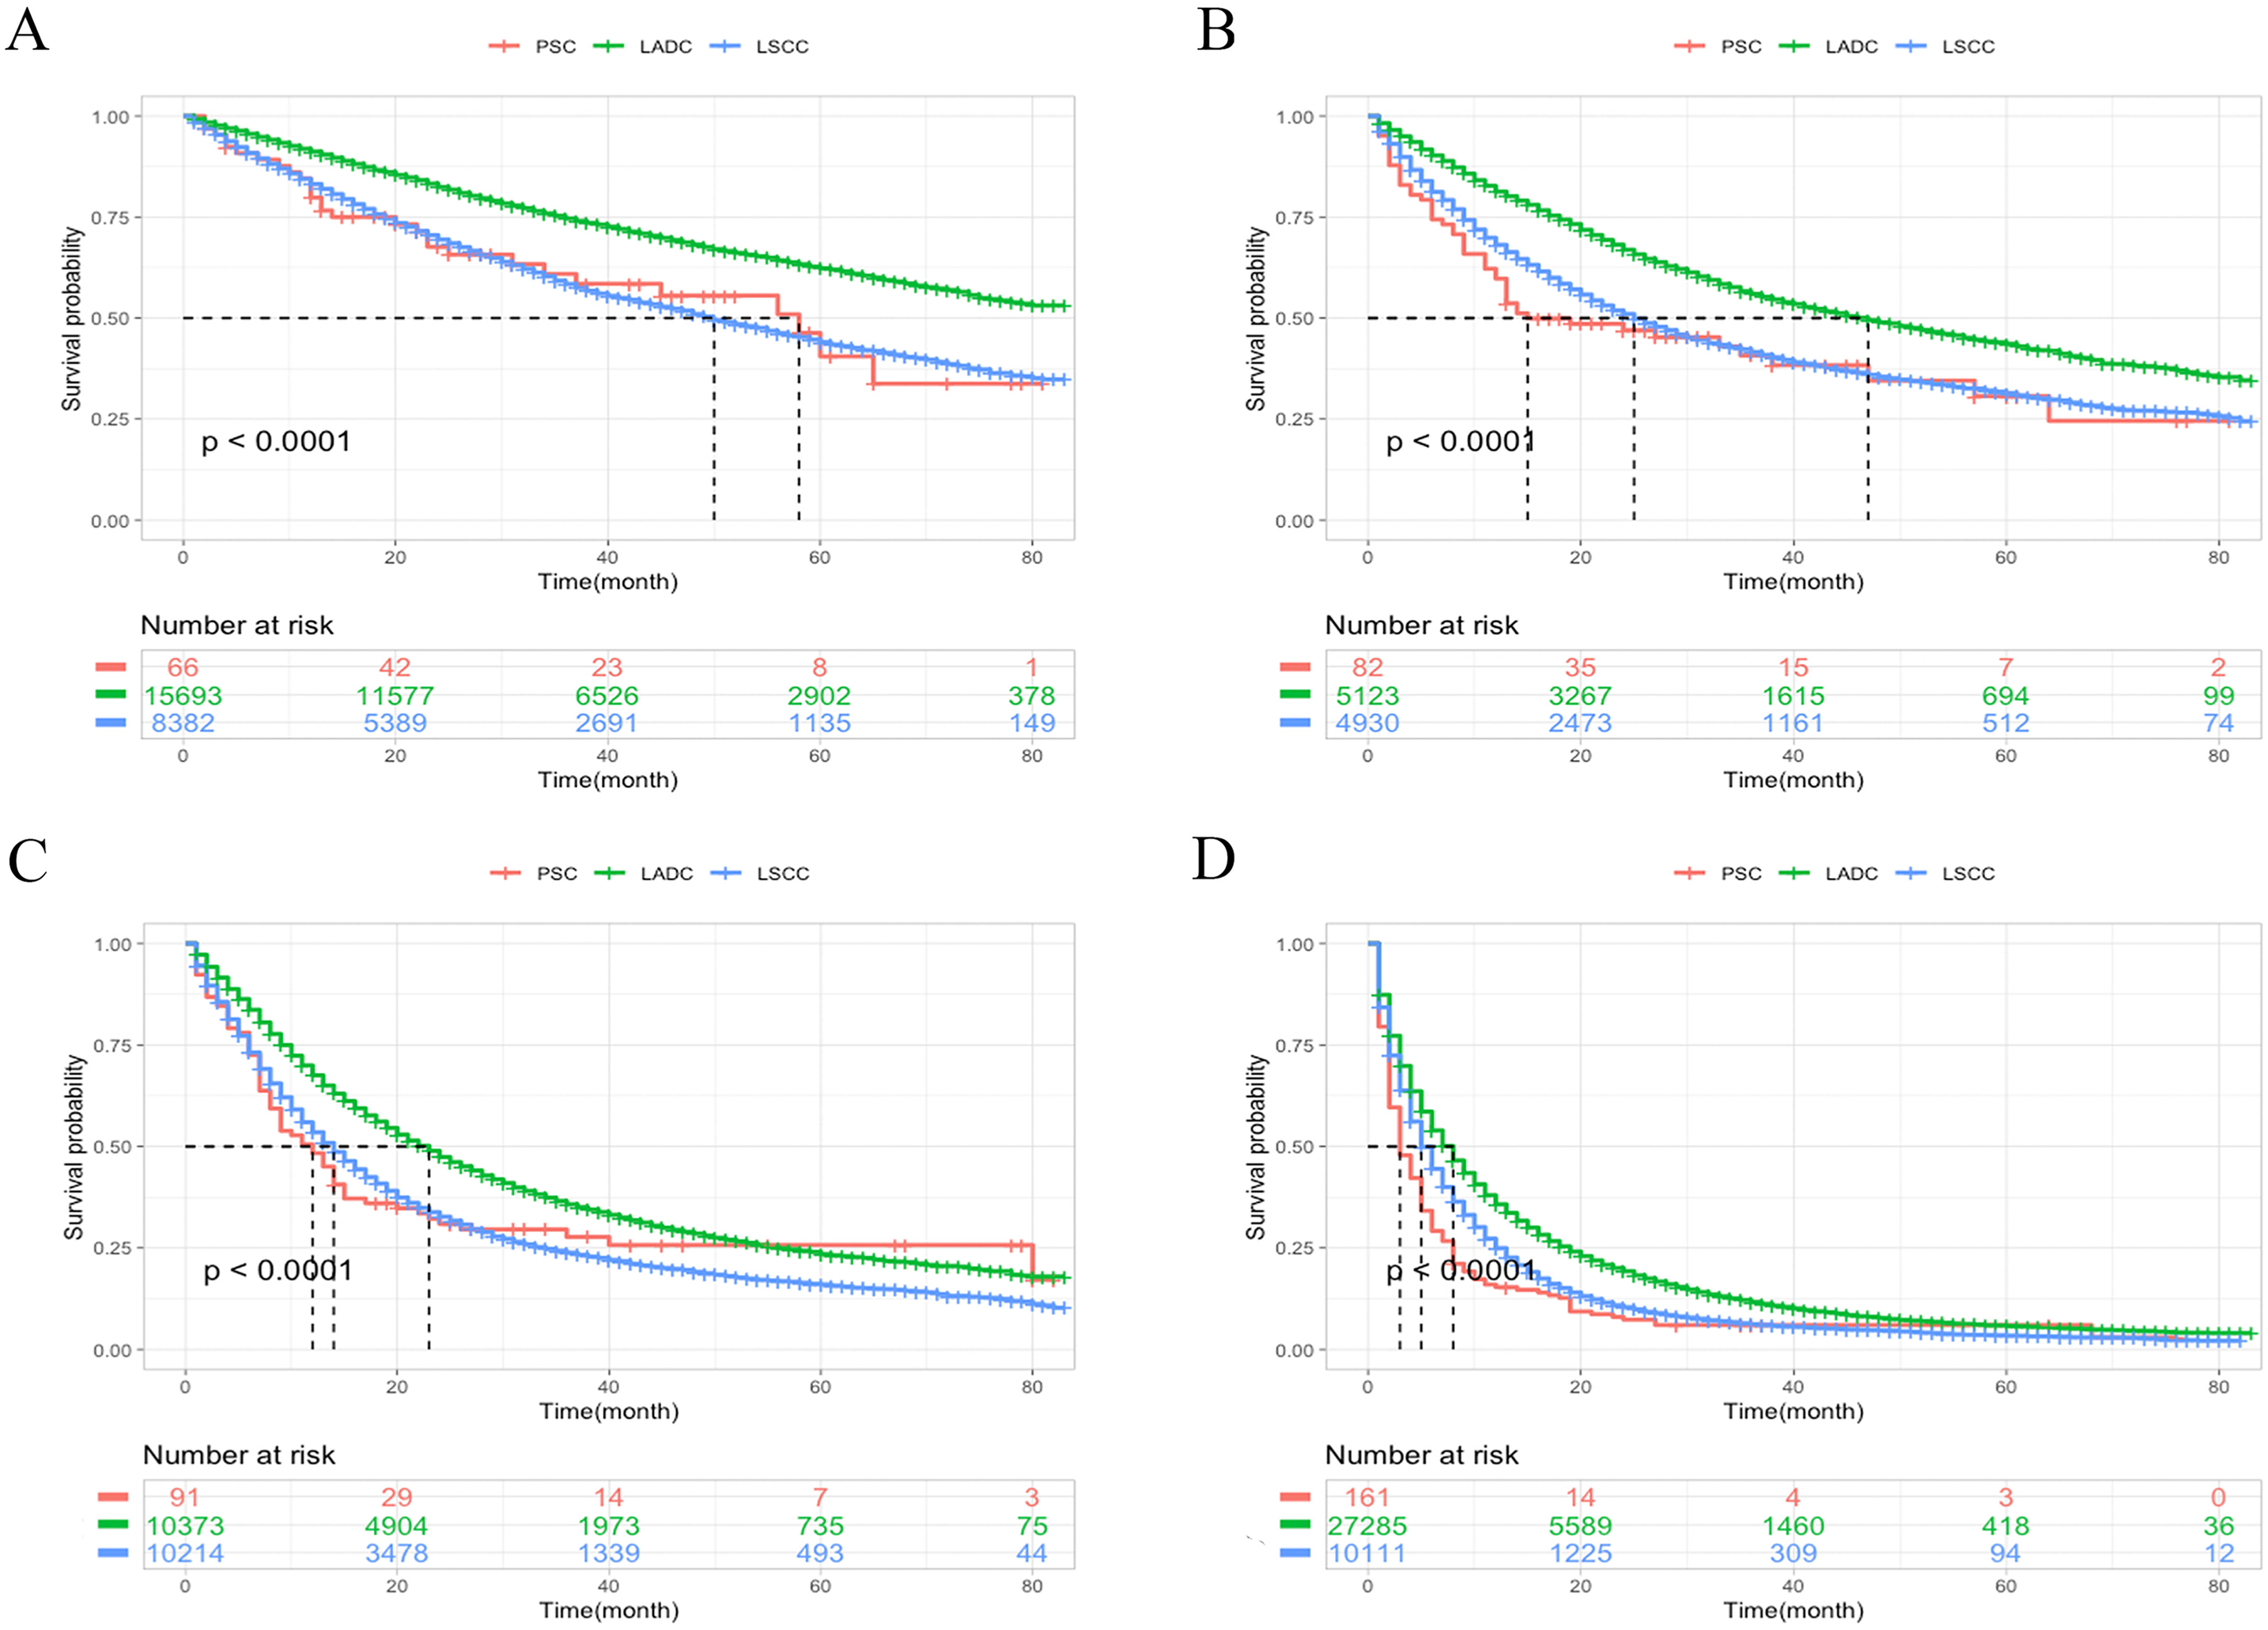
The Kaplan–Meier overall survival for different stages according to the seventh edition of the AJCC in PSC, LADC and LSCC. Stage I (A), stage II (B), stage III (C), stage IV (D). Abbreviations: AJCC, American Joint Committee on Cancer; PSC, pulmonary sarcomatoid carcinoma; LADC, lung adenocarcinoma; LSCC, lung squamous cell carcinoma.

Kaplan–Meier analysis of OS in PSC patients stratified by age (A), seventh AJCC T stage (B), disease stage according to the seventh edition of the AJCC (C). Abbreviations: AJCC, American Joint Committee on Cancer; OS, overall survival; PSC, pulmonary sarcomatoid carcinoma.

Kaplan–Meier analysis of OS in PSC patients stratified by surgery (D), radiotherapy(E). Abbreviations: OS: overall survival; PSC, pulmonary sarcomatoid carcinoma.
Survival Probabilities of Each Stage in PSC, LADC, and LSCC.

Abbreviations: LCNEC, large-cell neuroendocrine carcinoma; Ref., Reference; NA, not available; CI, confidence interval; LSCC, lung squamous cell carcinoma; PSC, pulmonary sarcomatoid carcinoma; LADC, lung adenocarcinoma; OS, overall survival.
In the SEER cohort, the median survival times from diagnosis were 9, 20 and 15 months for PSC, LADC, and LSCC patients, respectively, and 58 months for PSC patients with stage I disease, 15 months for patients with stage II disease, 12 months for patients with stage III disease and 3 months for patients with stage IV disease. All patients in stage IV had a poor prognosis. Since more than half of stage I LADC patients are still alive after the end of follow-up, the median survival time was not reached.
Features Influencing Prognosis
Univariate and multivariate Cox regression models identified the clinicopathological factors that were independently correlated with prognosis in OS for patients with PSC, namely, age at diagnosis (P < .01), T stage (P < .01), disease stage according to the seventh edition of the AJCC guidelines (P < .01), surgery (P < .01) and radiation (P < .01, Table 3). Moreover, the multivariate analysis showed that patients aged 70 years or older had a worse OS than patients younger than 50 years (HR: 2.07, 95% CI: 1.23-3.50). Advanced T stage and advanced disease stage according to the seventh edition of the AJCC guidelines were risk factors for PSC patients. Patients who both underwent surgery and received radiation had a better prognosis than those who did not (HR: 2.29, 95% CI: 1.64-3.20, P < .01; HR: 1.43, 95% CI: 1.10-1.86, P < .01).
Univariate and Multivariate Cox Regression Analysis of Prognostic Factors in Overall PSC Patient Cohort.

Abbreviations: CI, confidence interval; HR, hazard ratio; PSC, pulmonary sarcomatoid carcinoma; LADC, lung adenocarcinoma; LSCC, lung squamous cell carcinoma; AJCC, American Joint Committee on Cancer.
Difference in Metastatic Patterns Among the 3 Histological Types
The common metastatic sites of PSCs were bone (12.8%), lung (12.3%), brain (10.8%), and liver (3.8%) (Table 4, Figure 7). Among the patients with metastatic disease, PSC patients had significantly fewer bone (P < .01), liver (P < .01), and brain (P = .03) metastases than LADC patients. In addition, LSCC patients had different metastatic patterns than patients with PSC, who had significantly more bone (P = .02) and brain (P < .01) metastases.

Frequencies of each matastasis in PSC, LADC, and LSCC. Abbreviations: PSC, pulmonary sarcomatoid carcinoma; LADC, lung adenocarcinoma; LSCC, lung squamous cell carcinoma.
Frequencies of Each Metastasis in PSC, LADC, and LSCC.

Abbreviations: PSC, pulmonary sarcomatoid carcinoma; LADC, lung adenocarcinoma; LSCC, lung squamous cell carcinoma. P-value*: Comparison between PSC with LADC. P-value**: Comparison between PSC and LSCC.
Development of the Nomogram and Risk Stratification Model
Based on the selected significant parameters via the Cox regression model, a prognostic nomogram was established for OS (Figure 8). The nomogram showed that T stage contributed the most to prognosis (T4: score 100; T3: score 96; T2: score 72, T1: score 3), followed by disease stage based on the seventh edition of the AJCC guidelines (IV: score 75, III: score 22, II: score 5), surgery (no surgery: score 68), age (≥70: score 55; 50-69: score 25), and radiation (no/unknown radiation: score 32). After summing the scores associated with each variable and projecting the total scores to the bottom scores, a patient's probability of individual survival can easily be calculated at each time point. Furthermore, a risk stratification system was established based on each patient's total scores from the nomogram to stratify all patients into 3 risk subgroups: low-risk group (total score < 200), intermediate-risk group (total score, 200-249), and high-risk group (total score, ≥ 250). In addition, the median survival times of the low-, intermediate- and high-risk groups were 38.0, 6.0 and 4.0 months, respectively, and Kaplan–Meier methods indicated that the risk stratification model could differentiate survival outcomes among the 3 groups (P < .0001, Figure 9).

Prognostic nomogram including significant clinical characteristics for 1-year, 3-year, and 5-year OS in PSC patients. Abbreviations: OS, overall survival; PSC, pulmonary sarcomatoid carcinoma.

Survival analysis using the Kaplan–Meier approach identified a nomogram score.
Validation and Clinical Performance of the Nomogram
For PSC patients, the C-index of the nomogram in the validation set was 0.759 (95% CI, 0.738-0.786). To confirm that the nomogram could effectively predict the prognosis of PSC patients, time-dependent ROC analyses at 1, 3 and 5 years were conducted. The 1-, 3-, and 5-year area under the curve (AUC) values of the nomogram for the prediction of OS were 0.827, 0.826, and 0.8 (Figure 10A-C), respectively. Both the C-indexes and AUC values suggested that these models made accurate predictions and had good discriminative abilities. The calibration curves for the probability of 1-, 3-, and 5-year OS demonstrated good consistency between the nomogram prediction and actual survival in the training cohort (Figure 10D-F).

ROC curves. The ability of the model to be measured by the C-index. 1-year OS (A), 3-year OS (B), 5-year OS (C). Calibration curves of the nomograms predicting OS in PSC patients. 1-year OS (E), 3-year OS (D), 5-year OS (F). Abbreviations: AUC, area under the curve; OS, overall survival; ROC, receiver-operating characteristic.
The DCA results of the nomogram demonstrated the good clinical applicability of the nomogram in terms of 1-, 3-, and 5-year patient survival (Figure 2A). Based on the above, we further plotted the clinical impact curve to evaluate the clinical impact of the nomogram to help us more intuitively realize its significance. The nomogram for predicting OS demonstrated that cost/benefit ratios were lower than those when the risk threshold was less than 0.3 (Figure 2B).
Discussion
To date, few systematic reports have focused on PSC due to the inherent rarity of this disease. We reviewed a large national database for the clinical characteristics and outcomes of this tumor. PSCs are mostly larger than 3 cm, with many of them being massive in size, and they most often present as solitary masses in the upper lobes.14 But there is no difference in laterality. Similar to NSCLC patients, PSC patients of advanced age had worse survival, as previously reported.9,14–16 Our analysis confirmed this; we observed a higher disease prevalence in the upper lobe, and the T stage was found to be the crucial prognostic factor for PSC. In addition, an elderly age has a significant influence on prognosis. To our knowledge, this is the first study to describe the differences between PSC and other NSCLCs in terms of distant metastasis. For metastatic patients, the most common metastatic site was bone, followed by lung, brain, and liver for PSC and LADC patients, while for LSCC patients, the most common site was lung, followed by bone, liver, and brain.
In our study, we showed that PSC is an aggressive, uncommon variant of NSCLC with worse outcomes than LADC and LSCC. The median survival time of PSC patients was 9 months less than that of patients with LADC and LSCC; the 1-year survival rate was 42%, and the 3- and 5-year survival rates were 27% and 21%, respectively. Prior case series have reported a short median survival, ranging from 8 to 19 months4–7,9,17–20 for PSC patients, which is inferior to other NSCLCs. Moreover, PSC patients present with a more advanced stage and worse survival outcomes than LADC and LSCC patients. Patients have typically already reached moderate to advanced disease stages at the time of diagnosis.20 Similarly, most patients in our study were diagnosed with stage III/IV disease according to the seventh edition of the AJCC classification, reflecting worse survival.
It is integral to consider the risk of mortality of PSC. In this study, both surgery (P < .01) and radiation (P < .01) had a significant impact on prognosis. Early surgery is the preferred treatment for PSC in the early stage. Because of the lack of specific radiologic characteristics and its highly aggressive nature, patients are diagnosed with PSC in advanced disease stages, and surgery is not a viable treatment. For earlier-stage PSCs, surgical resection is an effective treatment and provides adequate control,21–23 although these patients tend to experience relapse even after complete resection.24 As previously reported,6,16 radiation therapy improved the 5-year survival rate among patients receiving adjuvant radiation. Although another study reported a decreased survival rate for patients receiving radiation,25 we found received radiation seemed to have a better performance in survival outcomes. Hence, the role of radiation in the outcomes still needed further exploration. Drug resistance can occur with chemotherapy in a short time, resulting in tumor recurrence.26 Because of the poor prognosis of PSC and considering that there is not enough evidence to show the validity of chemotherapy, the identification of an effective chemotherapy regimen is important, and optimal treatments for PSC still need to be determined.27 However, other studies have confirmed that an ordinary NSCLC chemotherapy response was favorable.22 Due to the small number of patients and individual differences, these data are not sufficient evidence that chemotherapy is ineffective. In previous SEER based studies, chemotherapy was improved the survival in stage II to III patients with PSC, but not stage I patients.28 Therefore, the efficacy of chemotherapy needed further defined. In addition, high PD-L1 expression in some PSC patients has been reported,29,30 suggesting that targeting PD-1/PD-L1 might be a potential treatment regimen for PSC. Hence, the role of PD-1/PD-L1 inhibitors in the outcomes still needed further exploration. Currently, there are no standardized management protocols for PSC, and surgical resection for localized PSC is the preferred standard treatment by most guidelines, which is consistent with our study. Although our study implies that chemotherapy should not be routinely delivered and radiation could be selected for palliative antitumor therapy, these findings are still controversial and need future evaluation by randomized controlled trials, as with prior case series.
Patients prognosis is reflected by the seventh edition of the AJCC staging system which provides the guidelines for the classification of cancer.31 However, some important clinical parameters influencing OS, such as age, sex, race, and treatment, are not included in these guidelines. We identified that age, T stage and disease stage according to the seventh edition of the AJCC classification, and surgery and radiation were significantly associated with OS in the SEER database. We, therefore, implemented a more comprehensive prognostic model in the form of a nomogram. This nomogram includes not only the AJCC staging system but also systemic demographics and other important clinical parameters, which are easily obtained and collected through historical clinical records. Moreover, the nomogram achieved satisfactory accuracy and good reliability and reproducibility, as indicated by the C-index, ROC curve, and DCA. The obtained results suggest that we successfully constructed a reliable nomogram for predicting the 1-, 3-, and 5-year OS of PSC patients, as the nomogram validation demonstrated favorable discrimination and calibration. The clinical value of this nomogram could be feasibly applied to predict the survival probability of each individual patient. A risk stratification model that could accurately stratify PSC patients into 3 risk subgroups was generated on the basis of each patient's total scores from the nomogram, and the survival benefits were analyzed for each risk group. Furthermore, high-risk patients were recognized by the risk stratification system as those who might benefit from more intensive therapy (eg, radiation). In addition, these patients can be provided with more psychological or palliative care and encouraged to participate in clinical trials for novel drugs, such as immune checkpoint inhibitors. Not least is the fact that a patient may be provided with an objective assessment by a doctor regarding the future course of their disease and given standard management.
Other nomograms have been validated to predicated the OS of PSC patients in previous studies.32,33 In our study, a risk stratification system was established based on each patient's total scores from the nomogram to stratify all patients into risk subgroups. The nomogram can be more convenient and faster to use than others. In addition, we used C-index, ROC curve, and DCA which make our nomogram more believable than others. What's more, we successfully constructed a reliable nomogram for predicting the 1-, 3-, and 5-year OS of PSC patients, but there is only 1-year OS in Chen's study.32 We believe our nomogram predicted the prognosis of PSC and performed better than others. However, the nomogram still requires further confirmation.
Although the nomogram shows good performance, this study still has several limitations. First, the SEER database was retrospective, and patients with incomplete data were excluded. Second, some potential prognostic parameters, such as molecular classification, should be evaluated to improve the nomogram in future work. Third, the majority of enrolled patients were white or black, so the nomogram needs to be validated externally with other cohorts, especially Chinese patients. Fourth, the results of this study would be more meaningful if the nomogram model was externally validated by another real-world, independent, large-scale, high-quality cohort, which would prove that our findings could be more widely acceptable. Thus, larger and prospective studies with more prognostic variables are needed to improve our predictive model. Despite these limitations, our prognostic nomogram is an instructive and efficient model for accurately predicting individual survival outcomes for PSC patients.
Conclusion
In conclusion, using a large population-based cohort from the SEER database, we described the special clinical and prognostic characteristics of PSC. Older age, advanced stage, surgery, and radiation were identified as negative prognostic factors of PSC. Based on the clinical risk factors, we constructed and validated a prognostic nomogram for PSC that has relatively good accuracy. Moreover, the validation process indicated that the current nomogram provides more efficient OS predictions for PSC patients than other currently available methods. We believe that this simple nomogram could be an easy-to-use and beneficial tool for clinicians to promote personalized survival predictions and to guide clinical decision-making for PSC patients.
Footnotes
Acknowledgments
The authors thank the staff at the SEER, and all the patients who participated in the study.
Author Contributions
Yuanyuan Xie and Lizhong Gu participated in the overall design of the study, interpretation of results, and drafting of the manuscript. Zhiyong Lin contributed to statistical analysis. Sun Xiang and Haochun Shi contributed to the study design and data collection. All authors read and approved the final paper.
Declaration of Conflicting Interests
The author(s) declared no potential conflicts of interest with respect to the research, authorship, and/or publication of this article.
Funding
The author(s) received no financial support for the research, authorship, and/or publication of this article.
Ethical Approval
The authors state that this article does not contain any studies with human participants or animals so exempt from institutional review board approval. Informed consent from study participants was not required as this was a retrospective analysis of an existing database.