
Abstract
Keywords
Introduction
Radiation therapy is a common intervention for a variety of brain tumors in both primary and adjuvant settings. However, patients with aggressive and/or recurrent tumors may encounter limited utility or unacceptable risk from radiation therapy interventions. 1 This is especially true in recurrent, previously irradiated tumors as repeated therapeutic courses confer an increased risk of local tissue damage as well as reduced efficacy, due to the more aggressive characteristics of recurrent tumors and the limitations in dosing and target coverage with reirradiation.2,3 In recent years, stereotactic radiosurgery4,5 and multiple intraoperative radiation therapy options6-9 have emerged as potential therapeutic options for patients with aggressive tumors with many studies10,11 assessing the advantages and disadvantages of one modality over the other. Brachytherapy (BT) is an alternative intraoperative radiotherapy option that has shown promising clinical outcomes in patients with a variety of intracranial neoplasms.12-16 Compared to external beam radiation therapy (EBRT), BT utilizes low-energy isotopes with steep dose fall-off characteristics, allowing a higher local dose while simultaneously exposing a smaller volume of healthy brain tissue to irradiation. 17 When used intraoperatively, targeting of BT by the surgeon, who has direct visualization and access to the relevant anatomy, may result in more accurate and precise localization than EBRT. Additionally, the ability to initiate radiation therapy immediately following tumor removal may potentially result in a more optimal therapeutic ratio.18,19
While accurate radiation seed placement and spacing are crucial to the efficacy and safety of the intervention, procedures for implantation differ across institutions.14,20,21 Direct tissue implantation of seeds, singular or multiple sources, and the use of stranded seeds in either a woven resorbable mesh or linear suture material have been the most commonly reported techniques.14,21 Drawbacks to these approaches include but are not limited to direct seed-to-brain contact, variable intersource spacing, prolonged operating room time (and thus staff exposure), and postplacement seed migration.3,21-24
In 2018, the U.S. Food and Drug Administration (FDA) cleared a permanently implanted surgically targeted radiation therapy (STaRT) device consisting of cesium-131 (Cs-131) seeds embedded within a collagen carrier tile (GammaTile, GT Medical Technologies) to deliver radiation therapy in patients with newly diagnosed or recurrent malignant intracranial neoplasms. The collagen tiles function as both a seed carrier and a spacer to prevent direct contact between the radiation source and the brain tissue, while mechanically assisting seed implantation and source array. 4 These Cs-131-containing collagen tiles were shown to be safe and provide local disease control in patients with either recurrent or previously untreated brain tumors enrolled in a prospective, multihistology single-arm trial.13,25,26
In the current study, we quantified the migration of Cs-131 seeds embedded in the collagen carrier using computed tomography (CT) and cone-beam CT (CBCT) imaging and the resulting dosimetric impact of migration while accounting for radioisotope decay. We also investigated the dosimetric differences between Cs-131 and iodine-125 (I-125), a radioisotope commonly used in permanent intracranial BT, and palladium-103 (Pd-103), another potentially useful intracranial BT isotope, when implemented in conjunction with the same collagen seed carrier (with a given seed geometry).
Materials and Methods
The patients evaluated in this retrospective analysis of dosimetric outcomes and seed migration were a subgroup of the 120 patients enrolled in a prospective, nonrandomized, all-histology clinical trial (NCT03088579) of intraoperative BT with Cs-131-containing collagen tiles (GammaTile, GT Medical Technologies) conducted at a single tertiary care center in the United States between June 2013 and October 2016. Signed informed consent forms were obtained from all participants prior to enrollment (St Joseph's Hospital and Medical Center IRB#13RT022). The reporting of this study conforms to STROBE guidelines. 27
Twenty patients who had undergone intraoperative BT with the Cs-131-containing collagen tiles and who had available follow-up CT scans with sufficient quality to be entered into the treatment planning system (TPS) were retrospectively analyzed for this study. The technique for collagen tile creation has been described previously. 13 In brief, the collagen carrier (Figure 1) serves 2 functions: (1) it allows precise intraoperative placement of multiple seeds in suture spaced 1 cm apart and (2) it functions as a 3-dimensional spacer and implanted tissue compensator optimizing interseed spacing and preventing direct contact of seeds with brain tissue. The collagen tile carrier/spacer provides approximately a 3-mm offset between the long axis of the seeds and brain tissue (Figure 1B-D).

(A) A transilluminated prepared 25 × 25 × 4 mm tile with vicryl suture containing cesium-131 (Cs-131) seeds at 1 cm intervals embedded (vicryl seen as blue threads at ends of tile and lines in transilluminated tile). (B) The side profile of the collagen tile shown in (A), (C), and (D) depicts the surface differences on either side of the collagen tile, with one side having a relatively smooth surface (C), compared to the opposing side which contains surface indentations (D). Note also the difference in source/strand offset from the surfaces; the nominal offset is 3 mm from the side with indentations and 1 mm from the smooth side.
The implantation technique has been previously described in detail.13,25 Briefly, the surface area of the expected postoperative resection bed and the number of seeds needed were estimated from the preoperative magnetic resonance images (MRI) and ordered in advance. During resection, the Cs-131-containing collagen squares (referred to as “tiles”) were constructed using a shielded handheld loader (GT Loader, GT Medical Technologies Inc.) with the radioactive sources equally spaced symmetrically 1.0 cm apart, and an asymmetric spacing of source depth with a 0.3 cm offset from the bumpy side of the tile surface (ie, 0.3 cm from a radiation source to bumpy side tile surface vs 0.1 cm from the smooth side) (Figure 1). After maximum safe resection, the tumor bed was lined with the tiles; if frozen section pathology disclosed only radiation necrosis, implantation was not performed. Wound closure was accomplished in the usual manner, with the reuse of native cranium whenever possible. The Cs-131-containing collagen tiles are designed to deliver a nominal dose of 60 Gy 13 to the high-risk clinical target volume, defined as a 5-mm expansion of the resection cavity wall plus residual gross tumor volume.
Dose Calculations
Postimplant dose distributions were calculated using the BrachyVision (Version: 15.6, Varian) TPS. TPS commissioning was carried out similar to what was previously described 28 for Cs-131 (CS-1, rev 2, IsoRay Medical Inc.). The radioisotope was configured in the TPS by entering relevant seed information, such as half-life (t1/2), source geometry (point vs line) and corresponding active source dimensions, calculation model (point vs linear source), dose rate constant, kerma to activity conversion factor, radial dose function, and anisotropy function, using previously published data. 29 TPS-calculated dose to water for point and line source (LS; per Task Group [TG] 43U1 29 ) geometries were compared to manually calculated doses using an in-house spreadsheet. Once the TPS was commissioned for the specific radioisotope seed, only seed location identification in the postimplantation CT was required to proceed with dose calculations.
Impact of Seed Migration and Decay on Dose
To evaluate the robustness of seeds implanted in a collagen carrier, we retrospectively identified a subset of 7 patients who underwent subsequent image-guided radiation therapy (IGRT) following Cs-131 BT. All patients had glioblastoma and immediately prior to tile placement had undergone subtotal resection (N = 4) or gross total resection (N = 3) as judged by postoperative MRI. For each patient, the planning CT obtained for EBRT (slice thickness: 1.5-3 mm) and the subsequent onboard kilovoltage (kV) CBCT images (slice thickness: 2 mm) used for IGRT were identified and coregistered to the postseed implant CT in Eclipse (Varian). Updated seed positions as depicted on these image sets acquired 7 to 57 days after seed implantation were manually identified by a single user by ensuring one-to-one correspondence of seeds across image sets. A total of 47 image sets were analyzed, tracking 124 individual seeds (mean: 18 seeds/implant, range: 10-28). For each case, seed migration relative to the postimplant CT seed position was quantified by calculating the difference in coordinates corresponding to the identified seed positions. For each case, the average absolute value seed displacement for the entire seed collection in a given implant was also calculated at each time point at which a follow-up CT/CBCT was acquired.
Using the updated seed positions obtained at each time point and accounting for decay, dose distributions for each implant were recalculated on the original postimplant CT for 2 hypothetical scenarios with varying time points for seed migration: Scenario 1—assuming seed positions on a given image set were unchanged until the acquisition of the subsequent image set, and Scenario 2—assuming any change in seed positions occurred the day following acquisition of the prior images. At each time point, the seed strength was modified as per the image acquisition date, to account for radioactive decay. Further, the implant period for a given seed distribution was modified according to the elapsed time between 2 subsequent image sets assuming the above 2 scenarios for seed migration. Finally, composite dose distributions were calculated by summing the contributions from each time period for scenarios 1 and 2, separately. Dose statistics for each scenario were compared to those of the original postimplant distribution. Specifically, differences were calculated (a) within the hypothetical 60 Gy volume (brain tissue volumes receiving 100 Gy [V100Gy], 150 Gy [V150Gy], and 200 Gy [V200Gy] and mean dose) and (b) outside the hypothetical 60 Gy volume (brain tissue volumes receiving 30 Gy [V30Gy] and 15 Gy [V15Gy]). Dose calculations for this portion of the work were carried out as per TG-43U1 29 using a point source (PS) approximation with tissue heterogeneities not taken into account.
Evaluating Dosimetric Impact of Radioisotope Type
To compare implant dose based on the radioisotope type, we retrospectively recalculated the dose using both I-125 (OncoSeed I-125 Model 6711, GE Healthcare, Medi-Physics Inc.) and Pd-103 (TheraSeed® Pd103, Model 200, Theragenics Corporation) seed models for 20 patients, while keeping seed locations the same. The same dosimetric analysis described for the Cs-131 seeds was performed for the dose distributions recalculated in the TPS with I-125 and Pd-103, respectively.
The source strengths of I-125 and Pd-103 were modified to match the 60 Gy Cs-131 dose volume for each case (Figure 2), so that the dose within and outside of the implant could be compared. The mean seed strength used for the Cs-131 cases was 3.64 U (range: 2.80-3.85 U). To match the 60 Gy volume, seed strengths of 0.69 U (range: 0.53-0.75 U) for I-125 and 4.05 U (range: 3.00-5.66 U) for Pd-103 were used. For each patient, the clinical Cs-131 postimplant dose statistics were compared to those of the hypothetical I-125 and Pd-103 implants. Specifically, differences were calculated (a) within the 60 Gy implant (V100Gy, V150Gy, V200Gy, and mean dose) and (b) in normal tissue (V30Gy, V10Gy, V5Gy, and mean dose to the body contour excluding the 60 Gy implant volume). Dose fall-off for each radioisotope was quantified by calculating the gradient index (GI), defined as the volume receiving 60 Gy normalized to the volume receiving 30 Gy.

Post-implant isodose distributions on Sagittal computed tomography (CT) views for (A) Cs-131, (B) I-125, and (C) Pd-103 for a representative case. Color wash dose range: 10 (blue)-2000 Gy (red).
To evaluate the impact of seed migration and decay based on radioisotope type, we substituted I-125 and Pd-103 for the seed positions as defined in follow-up CT/CBCT imaging and calculated hypothetical dose distributions using the updated seed positions obtained at each time point and accounting for the decay of the respective isotope for the aforementioned scenarios. Again, dose statistics for each scenario was compared to that of the initial seed distribution for each radioisotope. Given the longer t1/2 of I-125 relative to the other two radioisotopes, seed positions were identified in 3 additional image sets acquired at 82 to 289 days after collagen tile implantation. These image sets were included in a separate dose comparison of seed migration for I-125 only to investigate the extent to which dose distributions were impacted.
Impact of Modeling the Radioactive Seeds as a PS Versus an LS
All Cs-131 clinical postimplant dose distributions were initially calculated using a PS approximation as part of our clinical workflow for efficiency. However, in reality, the seeds are not PSs but linear in geometry. To quantify the effect of using a simplified PS model, Cs-131 seeds were separately commissioned in the BrachyVision TPS as LSs. For a subset of 10 patients, dose distributions were recalculated using the LS model and compared to those calculated with the PS model. Dose calculations using the LS model required the orientation of each seed to be correct (as viewed on all 3 planes) in addition to the identification of the seed location (Figure 3). The same comparison was made for I-125 and Pd-103 using identical seed locations and orientations as the Cs-131 geometry while keeping the same 60 Gy volume used for Cs-131 in the PS calculation for the substituted radioisotopes. Volume differences were compared at several dose levels (15, 30, 60, and 100 Gy).
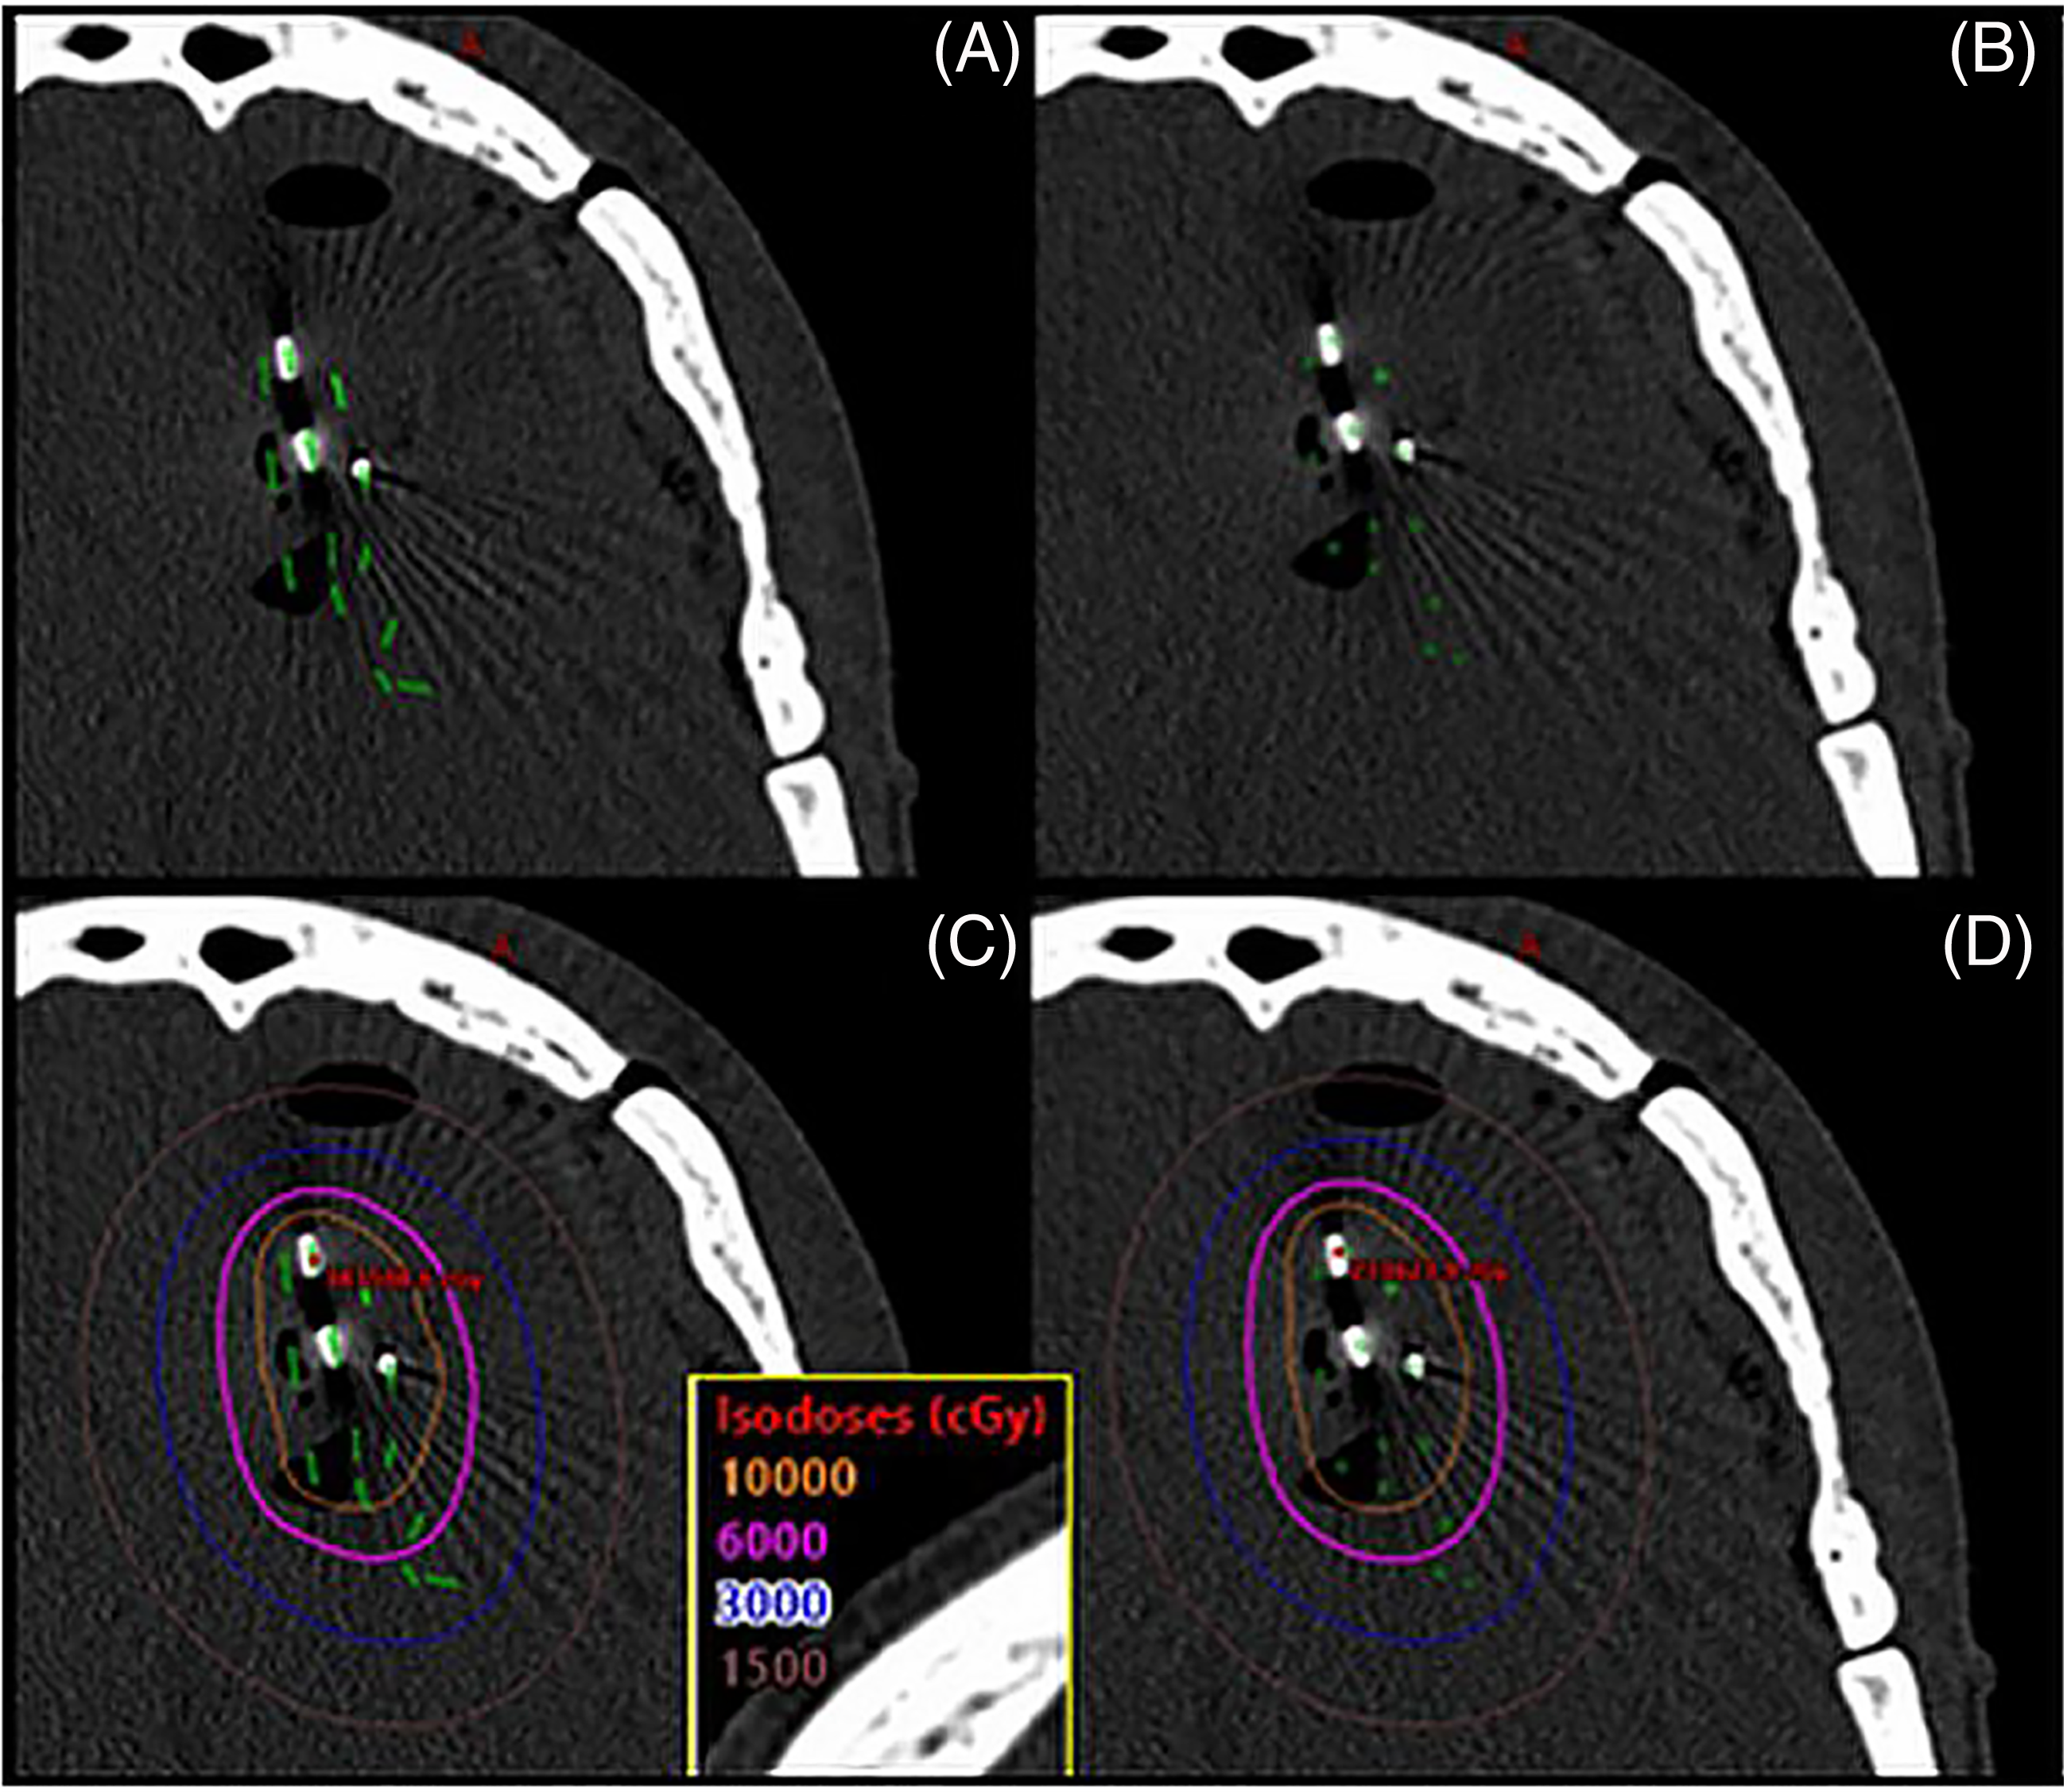
A visualization comparing the LS model and PS model for a brain seed implant using Cs-131 (3.7 U per seed). (A) LS model showing both the seed location and orientation. (B) PS model showing just the seed location. (C) Isodose lines using the LS model. (D) Isodose lines using the PS model.
Our clinic utilizes RadCalc (Lifeline Software) to calculate dose to reference points in the TPS postimplant plan, as a means of fulfilling the TG-40 30 and TG-53 31 recommendations of an independent dose calculation. Reference points placed at various dose levels of interest (15, 30, 60, and 100 Gy) in each Cs-131 dose distribution (with calculations performed using both the PS and LS calculation models) were sent to RadCalc. Cs-131 was configured separately in RadCalc as a PS and an LS. The dose calculated in the BrachyVision TPS for each reference point was compared with the dose calculated in RadCalc. All dose calculations were based on TG-43U1 29 and assumed a homogeneous water medium.
Results
Our study showed a mean seed migration of 1.7 mm (range: 0.7-3.1 mm) across all seeds; averaged across all seed collections and considering seed displacement at all time points of follow-up image acquisition. Considering the maximum and minimum average absolute value displacement for a seed collection at a given time point when follow-up imaging was acquired for each case individually, and averaging these values, gave a mean maximum migration of 2.7 mm (range: 1.2-4.3 mm) and minimum migration of 1.0 mm (range: 0.3-2.0 mm) (Figure 4A). The maximum migration observed for any seed was 5.5 mm. The mean standard deviation in manually identifying seed centers was 0.4 mm (range: 0.1-0.8 mm) and was determined by the same user manually identifying each seed for a given case in 3 separate instances.

(A) Mean absolute value seed migration for a given implant for each case over the time period analyzed. (B) The % dose delivered for each case at the time of the final image used for seed position analysis, based on radioisotope, going up to <6t1/2 for Cs-131 (t1/2 = 9.69 days), <4t1/2 for Pd-103 (t1/2 = 17 days), and <1t1/2 for I-125 (t1/2 = 59.4 days).
In terms of the dosimetric impact of seed migration and radioactive decay, the mean dose to the 60 Gy volume in the hypothetical plans compared to the postimplant plans (Figure 5A and B) differed by a mean of 0.4 Gy (0.6%, range 0.1-1.0 Gy) and 0.9 Gy (1.5%, range 0.2-1.7Gy) for Cs-131, 1.2 Gy (2.0%, range 0.1-2.1Gy), and 1.6 Gy (2.6%, range 1.2-2.6 Gy) for I-125, and 0.8 Gy (1.3%, range 0.2-1.5Gy) and 1.4 Gy (2.3%, range 0.3-1.9 Gy) for Pd-103, for Scenarios 1 and 2 (described in the “Materials and Methods” section), respectively. Mean differences in V100, V150 and V200 (Figure 5C,D) were <0.3 cc for all 3 radioisotopes. Differences in V30 and V15 were <0.3 and <0.4 cc for Cs-131, <0.7 and <1.2 cc for I-125, and <0.4 and <0.6 cc for Pd-103, respectively.
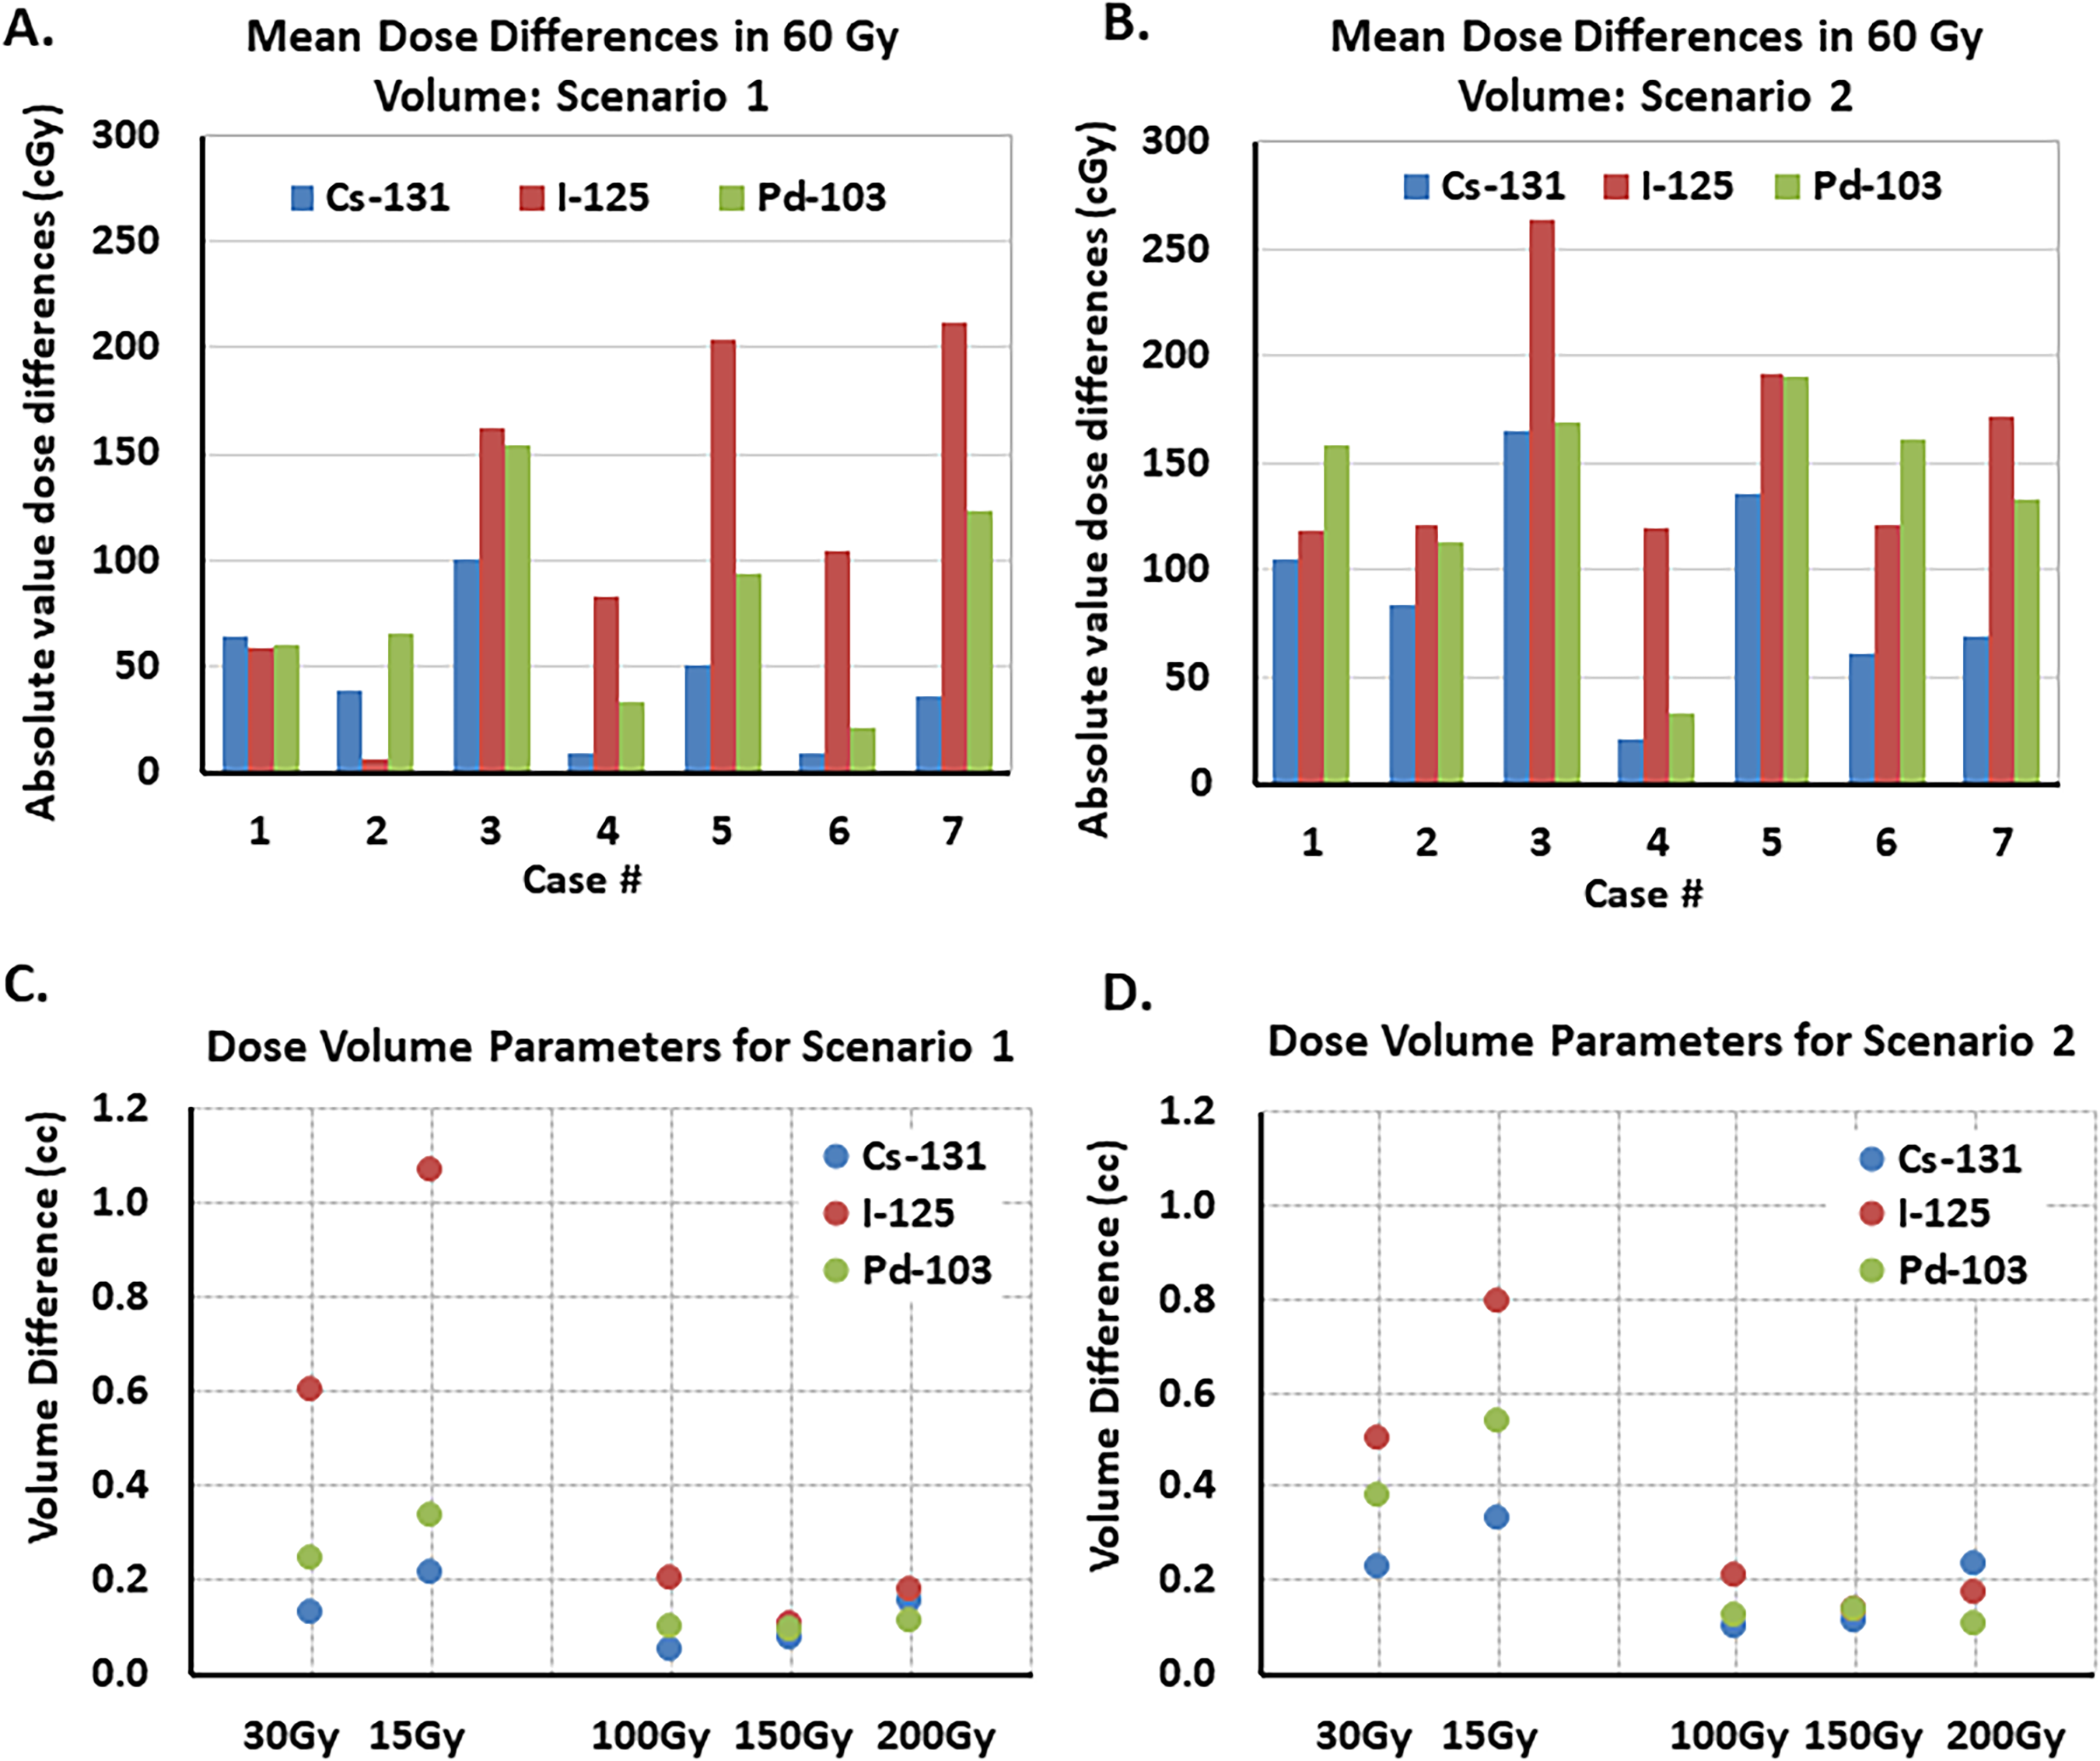
Absolute differences in the mean dose to the 60 Gy volume for the different isotopes (the brachytherapy prescription volume used for Cs-131 clinical cases) for hypothetical (A) scenario 1 and (B) scenario 2 compared to the post-implant dose distribution for each radioisotope that does not account for seed migration. The highest dose differences are seen for I-125, followed by Pd-103. Mean absolute value volume differences within the implant volume (V100, V150, and V200) and in normal brain tissue (V30 and V15) for the different isotopes for (C) scenario 1 and (D) scenario 2 compared to the postimplant dose for each radioisotope that does not account for seed migration. In general, the largest volume differences are seen for I-125.
Based on the decay of each radioisotope type, our overall dose analysis was inclusive of up to <6 t1/2 for Cs-131 (t1/2 = 9.69 d), <4 t1/2 for Pd-103 (t1/2 = 17 d), and <1 t1/2 for I-125 (t1/2 = 59.4 d). Calculating the mean percent dose delivered for each case at the time of the final image (57 days following the seed implant) used for the seed position analysis (Figure 4B) shows that 96.1% (range: 90.6-98.3%), 42.7% (range: 32.0-48.6%), and 85.1% (range: 74.0-90.2%) of the total permanent implant dose had been delivered for Cs-131, I-125, and Pd-103, respectively. In general, the largest dosimetric impact due to seed migration was seen for I-125 due to the longer t1/2 of I-125 compared to the other radioisotopes, and given that for most cases the average absolute seed displacement increased over time. However, the resulting dosimetric impact may not be clinically significant given that the mean dose differences are <1.6 Gy and mean differences in the low dose volumes are <1.2 cc compared to the I-125 postimplant plans (which do not account for seed migration). Repeating the same dosimetric analysis for the 3 patients with follow-up CT images at later time points (82-289 days; ∼1.4-4.9 t1/2) using I-125 as the radioisotope (data not shown in Figure 4B) showed that the absolute mean implant dose differed by a mean of 1.1 Gy (1.8%, range: 0.1-2.1 Gy) and 1.6 Gy (2.7%, range: 1.2-2.6 Gy) for Scenarios 1 and 2, respectively, compared to the postimplant I-125 plans.
In the cohort of patients evaluated for dosimetric changes due to the radioisotope type, the mean 60 Gy volume was 33 cc (range: 4-131 cc). Compared with Cs-131, Pd-103 resulted in a mean increase of 4.8 cc at 150 Gy and 5.1 cc at 200 Gy and I-125 mean increases were 1.4 and 3.7 cc, respectively (Table 1, Figure 6A). Compared with Cs-131, the mean implant dose (Figure 6B) was higher by a factor of 1.3 and 1.1 with Pd-103 and I-125, respectively (Table 1). Mean 30 Gy volumes were higher for Cs-131 by 16.9 and 5.3 cc versus Pd-103 and I-125, respectively (Table 1, Figure 6C). Pd-103 exhibited the steepest dose fall-off. The GI with Pd-103 was 1.88 versus 2.23 with I-125, and 2.39 with Cs-131. Grouping the observed volume differences for low doses (5, 10, and 30 Gy) and high doses (100,150, and 200 Gy) between the different radioisotopes based on implant volume size showed that these volume differences were larger between the radioisotopes with increasing implant volume (Figure 7).

Tissue volumes receiving (A) 150 Gy, 200 Gy, and (B) mean implant dose, and the (C) 30 Gy dose volumes, separated by radioisotope for each case analyzed. Black diamonds denote mean values.

Volume differences at select (A) low dose thresholds (30, 10, and 5 Gy), and (B) high dose thresholds (100, 150, and 200 Gy) between radioisotopes separated by implant volume size (implant volume ≥40 cc, 20 cc ≤ implant volume < 40 cc and implant volume < 20 cc). These volume differences are obtained by subtracting the volume of tissue getting a specific threshold dose with 1 radioisotope by the volume of tissue getting the same threshold dose for another radioisotope. For example, In the above graphs “Cs-I” refers to the volume of tissue receiving the specific threshold dose with I-125 being subtracted from the volume of tissue receiving the same threshold dose with Cs-131. A negative volume increase as in (B) means the first radioisotope had a lower volume of tissue receiving the specific high dose threshold compared to the second radioisotope.
Dosimetric Changes Due to Radioisotope Type (for a Set Seed Geometry).
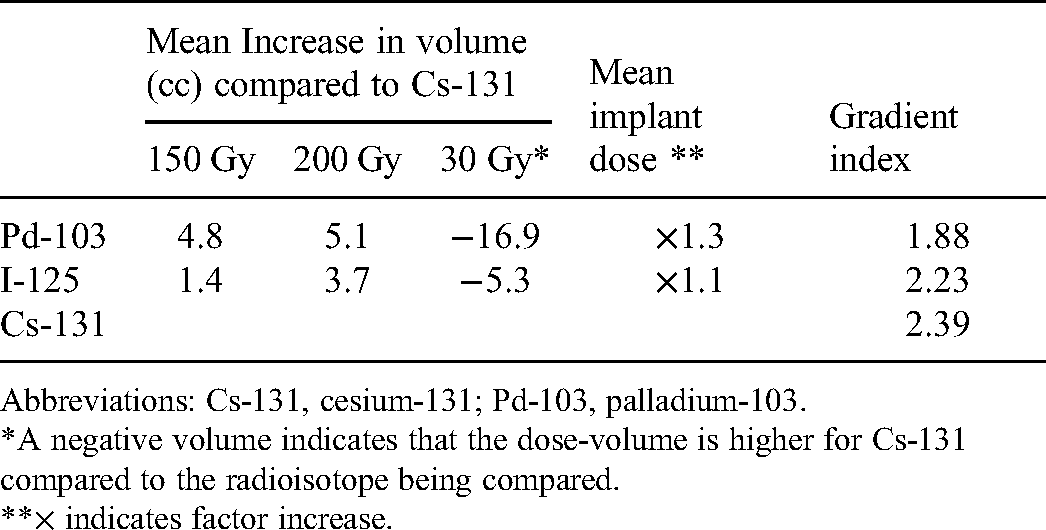
Abbreviations: Cs-131, cesium-131; Pd-103, palladium-103.
*A negative volume indicates that the dose-volume is higher for Cs-131 compared to the radioisotope being compared.
**× indicates factor increase.
Compared with the LS model for dose calculation in the TPS, the PS model resulted in an overestimate of the dose (Figure 8). Mean percent errors using the PS model in Cs-131 dose volumes were 4.3%, 4.5%, 4.7%, and 4.6% at 15, 30, 60, and 100 Gy, respectively. At the same dose levels, the corresponding mean percent errors were 5.6%, 6.3%, 6.6%, and 6.8% for I-125, and 10.2%, 11.8%, 13.6% and 15.4% for Pd-103, respectively. The independent point dose check using RadCalc showed a mean difference of 1% when comparing the LS model of the TPS and the PS model of RadCalc, and 2% when comparing the LS model of the TPS and the LS model of RadCalc for Cs-131 (Figure 9).

Differences in the volume of tissue receiving 15, 30, 60, and 100 Gy for Cs-131, I-125, and Pd-103 when using the PS model versus the LS model in the TPS (Varian's BrachyVision Planning module). The PS model overestimates the dose for all the isotopes.
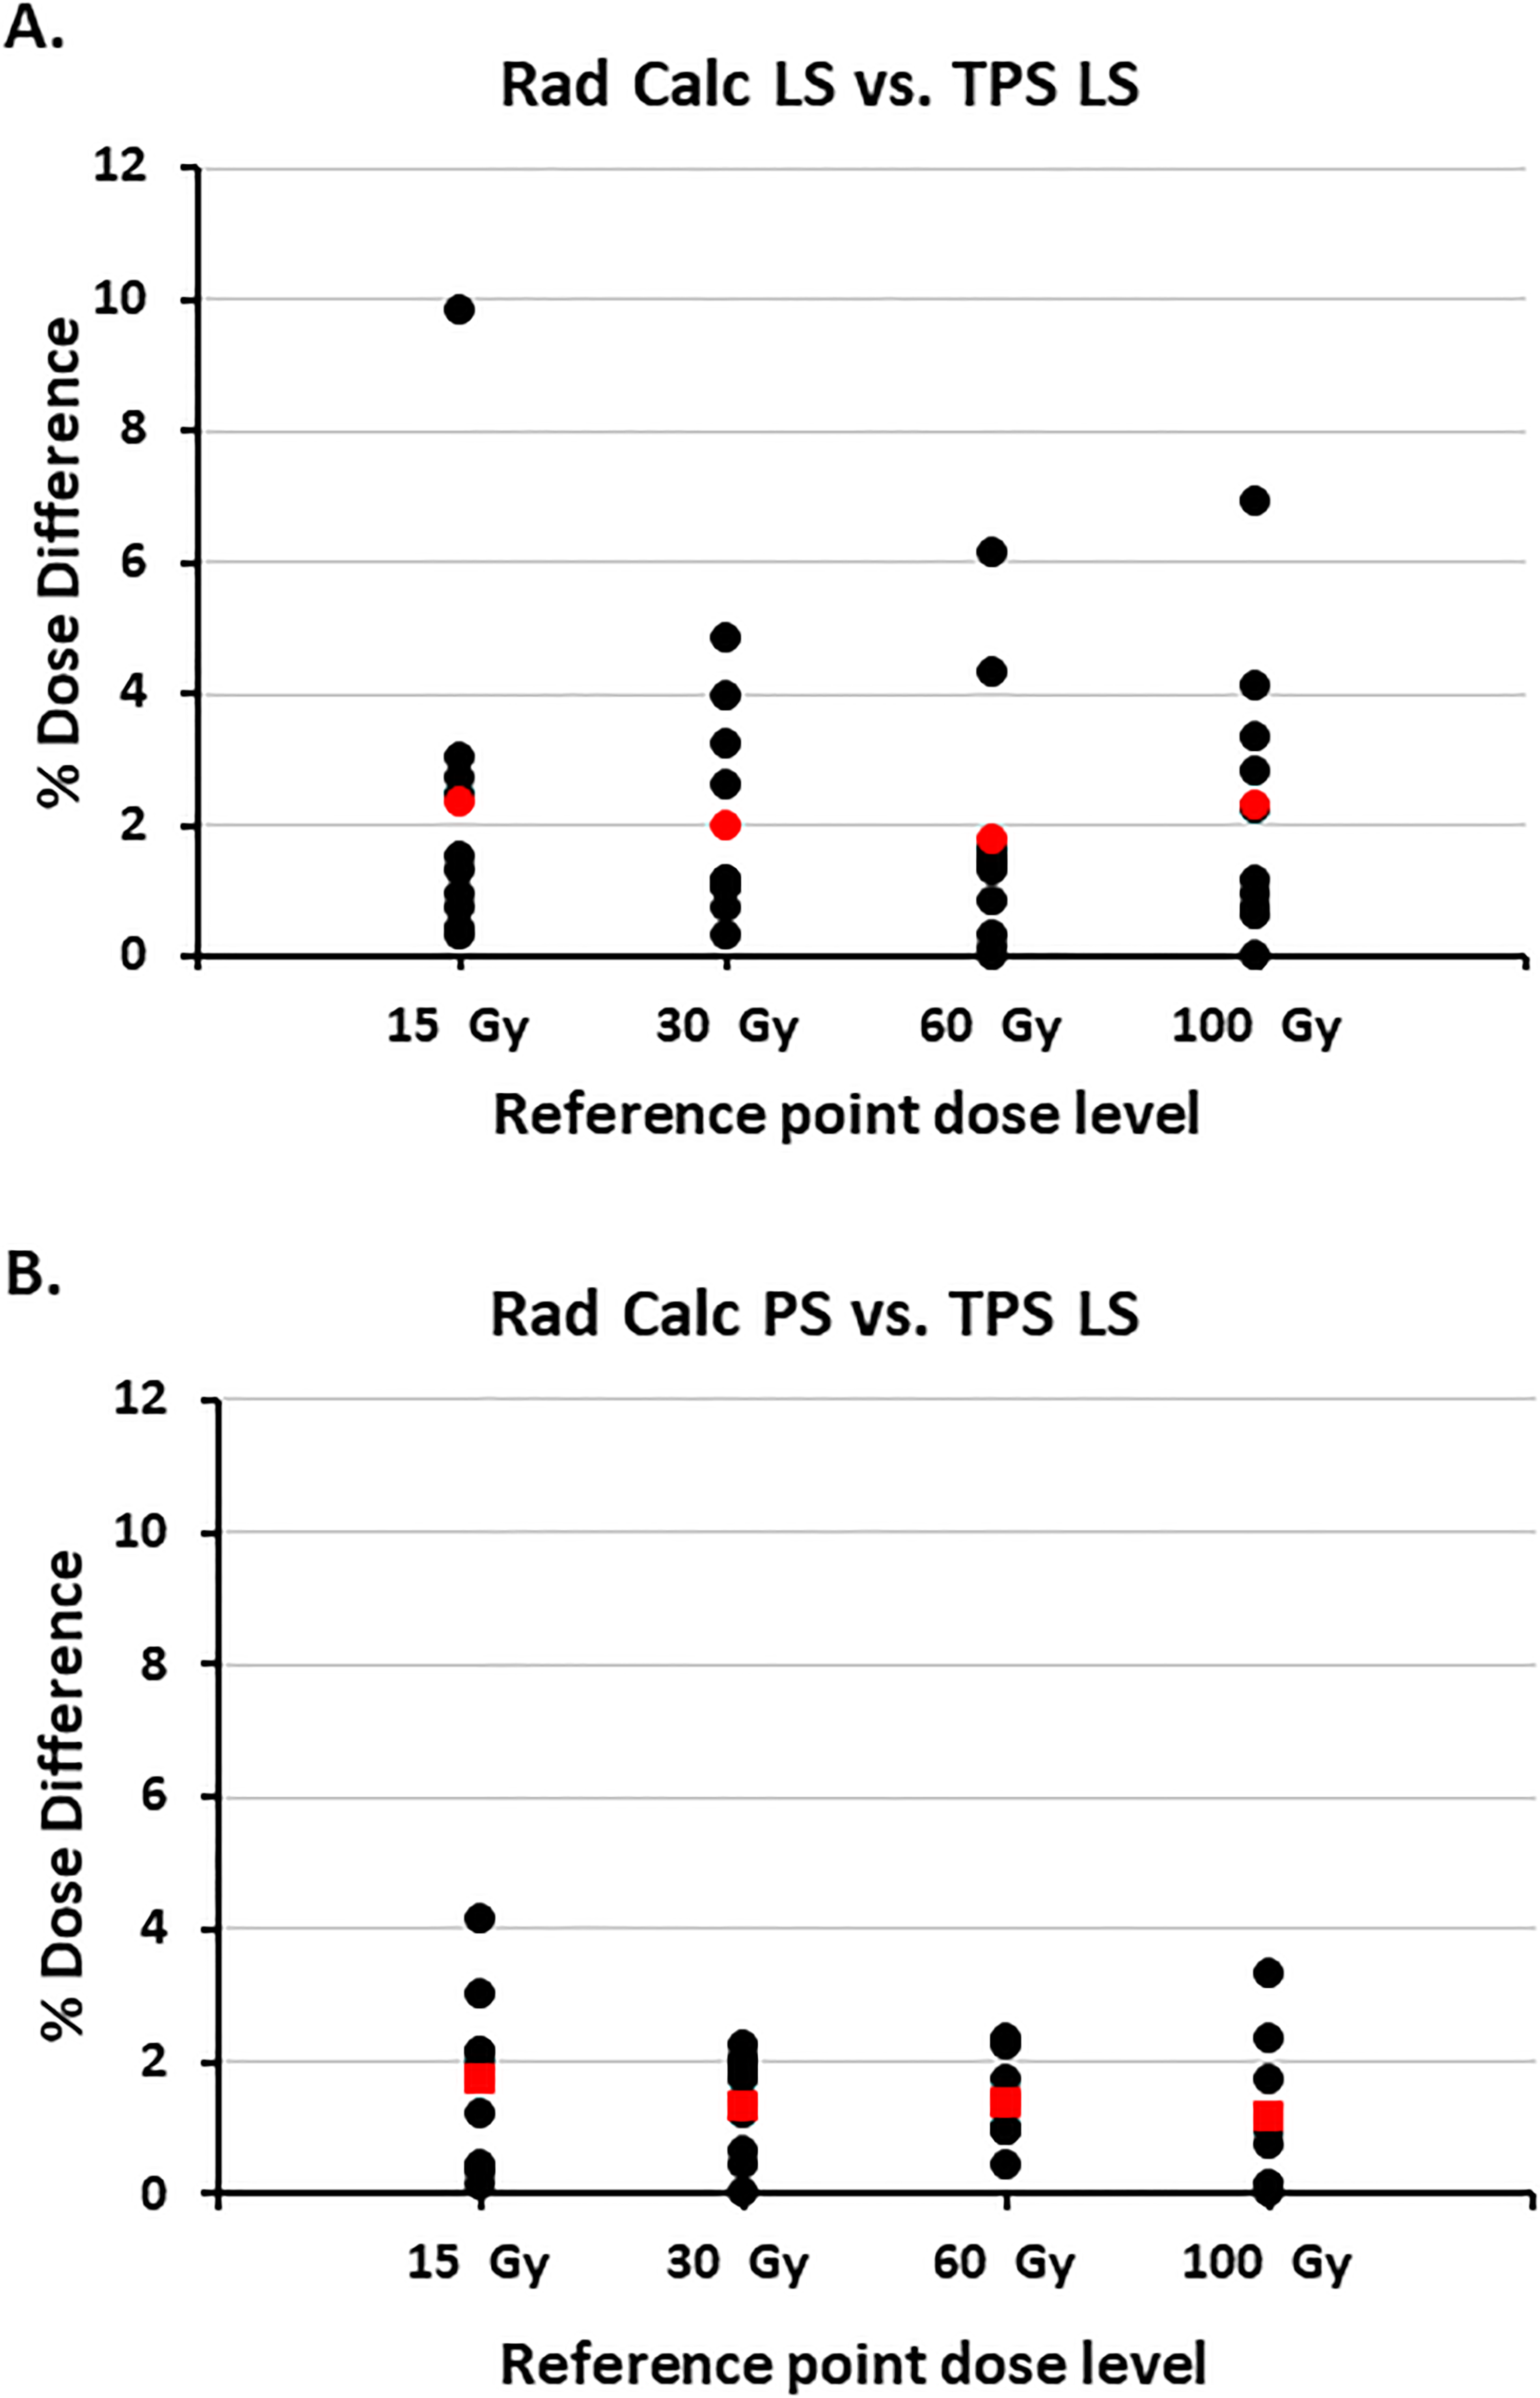
The absolute value of percent differences seen between reference points at different doses in the planning system (BrachyVision, Varian) and the independent second check software (RadCalc, Lifeline Software) (A) the Cs-131 LS model in RadCalc and the LS model in the TPS, and (B) the PS model in RadCalc and the LS model in the TPS. Mean values are shown in red.
Discussion
We investigated the robustness of a modular, resorbable intraoperative collagen seed carrier for brain BT using the STaRT platform and performed an in-depth dosimetric analysis of the differences between Cs-131, Pd-103, and I-125 for a particular implant geometry. Mean migration of seeds embedded in the collagen carrier/spacer was minimal (1.7 mm) and the resulting dose differences from seed migration were relatively small across all 3 radioisotopes. This indicates robust source positioning with the collagen tile BT system over the time points tested.
I-125 has traditionally been the most common radioisotope for permanent intracranial BT.23,32-34 I-125 has a relatively long t1/2 of 59.4 days and a mean emitted photon energy of 28 keV. These properties result in a high rate of dose fall-off and strong absorption by brain tissue.20,35 Shorter-lived Cs-131 (t1/2 = 9.7 days) seeds have been used to treat brain tumors in recent years8,13,15,16,36 depositing a given dose in considerably less time than I-125. Although the mean emitted photon energy of Cs-131 (30 keV) is similar to I-125, the shorter Cs-131 t1/2 results in a higher rate of photon emission and more intense energy deposition.37,38 Pd-103, with a lower mean photon energy of 20 keV and an intermediate t1/2 (t1/2 = 16.99 days) represents another potentially useful intracranial isotope; however, to our knowledge, this application has not been reported.
As might be expected from their relative energies, dose fall-off was fastest with Pd-103, followed by I-125 and then Cs-131. However, Pd-103 and I-125 resulted in higher intratarget doses and greater inhomogeneity compared to Cs-131, for the same seed geometry used for the Cs-131 clinical implants. The dosimetric impact of seed migration and radioactive decay, in terms of the mean dose to the 60 Gy volume compared to the postimplant plans, differed by a mean of <1 Gy for Cs-131. The impact of seed migration accounting for radioactive decay for the hypothetical plans using I-125 and Pd-103 was <2 Gy (I-125) and <1.5 Gy (Pd-103), for the 2 scenarios of seed migration investigated. Although we included 3 additional image sets to investigate the impact of seed migration for I-125, by investigating differences in dose up to approximately 5t1/2, the impact on dose was minimal, with the absolute mean implant dose differing by a mean of <2 Gy. This suggests that despite I-125's longer t1/2, the dose impact due to seed migration should not be significant for seeds embedded in collagen. While investigating surgical cavity contraction following collagen tile BT using follow-up MRI was beyond the scope of this study, the minimal seed migration observed in our work at approximately less than 2 months following the seed implant suggests the robustness of the implant up to this time point. Prior studies have shown that brain surgical resection cavity volumes tend to contract with an effective t1/2 of 3.4 months and that this contraction affects Cs-131 dosimetry significantly less than that of I-125 for loose seed permanent brain seed implants. 39 However, in contrast, with the collagen tile implant the additional investigation we conducted for I-125 including image sets up to ∼10 months (though limited in the number of image sets analyzed) did not show a significant difference in dosimetry due to seed migration.
When evaluating dosimetric changes due to the radioisotope type, the mean dose-volume histograms (DVHs) of the body contour for each isotope (separated into 3 dose ranges for easy visualization) show that Pd-103 generates a larger volume of high-dose within the implant (Figure 10) compared to Cs-131 and I-125, potentially increasing risk for radiation necrosis. 40 These results quantify what is seen in the radial dose function of each radioisotope (Figure 10D) applied to clinical cases. Within a few millimeters from the source center (Figure 10D[inset]), the dose is lowest for Cs-131, indicating that Cs-131 will result in a lower surface dose at the resection cavity, potentially decreasing the risks for radiation necrosis. However, as we move farther from the resection cavity, the dose fall-off is fastest for Pd-103 followed by I-125 and then Cs-131, indicating that Pd-103 provides the best sparing of normal tissue outside the implant (ie, dose <60 Gy) volume, followed by I-125. However, Pd-103 and I-125 resulted in higher intratarget doses and greater inhomogeneity compared to Cs-131, for the same seed geometry used for the Cs-131-containing implants. The larger high-dose volume seen with Pd-103 and I-125 potentially increases the risk for radiation necrosis, and the inhomogeneity becomes more pronounced with increasing target volume. If other radioisotopes such as I-125 and Pd-103 were to be used in a product similar to the Cs-131-containing collagen tiles, the seed spacing, seed arrangement, and activity would need to be optimized to achieve the desired dose to the resection cavity.

Mean DVHs for the body contour for each radioisotope, separated to reflect differences in the (A) 0-60 Gy, (B) 30-90 Gy, and (C) 50-250 Gy dose regions. (D) Radial dose function for the 3 radioisotopes. Inset in (D) shows that within a few millimeters from the source center dose is the lowest for Cs-131, which lowers the surface dose at the resection cavity.
In the BrachyVision TPS used for postimplant dose calculations, compared with the LS model, the PS model resulted in an overestimate of dose with percent errors of <5% for Cs-131, <7% for I-125, and <14% for Pd-103. These differences are due to the anisotropy factor included in the LS model but not in the PS model. A higher mean photon energy decreased this overestimation; therefore Cs-131 had the smallest percent error and Pd-103 had the largest. The percent error increased as the investigated isodose volume increased (ie, volume difference seen in 100 Gy vs 30 Gy). It was interesting that the independent point dose check using RadCalc was more similar to the TPS calculation when comparing the LS model of the TPS and the PS model of RadCalc. This discrepancy results from the RadCalc PS model including a distance anisotropy factor, unlike the TPS, and using a default orientation when using the LS model instead of the true orientation of the seeds as defined in the TPS. The distance anisotropy factor improves the accuracy of the PS model in RadCalc, while default orientation reduces the RadCalc LS model's accuracy. Identifying both the location and orientation of the seeds, which is required for the LS model, did not add significant time to planning in the TPS.
Our study has limitations. Overall, we did not observe a specific pattern for seed migration over time and were not able to determine if the observed minimal seed migration was due to cavity deformation, collagen carrier movement, or both. While accurate seed identification in CBCT images was not an issue (when seeds are viewed in all 3 planes), our study does not fully capture seed motion along the superior-inferior axis given the slice thickness of the CT/CBCT images. In addition, in studies conducted for FDA clearance of the Gamma Tile device, the collagen material demonstrated significant resorption by 22 weeks similar to what has been previously reported. 41 This time period corresponds to about 16t½ for Cs-131, 2.6t½ for I-125, and 9t½ for Pd-103, or >99% dose delivery for Cs-131 and Pd-103 but only ≈83% dose delivery for I-125. Thus, whereas our study has demonstrated that radiographic seed migration appears minimal, we are unable to comment on the impact the resorption time of this current collagen formulation would have on its suitability as a tissue compensator for longer t1/2 isotopes. Further, the subset of patients used for quantifying seed migration was limited. While it is routine clinical practice for all intracranial BT patients to receive MRI for follow-up, it is difficult to accurately identify individual seed positions on MRI. The radioactive seeds cannot be easily visualized on MRI compared to CT, and follow-up MR image slice thickness is larger (at least 5 mm) than CT/CBCT images (1.5-3mm) used for radiation treatment planning and IGRT. The subset of patients used for quantifying seed migration in our study was unique in that they also received EBRT following the Gamma Tile seed implant, under Institutional Review Board (IRB) approval. Because of this, we had access to the thin slice, high resolution, CT, and CBCT images that were used for subsequent EBRT planning/IGRT delivery. This allowed for more accurately quantifying seed displacement over time for the Gamma Tile implant. While we realize that this is a small number of patients, we were in a unique position to acquire even this limited data, as subsequent EBRT following an intracranial seed implant is not common clinical practice. Therefore, our study, which is the first to quantify seed migration when in collagen tile based on CT imaging, provides useful information for the intracranial BT community.
Conclusions
In our study, dose differences due to source migration were relatively small, suggesting the robustness of Cs-containing collagen tiles in preventing seed migration when placed intraoperatively at resection completion as adjuvant radiation therapy. For a given seed geometry, intratarget heterogeneity was greater with Pd-103 and I-125 compared with Cs-131. Dose fall-off was fastest with Pd-103 followed by I-125 and then Cs-131. The lower dose of Cs-131 within a few millimeters from the source center will result in a lower surface dose at the resection cavity, potentially decreasing the risks for radiation necrosis. Based on our work, we recommend using an LS model for seed representation for calculating postimplant dose when possible and investigating potential differences in the implementation of the PS and LS models in TPS compared with what is used in independent dose-verification software. A multicenter observational study of STaRT in intracranial brain tumors (NCT04427384) is currently underway as well as clinical trials investigating postsurgical stereotactic radiotherapy versus STaRT for newly diagnosed brain metastases (NCT04365374) and the use of STaRT for recurrent brain metastases (NCT04690348).
Footnotes
Acknowledgements
The authors thank Laurie LaRusso, MS, ELS, Chestnut Medical Communications for editorial assistance paid for by GT Medical Technologies, Drs. Mehee Choi and Adam Turner (GT Medical Technologies) and Dr. Leland Rogers (GammaWest, Salt Lake City, UT) for their critical review and contributions to the manuscript.
Author contribution
DP, SPS, XY, SJ and SS have nothing to disclose. DGB is Chief Technology Officer at GT Medical Technologies, Inc. and and owns stock in the company.
Data Sharing Statement
The datasets used and/or analyzed during the current study are available from the corresponding author on reasonable request.
Ethics Statement
The study protocol and informed consent form for NCT03088579 were approved by the St. Joseph's Hospital and Medical Center's IRB (IRB#13RT022). Signed informed consent forms were obtained from all participants prior to enrollment.
Declaration of Conflicting Interests
The authors declared no potential conflicts of interest with respect to the research, authorship, and/or publication of this article.
Funding
The authors received no financial support for the research, authorship, and/or publication of this article.