
Abstract
Introduction
Breast reconstruction enhances the psychosomatic function and quality of life of breast cancer patients undergoing mastectomy.1–6 For this purpose, an increasing number of patients receive immediate 2-stage tissue expanders (TE) or permanent implants for breast reconstruction along with cancer surgery. Immediate 2-stage expander/implant reconstruction is a suitable method for breast reconstruction after mastectomy and has been shown to have a lower implant removal or replacement rate than permanent implants.7,8 TEs with metallic ports (MPs) have become more popular for convenient port searching, easy saline injection, and easy TE removal. However, for patients who need adjuvant radiotherapy, the high density of MPs leads to the streaking of metallic artifacts on kilovoltage computed tomography (CT) simulation images and alters the final radiation dose distribution.
Several studies have discussed the dose-effect caused by the geometric structure and physical density of MPs under single-port radiotherapy or bilateral tangential irradiation. A previous investigation showed that the physical density of MPs varied within the range of 7.5 to 16.0 g/cm3.9–11 Such high-density materials are suspected to cause obvious dose attenuation and theoretically increase electron scatter around the MP under photon irradiation. Previous investigations noted that the dose reduction caused by MPs can be as high as 7% to 20%.9,10,12–15 Thompson et al noted up to 30% dose attenuation under a single beam compared to the plan dose. 16 A few studies, however, have reported no obvious dose changes due to MPs.11,12,17 These results should be interpreted carefully because the dose effects of artifacts on CT simulation images were not considered in all studies.9,18
Most studies investigating dose attenuation caused by MPs have mainly focused on the relationship between the electron density of the MP, beam angles, and beam energy. However, another issue in clinical practice is that TE volumes are not always the same for each patient. There is a lack of discussion and investigation of the relationship between radiation dose distribution and TE volume variation. Variations in TE volume may affect the bolus fitness, and more importantly, can shift the MP position in the TE. For example, the MP in the MAGNA-SITETM TE is a semi-floating device. The distance from the MP to the top surface and from the MP to the expander bottom change along with the saline volume injected into the expander. The dose interference caused by MP position shifting should also be considered in clinical treatment.
For radiotherapy planning, the tangential parallel opposed beams technique is the most common practical treatment technique that can reduce undesired low-dose radiation to the lung tissue. However, it was shown that with an MP TE, part of the planning target volume may lead to underdosing by approximately 10% under the tangential parallel opposed beams technique. 16 Tomotherapy has two treatment modes: fixed-beam mode and helical mode. Previous studies have revealed good dose distribution in various cancer treatments with unique gantry design, beam delivery mode, and couch motion.19–22 Mathieu et al treated postmastectomy patients after immediate left breast reconstruction by tomotherapy and reported good disease control and good cosmetic outcomes. 23 The discussion on radiation dose attenuation caused by MPs in TEs mainly focused on a single port and bilateral tangential beam treatment techniques; however, its evaluation in tomotherapy has not been well addressed. Considering the increasing possibility of using MP TEs in tomotherapy, the possible dose influence in tomotherapy requires further examination. This study aimed to establish a proper treatment setting and investigate the volume impact of MP TEs on tomotherapy.
Materials and Methods
Phantom Setup
MAGNA-SITETM with silicone elastomer, an expansion envelope with a BIOCELL-textured surface, three suture tabs, and an internal MP was used in the study. The internal MP has a diameter of 35 mm and consists of a 7-mm high titanium round plate with a 21-mm height rare-earth magnet (Figure 1).

Geometry of the MP in the TE.
A Rando phantom was used to simulate the human chest wall. Boluses were added to the surface of the chest Rando phantom to simulate chest wall muscle. Considering the relative positions of the TE and chest wall muscle in patients receiving mastectomy, a bolus of 0.5 cm thickness was placed on the surface of the Rando phantom to simulate the pectoralis major muscle and skin. This 0.5-cm bolus layer was defined as layer M. TE was placed under layer M to simulate clinical conditions. A 1-cm-thick bolus was placed on layer M as a routine postmastectomy radiotherapy technique used in tomotherapy to provide enough space for skin flash and provide the skin surface dose with a buildup effect.
Planning Parameters
The treatment planning system for tomotherapy is the Accuray Planning Station. Treatment planning in our department is performed with Hi-Art® Version 5.1.1. For the heterogeneity electron density correction evaluation, the MP was contoured based on the CT simulation image and geometric information. The artifact regions in the CT simulation images were replaced by the electron density of water, 1, using different approaches. Simulation CT images were transformed into two different image sets: (a) Image MP group: the MP region was contoured based on the “bone” window/level and knowledge of port shape design. The metallic artifact region was contoured based on the “bone” window/level and soft tissue window/level. The MP region was excluded from the metallic artifact region. The electron density of the residual metallic artifact region was replaced with 1 using the “Replace Density” function. The density of the MP was preserved, and only the surrounding artifact region was replaced by electron density 1, (b) Image Homo group: both the surrounding artifact and MP were replaced by electron density 1.
To evaluate the radiation delivery planning technique, radiation delivery was performed in fixed-beam mode (direct mode) and helical mode for each image set. The prescribed dose was 200 cGy for the planning target volume. For the direct mode, a four-beam arrangement was used with 60° and 40° beams opposed by 273° and 253° beams, respectively. For the helical mode, a virtual region of interest of the whole lung was added as a direction block in the clinical helical mode radiation delivery design. For both the direct and helical modes, the jaw width was set as 2.5 cm. The pitch was set as 0.215 for the helical mode and 0.250 for the direct mode.
To evaluate the influence of TE volume, treatment planning with two image settings and two radiation delivery techniques was performed with different amounts of saline in TE (100, 150, 200, 250, and 300 mL).
Measurements and Analysis
Strips of radiochromic EBT3 films (International Specialty Products) were used for absolute dose measurement at three layers: layer 1) surface of layer M, layer 2) interface between TE and layer M, and layer 3) bottom of TE (Figure 2). The irradiated films were scanned with an Epson Expression 10000XL (Seiko Epson Corporation) at least 24 h after irradiation. The absorbed dose calibration curve for pixel values of the EBT3 film was generated on the same day as when the measurements were performed. Each layer dose measurement was repeated 3 times, and the mean value of doses was calculated. Software Film QA 2.20 was utilized for dose analysis. Each EBT3 measurement dose profile was collected and compared with the plan and prescribed doses. The distances from the TE top to the MP (MT distance) and from the MP to the TE bottom (MB distance) were recorded. The correlations among the measured dose difference, TE volume, image sets, and different techniques were calculated and analyzed. The dose difference between the measurement and plan doses was calculated. The dose difference criterion was set at 5%. The measurement dose passed the dose difference criteria if 95% ≤ (measurement dose/plan dose) ≤ 105%. This was a Rando phantom study without human or animal data/specimen

Setup of the EBT3 film for dose measurements. A strip of radiochromic films was placed on the location as a yellow line. Layer 1: at the surface of layer M (simulates the pectoralis major muscle and skin); Layer 2: at the interface between the TE and layer M; and Layer 3: at the bottom of the TE.
Results
In total, 7650 dose points were measured and integrated to 997 dose points with a 1-cm interval distance between each point.
Heterogeneity Electron Density Correction Evaluation
The measurement dose was 203.10 ± 4.39 cGy with Image MP-Direct mode, 206.54 ± 4.70 cGy with Image MP-Helical mode, 199.95 ± 5.32 cGy with Image Homo-Direct mode, and 203.42 ± 4.22 cGy with Image Homo-Helical mode. The measurement dose of the Image Homo group was significantly lower than that of the Image MP group in both the direct and helical modes (P < .001, P < .001). The Image MP group had significantly smaller differences between the measured and plan doses than the Image Homo group with both direct and helical modes (P < .001, P < .001). The prescribed dose was 200 cGy for the planning target volume. The percentage of point doses achieving the prescribed dose was higher in the Image MP group than in the Image Homo group (P < .001).
Radiation Delivery Technique Evaluation
The helical mode had a significantly higher measurement dose than the direct mode with both Image MP and Image Homo modes (P < .001, P < .001) (Table 1). The percentage of point doses achieving the prescribed dose was significantly higher in the helical mode than in the direct mode with both Image MP and Image Homo (P < .001, P < .001). Image MP-Helical mode provided better dose coverage than other groups.
The Measurements in 2 Image Sets With Direct Mode and Helical Mode.

The measured dose difference from plan dose was −1.56 ± 2.13% with Image MP-Direct mode, −1.22 ± 2.14% with Image MP-Helical mode, −2.67 ± 2.57% with Image Homo-Direct mode, and −2.83 ± 1.81% with Image Homo-Helical mode. The measured dose difference from the plan dose of the direct mode was not significantly different from that of the helical mode with both Image MP and Image Homo (P = .087; P = .419) (Table 2).
The Dose Differences Between the Measured Dose and Treatment Plan in 2 Image Sets With Direct Mode and Helical Mode.

The Relationship Between MP Position and TE Volume
The position of the TE MP changed with an increase in the TE volume. The MT distance varied from 0.7 cm—for TE volumes of 100 mL and 150 mL—to 1.0 cm, for TE volumes of 250 mL and 300 mL. The changes in the MT and MB distances under different TE volumes are shown in Table 3. The MB distance increased from 0 to 1.4 cm as TE volume increased.
MT and MB Distances Under Different TE Volumes.

Abbreviations: MT distance, distance from the TE top to the MP; MB distance, distance from the MP to the TE bottom.
Dose Influence of TE Volume
In layer 1, the measurement dose increased gradually with TE volume but decreased at a TE volume of 300 mL. The TE volume of 250 mL had a significantly higher measurement dose than volumes of 100, 150, and 300 mL. In layer 2, the 150-mL TE had a significantly higher measurement dose (209.42 ± 5.50 cGy) than volumes of 100, 200, and 250 mL. The 100-mL TE had a significantly lower measurement dose than all other TE volumes. The TE volume of 150 mL had a sudden increase in dose in layers 2 and 3 compared with volumes of 100 and 200 mL. In layer 3, TE volumes of 100 and 200 mL had significantly lower measurement doses than volumes of 150, 250, and 300 mL.
Compared with the plan dose, the TE volume of 150 mL had the highest increase in the measured dose difference from the plan dose compared to the other TE volumes in layers 2 and 3 (P < .001, P < .001). The measurement dose and measured dose difference from the plan dose with corresponding TE volumes and measurement layers are listed in Table 4 and plotted as Figure 3.
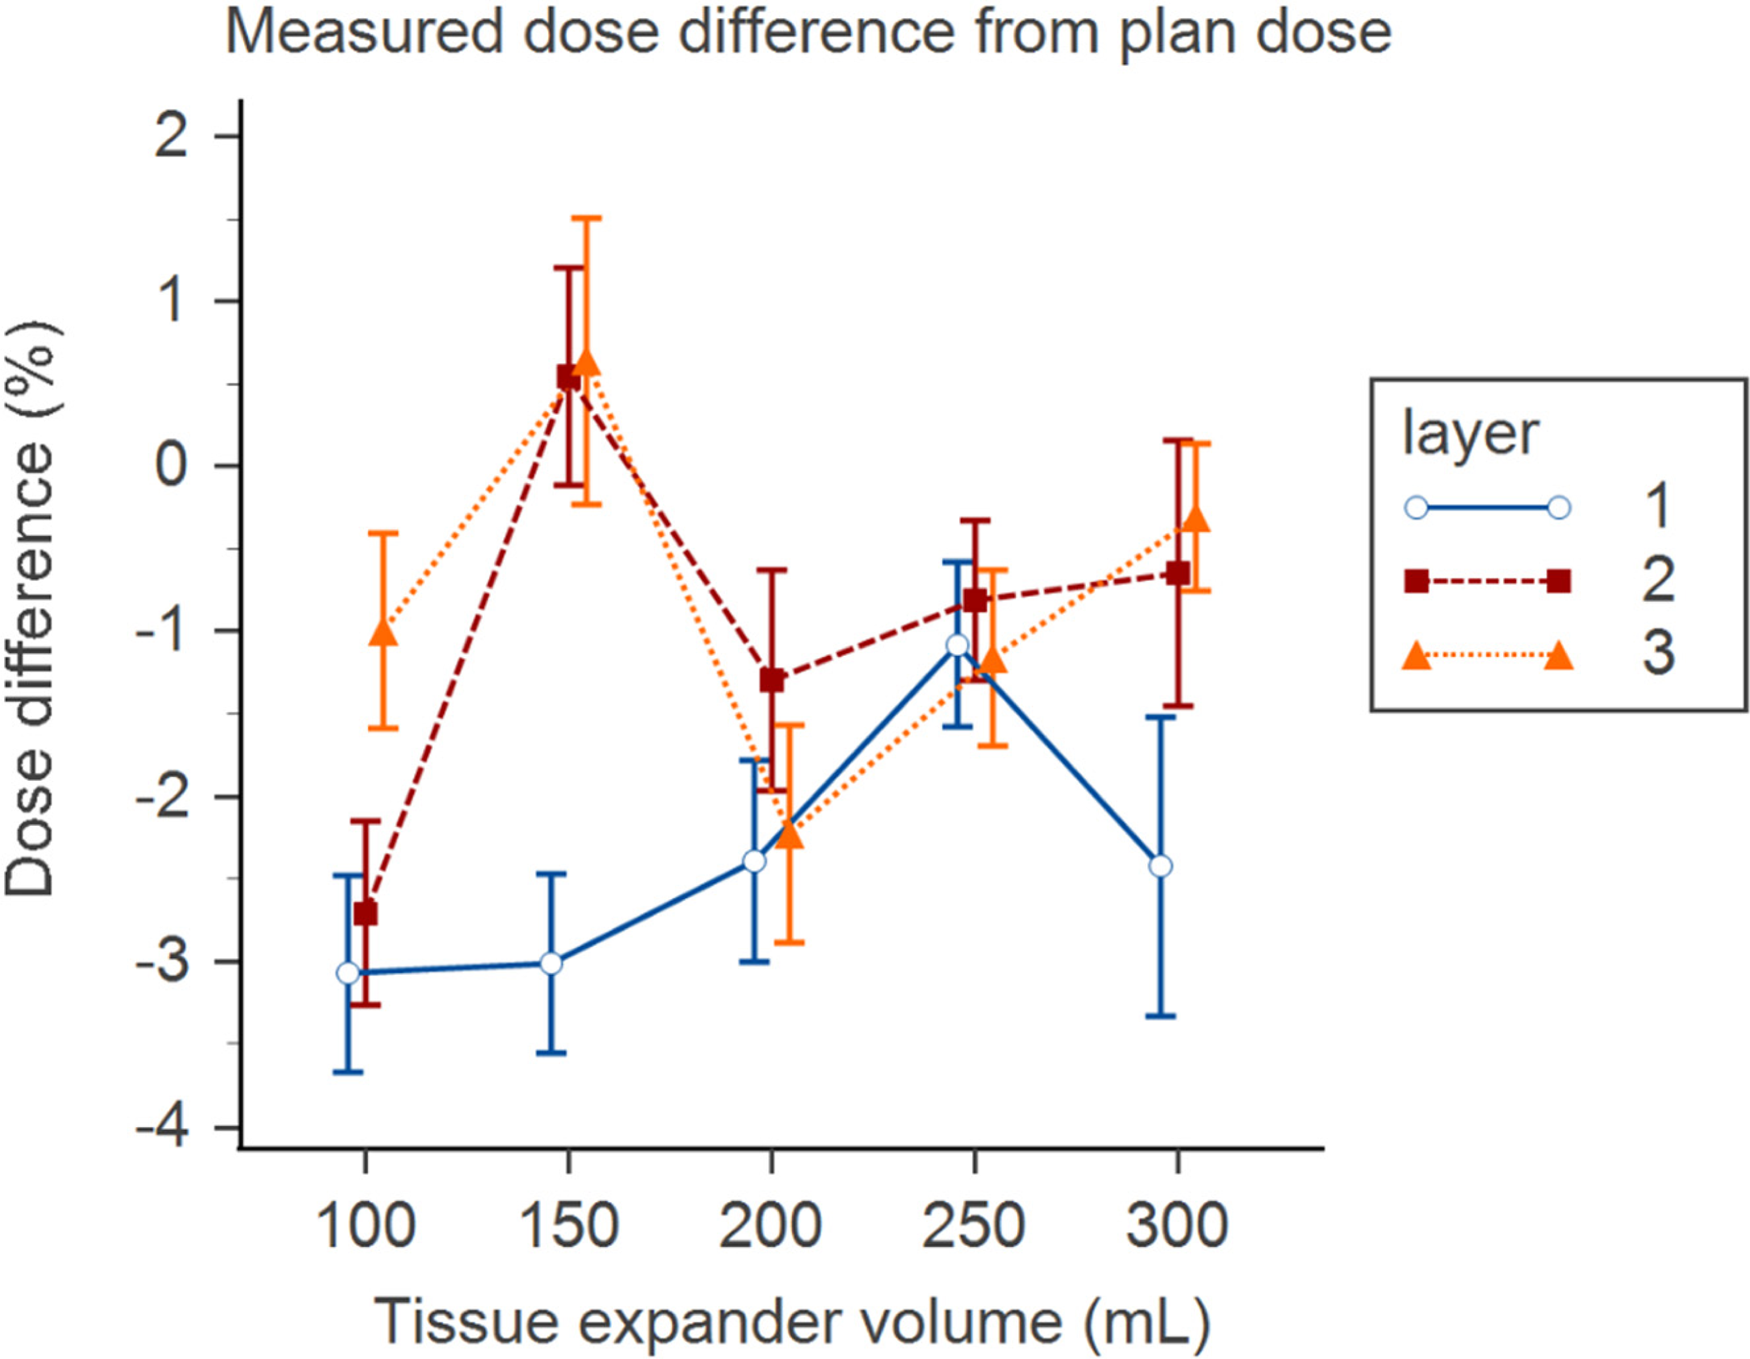
Percentage of measured dose difference from plan dose with the corresponding TE volumes and layers.
TE Volume Impact on the Mean Dose of Each Layer.

Abbreviation: TE, tissue expander
The TE volume of 250 mL had the highest percentage of measurements passing the 5% dose difference criteria from the plan dose at total layers, as shown in Figure 4.

The percentage of measurement doses passing the 5% dose difference criteria from plan dose at each layer and total layer with different TE volumes.
Cold Areas in Measurement Dose Profile
Compared with the plan dose, a decreased measurement dose was noted on both sides of the TE MP with both image modes of all TE volumes. The lowest measurement dose of cold areas was noted in the Image Homo-Direct mode with all TE volumes in layers 1 and 2 (Figure 5). The cold region was less obvious in layer 3 (Figure 6). The dose differences between the lowest cold spot measurement dose and central part measurement dose in layer 1 were 7.42 cGy with 100 mL, 15.29 cGy with 150 mL, 11.71 cGy with 200 mL, 12.16 cGy with 250 mL, and 6.19 cGy with 300 mL; in layer 2, these were 9.85 cGy with 100 mL, 11.47 cGy with 150 mL, 13.55 cGy with 200 mL, 9.56 cGy with 250 mL, and 4.81 cGy with 300 mL. There was no significant correlation between the lowest measurement dose and the TE volume (P = .316). The average dose reduction in the measured cold area doses compared with the plan dose in all volumes was 6.03 ± 1.94% with the Homo-Direct mode.
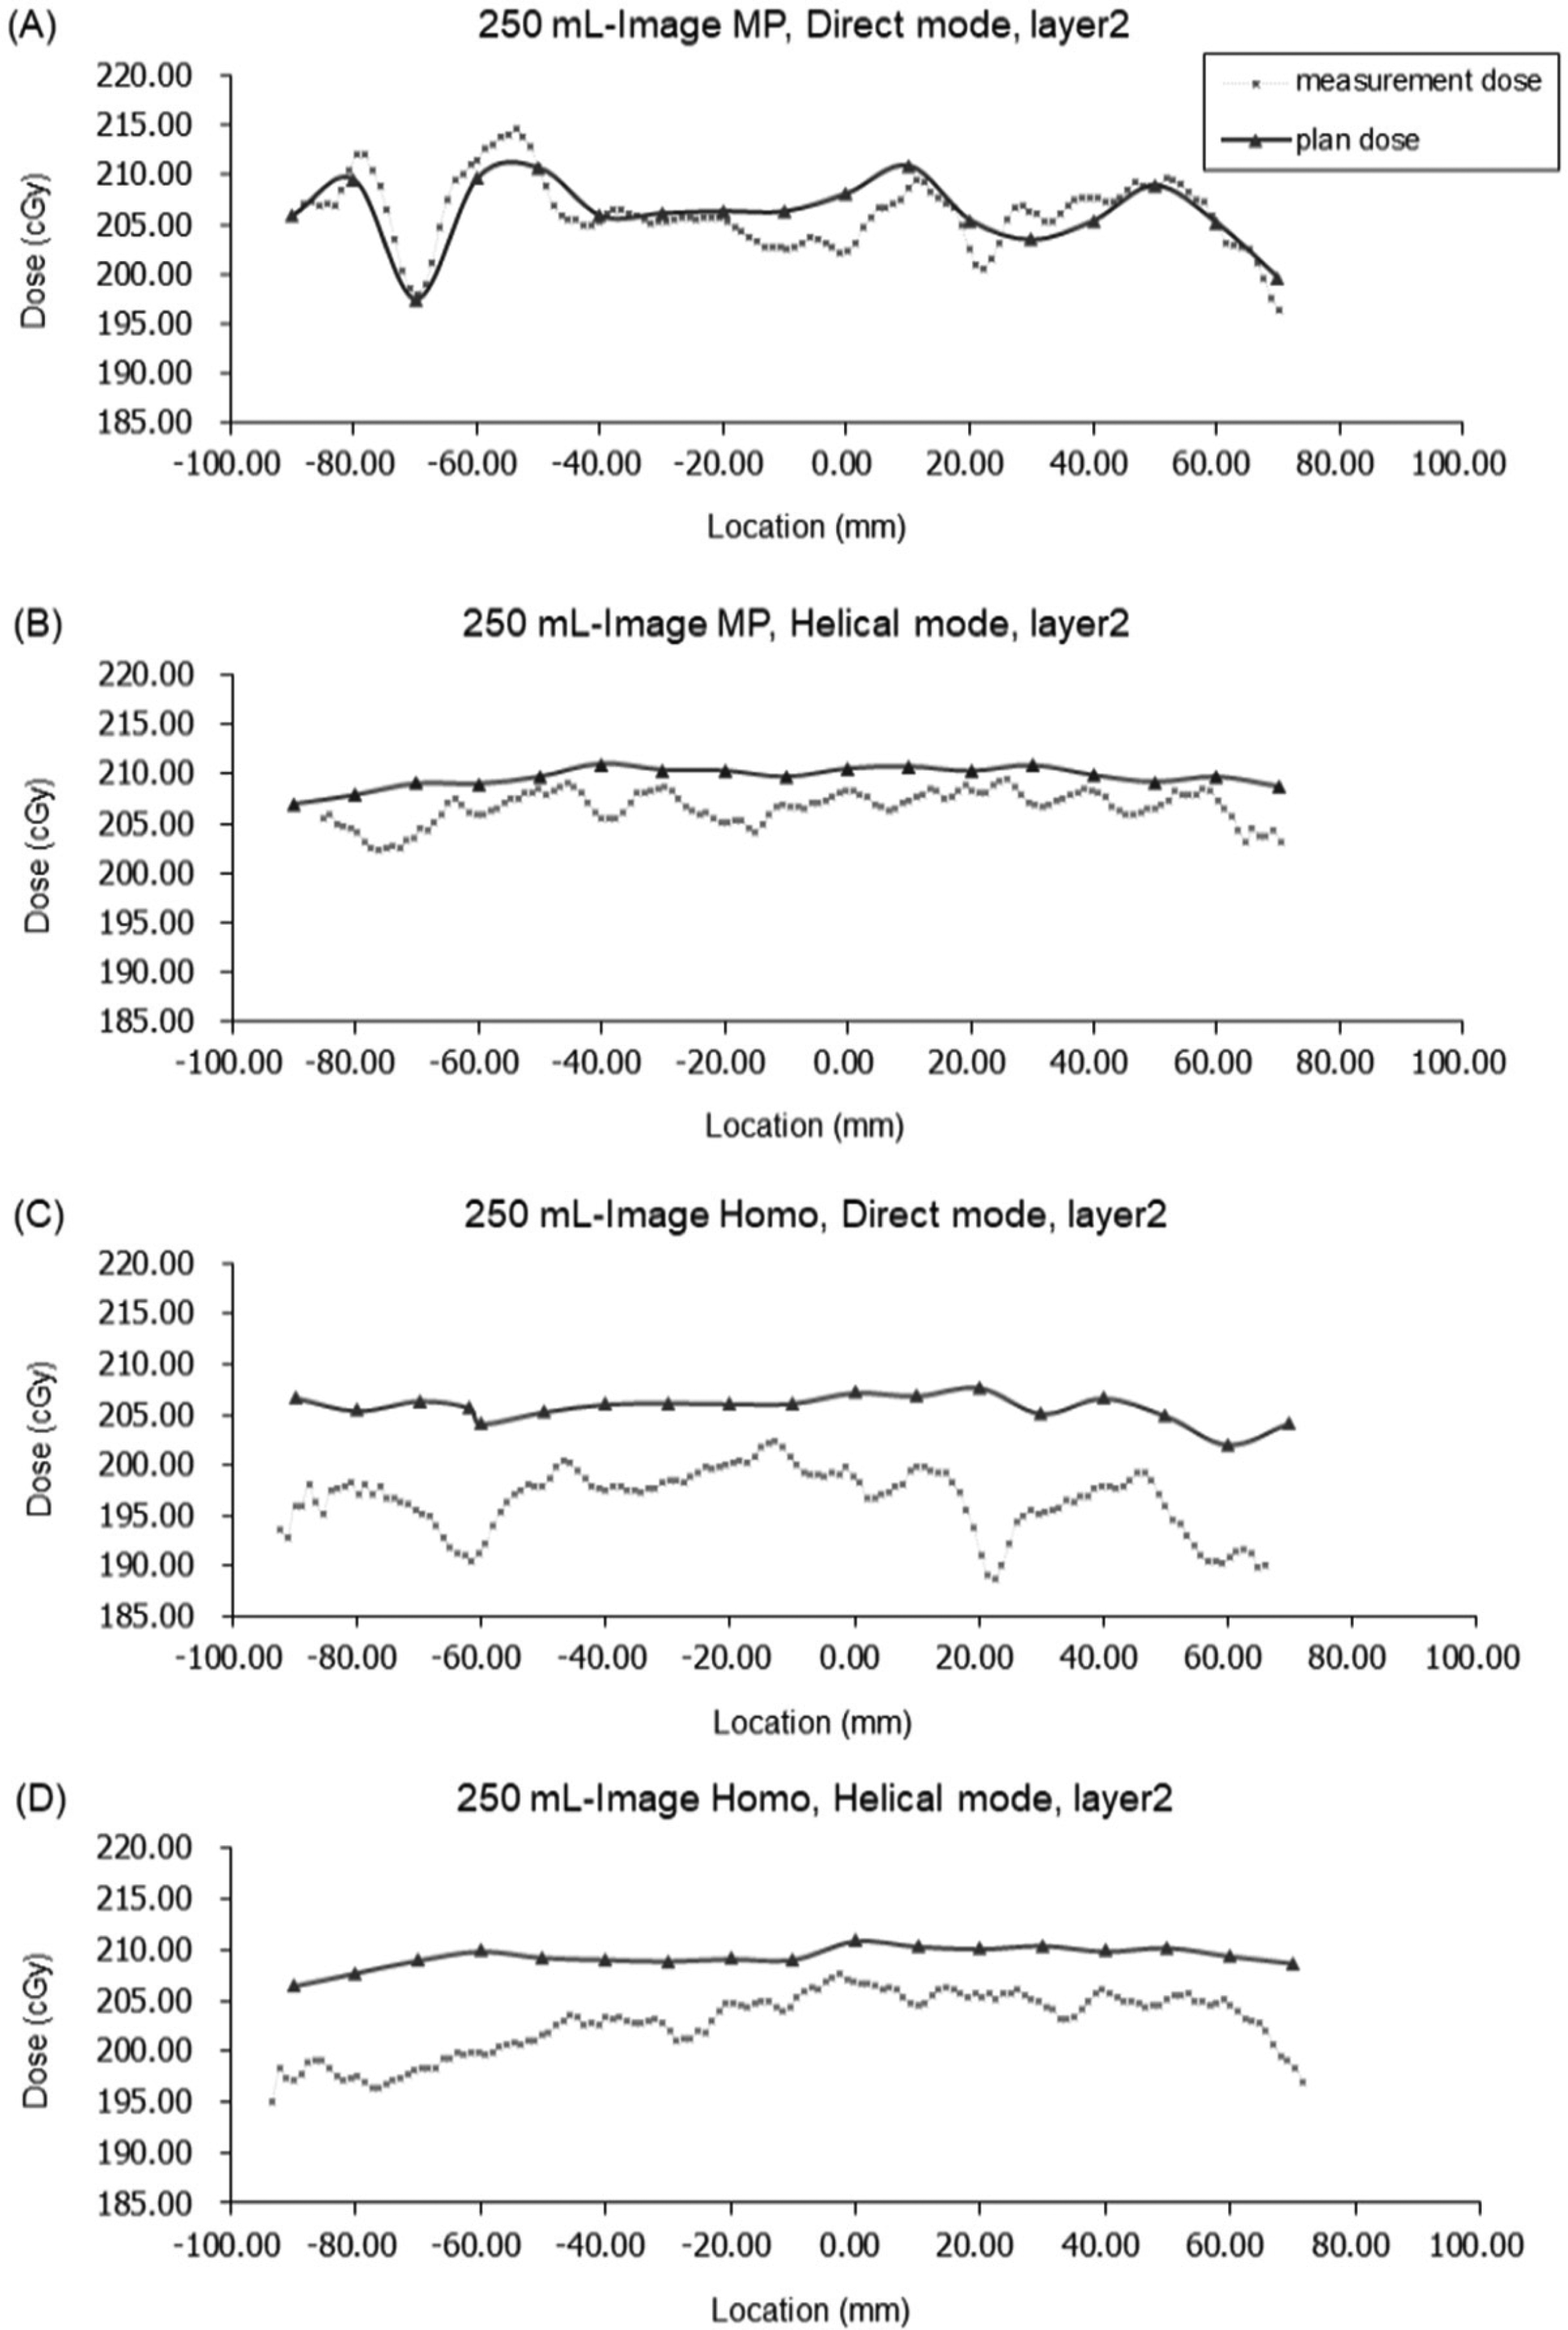
Dose profiles of layer 2 with a TE volume of 250 mL with (A) Image MP in direct mode; (B) Image MP, helical mode; (C) Image Homo, direct mode; and (D) Image Homo, helical mode.

Dose profiles of layer 3 with a TE volume of 250 mL with (A) Image MP in direct mode; (B) Image MP, helical mode; (C) Image Homo, direct mode; and (D) Image Homo, helical mode.
Discussion
TEs with MPs provide the benefit of easy saline injection and TE removal for permanent implantation preparation. However, MPs in TE cause metallic artifacts on CT simulation images, leading to radiation dose interference in clinical treatment. The upper limit of the image CT value could cause an underestimation of the dose effect caused by the electron-dense material. However, the upper HU value limit of the Accuray Planning Station for plan calculation does not allow further higher value adjustment, which could lead to a dose difference between the planned dose and actual measurement dose. Under this precondition, an MP TE could lead to a more obvious dose difference. This study was designed to understand the dose difference between the treatment plan and actual measurements, as well as to investigate a better strategy to improve the dose consistency and better actual dose distribution.
Our results show that treatment planning with the image MP heterogeneity correction planning technique and helical mode provided a higher prescribed dose achievement rate during radiation delivery on TE with an MP. The 100-mL TE had the lowest measurement dose at all layers, while the 250-mL TE had the highest percentage of measurement doses passing the 5% dose difference criteria from plan dose.
For treatment planning with an MP within the treatment field, our findings suggested that better dose calculation results can be achieved through electron density replacement of the surrounding artifact only and preservation of the original density of the MP. The preserved MP density should be considered in tomotherapy treatment planning system dose calculation, and the possible attenuative effect of high-Z material should be calculated. A higher intensity should be given to compensate for the reduced dose through the inverse treatment planning system, and the measured dose difference from treatment planning can be reduced.
Regarding the radiation delivery technique, our results showed that there was no significant difference between the measurement and plan doses in both the helical and direct modes under Image MP. Image MP can improve the dose consistency between the plan and measured doses. However, the percentage of point doses achieving the prescribed dose was significantly higher in the helical mode than in the direct mode with both Image MP and Image Homo. From Figure 6 of the layer 2 dose distribution, an obvious cold spot region caused by a limited beam angle was noted in the direct mode but not in the helical mode. The helical mode delivers radiation through multiple angles. The greater the number of beam angles included in radiation delivery, the greater the dose attenuation caused by the MP can be smeared in different directions; thus, the severity of cold spots can be reduced without sacrificing tumor coverage, tumor homogeneity, and lung protection. Most treatment plans choose to deliver radiation through bilateral tangential beams for breast radiotherapy, which is similar to the direct mode. However, for patients with MP TEs, helical tomotherapy is a more suitable choice to decrease the cold spot effect caused by the MP.
To study the possible backscatter effect caused by the MP, the doses of layers 1 to 3 were analyzed. It should be noted that the 150-mL TE had the highest percentage of increased measured dose from the plan dose in layer 2. The MT distance was 0.7 cm for TE volumes of 100 and 150 mL; this increased to 0.9 cm for 200 mL and 1.0 cm for 250 and 300 mL. Because the volume of 150 mL had a closer MT distance than volumes of 200, 250, and 300 mL, the increased dose of layer 2 can be explained by a greater MP backscatter effect. When using a TE volume smaller than 100 mL, the beam directions tended to be arranged more from the tangential angles—considering the flat target shape and lung protection—instead of the perpendicular angle of the MP surface. The backscatter caused by the tangential angle beam is mainly scattered in the tangential direction instead in the tissue above the MP.
The measured dose in layer 3 increased gradually with TE volume. The MB distance was 0.1 cm for a volume of 150 mL and increased to 0.5, 1.0, 1.4 cm for 200, 250, and 300 mL, respectively. The MB distance likewise increased with TE volume. The space in the TE was filled with saline and the BIOCELL surface. The material in the space may absorb the backscatter caused by the MP. Thus, the dose interference caused by the MP to bottom layer 3 decreased with increasing MB distance and TE volume. Thompson et al revealed an insignificant dose effect at 3 mm from the disk edge in the parallel orientation and 5 mm from the disk edge in the perpendicular orientation. 16 Our findings demonstrated a similar trend in the side scatter and backscatter measurements.
When a relatively small TE volume of 100 mL is used, folds along with the TE surfaces were observed due to the partially filled expander cavity and floating fluid accumulation. The fitness and fixation of boluses and EBT3 films were strongly affected by the unstable TE shape. The reproducibility of the TE shape and stability of the measurement dose increased at a TE volume of 150 mL. When TE volume was increased to 300 mL, an unsteady shaking movement of the large TE was noted during the repeated procedure and could have decreased layer 1 plan dose achievement. On clinical treatment, the decreased fitness of the bolus on breast skin led by an increased curve of the breast was noted. The air gap between the bolus and breast tissue increases as breast volume increases. Previous studies have shown that an oversized breast volume will reduce the daily patient setup reproducibility.24–27 TE volumes ranging from 150 to 250 mL are recommended for radiotherapy treatment according to our data, while greater or lesser TE volumes may lead to an increase in the measured dose difference from the plan dose.
The cold spot regions of the measured dose were more obvious in layers 1 and 2, especially in the Homo-Direct mode. Gee et al performed treatment planning dose calculation with the image homogeneity correction method, and cold spots with an average dose reduction of 7% were observed on both sides of the breast with an MP. 9 Our Image Homo-Direct mode results showed similar cold spot areas with a dose of −6.03 ± 1.94% on both sides of the MP on layer 2. Chen et al also revealed less clinical tumor volume coverage near the MP and suggested heterogeneity correction of metallic artifacts on CT images during treatment planning calculation. 15 Helical therapy can reduce the cold spot effect by smearing the attenuated dose to different angles. In our study, layer 1 represented the skin surface of the human body, and layer 2 represented the bottom of the pectoralis major muscle. For patients with cancer high-risk regions in the above region, the temporary TE with MP should be evaluated carefully because it could lead to an underdosed region during radiotherapy and possibly affect the local control.
Permanent implants without MPs can reduce dose interference during irradiation.15,28 However, a 2-stage expander/implant reconstruction was shown to have a less severe capsular contracture rate, possibly due to capsulotomy at the time of changing the expander to the implant.29–31 For patients receiving a TE with an MP, heterogeneity correction of the image with preserved MP density should be performed to help us understand the real condition and optimize treatment planning to ensure treatment quality.
Our study was a Rando phantom study. Previous studies have discussed the dose effect caused by MPs but neglected the influence of TE volumes. It is essential to simulate with Rando phantom to provide a safer evaluation before the impact of TE volume is confirmed. Radiochromic EBT3 films were used for the dose measurement. Although thermoluminescent dosimeters can obtain recorded doses more easily and can be reused, radiochromic EBT3 films have the advantage of measuring continuous dose profiles. However, clinical situations can be more complicated than in this study due to the different amounts of residual chest wall tissue and various daily position reproducibilities of each patient.
Our study revealed the dose impact caused by changes in the TE volume. The application of our dose data should be carefully considered. The TE used in our study was MAGNA-SITETM. Different TE designs may have different MB and MT distances. The dose impact on different layers should be evaluated individually according to each unique design. TE volumes of 100 and 300 mL were not suggested because of the unstable shape and shaking motion of the TE. Notably, the human pectoralis major muscle may provide higher fixation ability than the simulated boluses and fixation used in our study. Therefore, further clinical surveillance is required. Our study focused on photon irradiation measurements without an electron boost. Electron perpendicular irradiation was reported to have a 56% dose reduction and should be used cautiously if the patient has a high-risk region nearby. 14
Conclusion
For patients with MP breast TEs, planning images with heterogeneity correction of surrounding metallic artifacts but the preservation of MP density is suggested. Helical tomotherapy is a suitable treatment technique for good planning target volume dose coverage and reduced attenuation caused by the MP. TE volume alteration interferes with radiation dose distribution. Patients with high-risk cancer regions at the chest wall should be evaluated carefully because a TE with an MP may lead to an underdosed region. For the MAGNA-SITETM TE, a volume of 150 to 250 mL can provide a stable daily reproducible position for treatment. Different designs of MP TEs could lead to various dose attenuations and backscattered effects, depending on the structure. Each unique MP TE design should be evaluated individually. In summary, radiation oncologists should have detailed discussions and close cooperation with plastic surgeons to provide the best individual treatment strategy for each patient.
Footnotes
Abbreviations
Authors’ Note
This study was a Rando phantom study. The study does not require an ethical board approval because it does not contain any human or animal data/specimen.
Acknowledgments
Declaration of Conflicting Interests
The author(s) declared no potential conflicts of interest with respect to the research, authorship, and/or publication of this article.
Funding
The author(s) received no financial support for the research, authorship, and/or publication of this article.