
Abstract
Introduction
Acute myeloid leukemia (AML) is a malignant disease of hematopoietic stem cells characterized by the clonal expansion of abnormally differentiated myeloid cells. As the most common type of leukemia in adults, its incidence increases with age. The incidence of AML is approximately 5.06 per 100,000, and AML in children accounts for about 20% of childhood leukemia cases. 1 It is estimated that 20,240 new cases of AML will be diagnosed in the United States in 2021, and 11,400 people will die of AML. 2 Accordingly, the survival rate is still low. At present, the treatment of AML still mainly involves stratified chemotherapy, targeted therapy, supportive therapy, and hematopoietic stem cell transplantation, and targeted therapy is the focus of current clinical research. Therefore, research is urgently needed to identify potential therapeutic targets and prognostic biomarkers for AML.
VAV family genes (VAVs), located downstream of protein tyrosine kinases, include VAV1, VAV2, and VAV3. They are a group of signal transduction molecules regulated by tyrosine phosphorylation. 3 This gene family is related to the occurrence, development, and prognosis of many cancers. In non-small cell lung cancer, VAV2 is involved in the inhibition of the epithelial-mesenchymal transition, migration, and metastasis 4 and VAV3 can promote the metastasis. 5 High VAV1 expression in esophageal squamous cell carcinoma predicts a poor prognosis. 6 In human papillomavirus-negative head and neck squamous cell carcinoma 7 and adrenocortical carcinoma, 8 VAV2 expression is related to a poor prognosis. VAV3 is associated with a poor prognosis in pancreatic cancer, 9 gastric cancer, 10 and prostate cancer. 11 However, the prognostic value of VAVs in AML remains unclear. Therefore, the aim of this study was to explore the expression and prognostic value of VAVs in AML by in vitro and bioinformatics approaches. In particular, we analyzed (1) VAV expression in AML, (2) the relationship between VAV expression and prognosis, and (3) functional enrichment of genes correlated with VAVs.
Materials and Methods
GEPIA Dataset
Gene Expression Profiling Interactive Analysis (GEPIA) (http://gepia.cancer-pku.cn/) was used to analyze the relationship between VAV family gene expression levels and AML prognosis. The database contains publicly available cancer and normal tissue microarray data. 12 Data were downloaded on January 2, 2021.
PrognoScan Dataset
PrognoScan (http://dna00.bio.kyutech.ac.jp/PrognoScan/) employs the minimum P-value approach for grouping patients for survival analyses. 13 The GSE12417 dataset was selected to evaluate correlations between VAV expression levels and overall survival (OS) in AML. Data were obtained on August 28, 2021.
CCLE Database
CCLE (https://www.broadinstitute.org/ccle) is a compilation of gene expression, chromosome copy number, and massively parallel sequencing data for 947 human cancer cell lines. 14 Expression levels of VAV gene family members were evaluated in different types of cancer tissues. Data were obtained on January 25, 2021.
EMBL-EBI Database
The European Bioinformatics Institute (EMBL-EBI) (https://www.ebi.ac.uk) 15 was used to analyze the expression of VAV genes in AML cell lines. Data were accessed on March 23, 2021.
UALCAN Database
UALCAN (http://ualcan.path.uab.edu) uses TCGA level 3 RNA-seq and clinical data for 31 cancer types to analyze TCGA gene expression data. 16 This website was used to identify the expression levels of VAV genes in AML subtypes based on the French-American-British (FAB) classification. Data were accessed on March 3, 2021.
LinkedOmics Database
The LinkedOmics database (http://www.linkedomics.org) contains multi-omics data and clinical data for 32 cancers and 11,158 patients from the Cancer Genome Atlas (TCGA) project. 17 This database was used to analyze and verify the relationship between the expression levels of VAV genes and prognosis in AML. Data were accessed on January 2, 2021.
CBioPortal Database
The cBio Cancer Genomics Portal (http://cbioportal.org) currently includes data for more than 5000 tumor samples from 20 cancer studies. 18 This database was used to calculate the frequency of gene alterations and mRNA expression z-scores (RNA Seq V2 RSEM). Data were accessed on March 4, 2021.
Network Analysis
The Search Tool for the Retrieval of Intercept Genes/Proteins (STRING) database (https://string-db.org/) collects, scores, and integrates publicly available sources of protein–protein interaction (PPI) information and supplements these sources with computational predictions. 19 DAVID (https://david.ncifcrf.gov/) can be used for gene classification, functional annotation, or cluster analyses.20,21 Cytoscape (https://cytoscape.org/) is an important tool for network biology analysis and visualization, applicable to any molecular components and interaction systems.22,23 Using these tools, we generated a PPI network and performed Gene Ontology (GO) and KEGG pathway functional enrichment analyses of VAV family genes. Original data were downloaded on March 5, 2021.
Cell Lines and Cell Culture
The human AML cell lines KG-1 were purchased from the Cell Bank of the Chinese Academy of Sciences (Shanghai, China). The MV4 to 11 cell lines were obtained from the American Type Culture Collection (Manassas, VA, USA). The human AML cell lines KG-1 and MV4 to 11 were cultured at 37 °C and 5% CO2 in RPMI-1640 medium containing 10% fetal bovine serum and 1% penicillin–streptomycin.
Clinical Samples
Peripheral blood was obtained from 35 patients with AML (non-M3 subtype) and 13 controls (including three cases of iron deficiency anemia and ten cases of thrombocytopenia) admitted to the *** from January 1, 2021 to June 31, 2021. Patients with AML were diagnosed according to the WHO 2016 standards and classified according to the FAB classification. Treatment was mainly based on the Chinese guidelines for diagnosis and treatment of adult AML (non-APL). 24 Clinical data, including age, sex, gene mutation/fusion, subtype classification, risk stratification, complete remission (CR), white blood cell (WBC) count, hemoglobin count, platelet count, and bone marrow blast cell count were collected. This study was conducted in accordance with the guidelines of the Ethics Committee of the *** and in accordance with the World Medical Association Declaration of Helsinki. This study was approved by the Medical Ethics Committee of the *** (NO.:KY2021166), and individual consent for this retrospective analysis was not required.
Antibodies and Reagents
The following antibodies were used: VAV1 antibody (Abcam, Cambridge, UK), VAV2 antibody (Abcam, Cambridge, UK), VAV3 antibody (Abcam, Cambridge, UK), β-actin antibody (Bioss, Massachusetts, USA), and horseradish peroxidase (HRP)-linked anti-rabbit immunoglobulin G (IgG) (CST, Massachusetts, USA). The reagent was RIPA Lysis Buffer (Biyuntian Biotechnology, Shanghai, China).
Quantitative Real-Time PCR (qRT-PCR)
Total RNA was extracted using the RNAsimple Total RNA Kit (TIANGEN, Beijing, China). The TransScript All-in-One First-Strand cDNA Synthesis SuperMix for qPCR Kit (TransGen Biotech, China, Beijing) was used to synthesize cDNA, and PerfectStart Green qPCR SuperMix (Transgen) was used to detect mRNA levels. The primer sequences were as follows: VAV1-forward, 5′-TCAGTGCGTGAACGAGGTCAAG-3′, VAV1-reverse, 5′-CCATAGTGAGCCAGAGACTGGT-3′, VAV2-forward, 5′-CTGCTGTTCCACAAGATGACCG-3′, VAV2-reverse, 5′-GGTC-AGTCAGTCAGTCAG-AGCCTGGTCAGAGCCTG5TCAG-AGCCTGVGCCT-AGG-3′, VAV3-reverse, 5′-CACGTTGCATAGGAACCACAAGC-3′, β-actin-forward, 5′-GGCGGCACCACCATGTACC-3′, β-actin-reverse, 5′-CCACACGGAGTACTTGCGC-3′. The 2−ΔΔCT method was used to calculate the relative mRNA expression levels.
Protein Extraction and Western Blotting
Total protein was extracted using whole-cell lysis buffer (Beyotime Biotechnology, Beijing, China). Then, 20 µg of protein from each sample was loaded onto gels for separation by 10% sodium lauryl sulfate-polyacrylamide gel electrophoresis, followed by transfer to a polyvinylidene fluoride (PVDF) membrane (0.45 μm; Millipore, Burlington, MA, USA). After blocking with 5% skim milk, the PVDF membrane was incubated with the primary antibody overnight at 4 °C. The PVDF membrane was then incubated with the secondary antibody at 25 °C for 1 h. Chemiluminescence ECL reagent (Tanon, Woburn, MA, USA) was used to observe protein expression.
Statistical Analysis
Statistical analyses were performed using SPSS (Version 25.0, IBM Corp.. Armonk, NY, USA) and GraphPad Prism (Version 9, GraphPad Software). Student's t-tests were used to analyze differences between two groups. According to the mean VAV gene expression level, patients were divided into groups with high (VAV-high) and low expression (VAV-low), and Fisher's exact test was used to for comparisons between these groups. Statistical significance was set at P < 0.05. A Cox regression analysis was used to determine the prognostic value of VAV genes.
Results
VAVs are Highly Expressed in AML (GEPIA Database and Clinical Samples)
The GEPIA database included information for 173 patients with AML from TCGA and 70 normal blood samples from the Genotype-Tissue Expression (GTEx) portal. Based on these samples, the expression levels of VAV family genes in AML samples were significantly higher than those in normal blood samples (P < 0.05) (Figure 1A).

Comparison of VAV expression levels in AML and normal samples. (A) Expression levels of VAVs in AML analyzed by GEPIA. (B) RT-qPCR validation of VAVs in AML and normal samples. (C, D) Western blot validation of VAVs in AML and normal samples. N1, 2, 3: Normal 1, 2, 3; P1, 2, 3: Patient 1, 2, 3. * P < 0.05; **** P<0.0001.
Next, we analyzed the peripheral blood of 35 patients with AML (non-M3 subtype) at our hospital. As determined by RT-qPCR, the expression levels of VAV1 (P = 0.0249), VAV2 (P = 0.0223), and VAV3 (P = 0.0488) in AML samples were significantly higher than those in the control group (Figure 1B), verifying the difference in VAV gene expression between AML and normal tissues from a clinical perspective. We further verified the high expression of VAVs in patients with AML by western blotting (Figure 1C, D).
Clinical Characteristics of Patients with AML
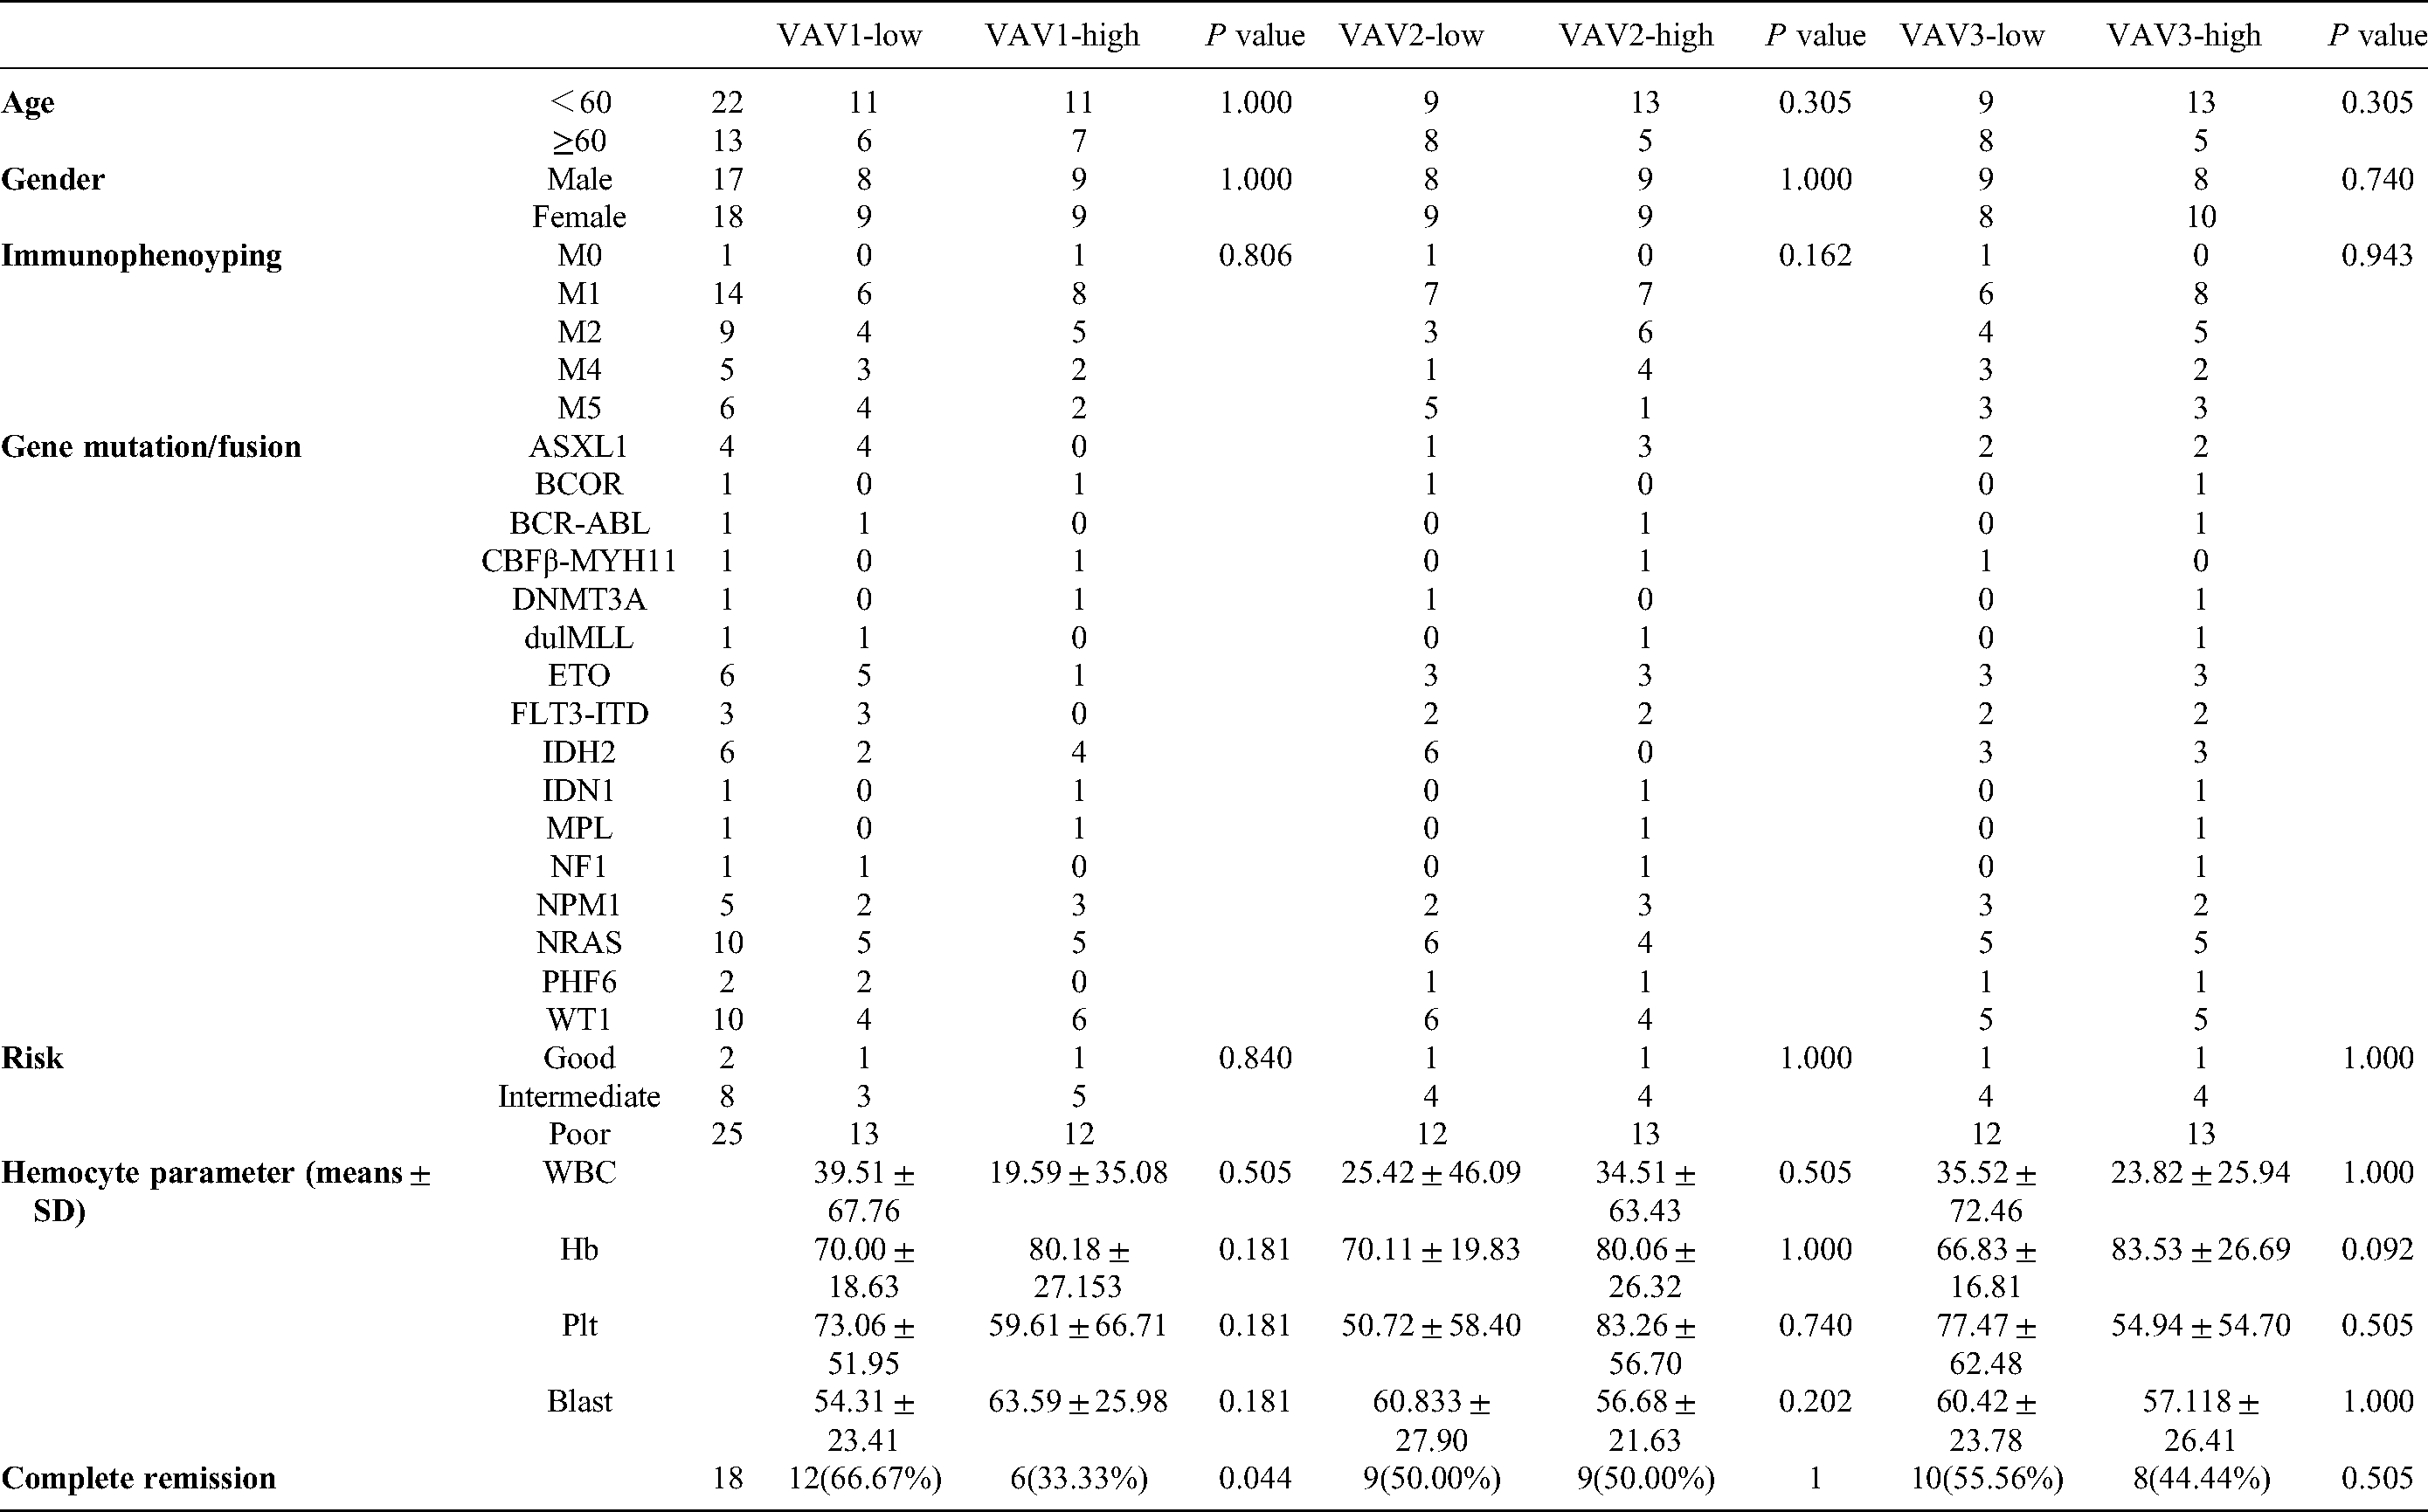
Further analysis of clinical information for 35 patients with AML from our center (Table 1) revealed that there were no significant differences in age, sex, WBC count, hemoglobin count, platelet count, or bone marrow blast cell count between the VAV1 high expression group and the VAV1 low expression group (P > 0.05). The CR rate was significantly lower in the VAV1 high expression group than in the VAV1 low expression group (P < 0.05), while the CR rates did not differ significantly between the VAV2 and VAV3 high expression and low expression groups (P > 0.5).
Relationship between baseline characteristics and VAVs mRNA expression. (Fisher exact test)
A univariate Cox analysis was performed based on data for patients with AML from TCGA, including VAV expression, FLT3 mutation, risk stratification, WBC count, hemoglobin count, platelet count, and bone marrow blast cell count. High VAV1 expression and high-risk risk stratification were related to a shorter OS in AML. Subsequently, significant parameters in the univariate analysis (P < 0.2) were included in a Cox multivariate analysis. VAV1 (P = 0.019), FLT3 mutation (P = 0.043), and risk stratification (P = 0.011) were independent risk factors for survival in AML (Table 2).
Univariate and multivariate COX analysis for survival analysis of TCGA patients

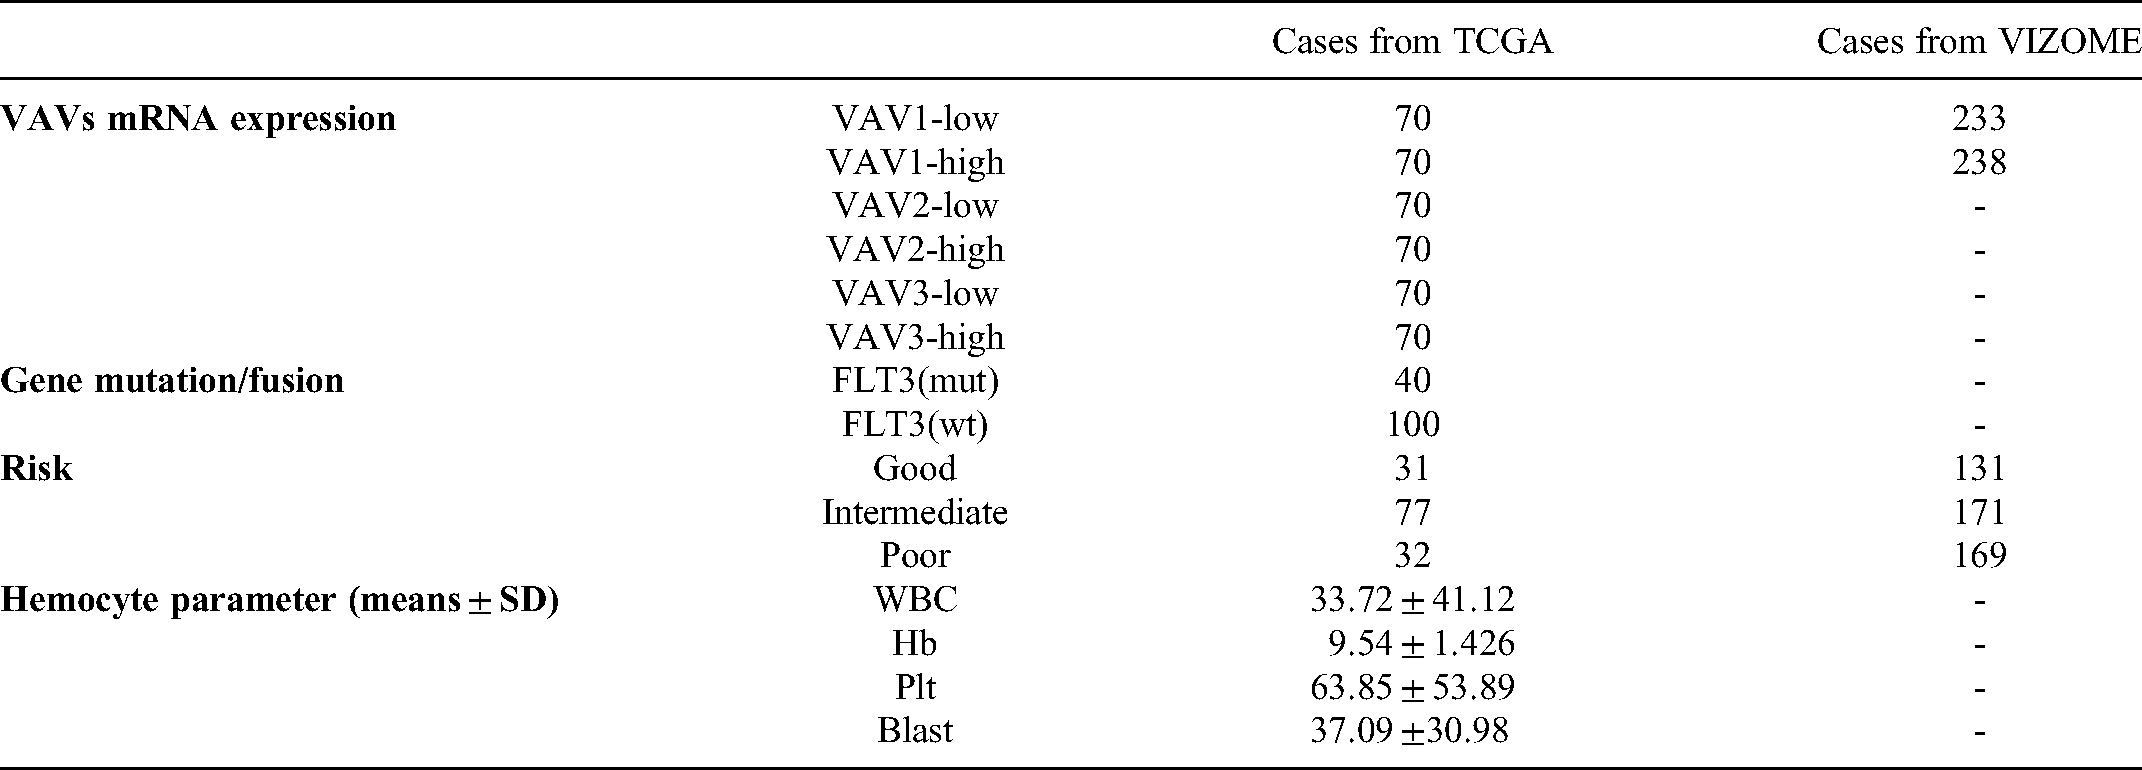
A further analysis of TCGA data showed that there was no significant difference in VAV1 expression between the mutant and wild-type FLT3 groups (P > 0.05) (Figure 2A), while the expression of VAV1 in the low-risk group was significantly lower than that in the high-risk group (P<0.05) (Figure 2B). Finally, we verified the relationship between VAV1 expression and ELN risk stratification by analyzing 471 patients with AML from the VIZOME database, and the results were consistent with those of the TCGA analysis (Figure 2C). Clinical characteristics of AML patients from TCGA and VIZOME databases can been seen in Table 3.

Relationship between VAV1 Expression and clinical characteristics of AML patients. (A) Relationship between VAV1 Expression and FLT3 mutant in AML. (B) Relationship between VAV1 expression and risk of AML patients from TCGA. (C) Relationship between VAV1 expression and risk of AML patients from VIZOME.
Clinical characteristics and VAVs mRNA expression of AML patients from TCGA and VIZOME databases
Transcript levels of VAVs in French-American and British (FAB) subtypes of AML
Transcript levels of each VAV in the M0 to M7 FAB subtypes of 171 patients with AML from the TCGA database were analyzed using UALCAN. There were significant differences in VAV expression among AML subtypes. The expression levels of VAV1 and VAV2 were highest in AML-M5 and lowest in AML-M3. Compared with levels in the other subtypes, VAV3 expression was higher in patients with AML-M0 and lowest in patient in AML-M3. VAV3 expression differed significantly between M3 and M5 (P = 9.55729999585486E-08) (Figure 3A).

Expression levels of VAVs (A) in AML based on FAB classification (UALCAN), (B) in different cancer cell lines (CCLE). FAB: French-American-British.
Expression of VAV family genes in cancer cell lines
We then used the CCLE database to analyze VAV gene expression in different cancer cell lines. Although VAVs showed differential expression in different tumor cell lines, they were all highly expressed in AML cells (Figure 3B). These results are consistent with the results obtained by GEPIA. Among them, VAV1 was most highly expressed in AML, followed by VAV3 and VAV2.
Consistent with these findings, using EMBL-EBI (Figure 4A), we found that VAVs are highly expressed in various AML cell lines and the expression levels of

VAVs expression in different AML cell lines. (A) The expression levels of VAVs in AML cell lines analyzed by EMBL-EBI. (B, C) Western blot validation of VAVs in AML cell lines and PBMCs. PBMCs: peripheral blood mononuclear cells. ** P<0.01; *** P<0.001; **** P<0.0001.
Alterations in VAVs in AML
By analyzing the ‘TCGA Provisional’ data set in the cBioPortal database, 24 of 163 AML samples (14.72%) harbored genetic mutations, of which 22 mutations were associated with an increase in VAV mRNA expression (Figure 5A, B). These results indicate that high mRNA levels were the major modification of VAVs.

Analysis of the alterations of VAVs in AML (cBioPortal). (A) Summary of VAVs alterations in AML. (B) Details of VAVs alterations in AML.
High VAV1 expression is associated with a poor prognosis in AML
Using the GEPIA database, the relationship between the expression levels of VAV family genes and the prognosis of AML was investigated. As shown in Figure 6A, high VAV expression was associated with a poor OS in AML. However, this association was only significant for VAV1 expression (P = 0.0055). We obtained similar results using PrognoScan (Figure 6B), further confirming that VAV1 is closely related to prognosis in AML.

The prognostic value of VAVs expression level in AML (GEPIA and PrognoScan). (A) The prognostic value of VAVs expression level in AML, which was analyzed by GEPIA. (B) The prognostic value of VAVs expression level in AML, which was analyzed by PrognoScan. (C) Prognostic analysis of
Next, we used LinkedOmics to analyze the relationship between the expression of VAV1-related genes and the prognosis of AML in TCGA (Appendix 1, 2). The results showed that SIPA1, SH2D3C, and HMHA1 expression levels, which were significantly positively correlated with VAV1 expression, were significantly related to the prognosis of AML (P < 0.05) (Figure 6C). However, the expression of genes that were significantly positively correlated with VAV2 and VAV3 expression were not significantly correlated with the prognosis of AML (Appendix 3). Taken together, our analyses indicate that VAV1 is a potential prognostic marker for patients with AML.
PPI network analysis of VAVs and co-expressed genes
Using VAV-related genes reported in the cBioportal database, the top 26 significantly co-expressed genes were screened for further analyses. We then analyzed the co-expression PPI network of VAVs using the STRING database and used Cytoscape to construct and visualize the PPI network (Figure 7A). The core modules related to the VAV family were obtained using the MCODE plug-in (Figure 7B).
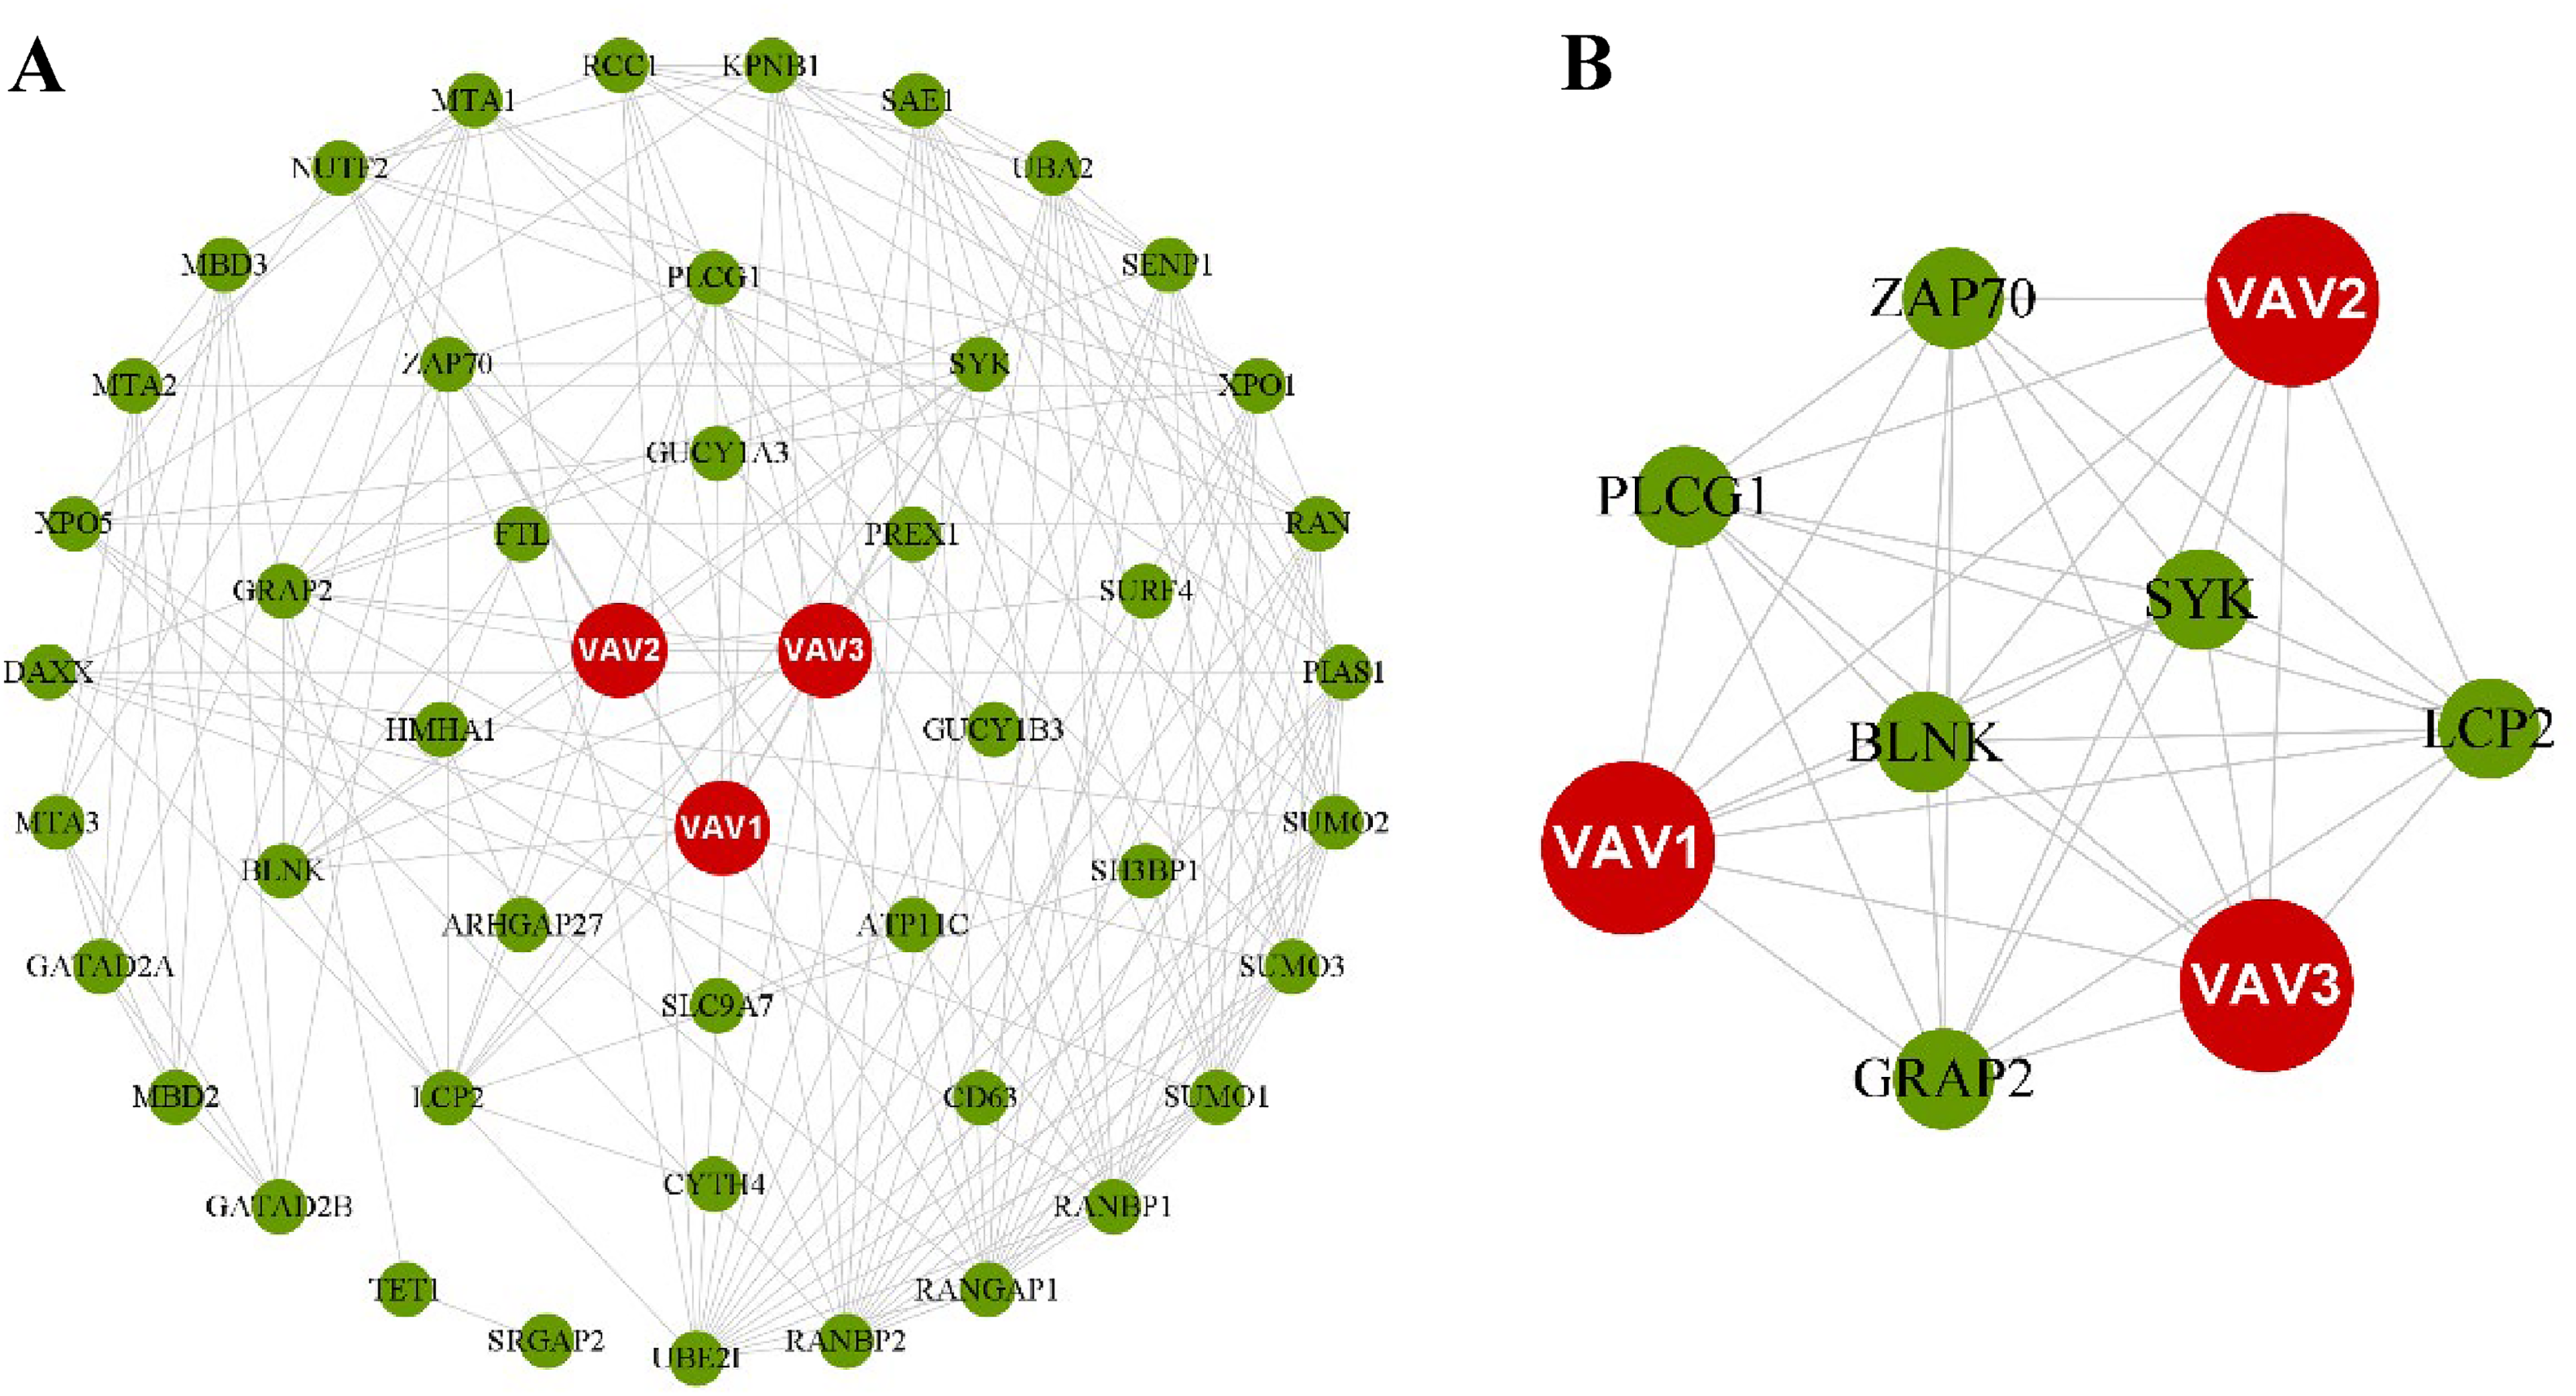
PPI network analysis of VAVs and their co-expressed genes (STRING and Cytoscape). (A) PPI network. (B) Core modules related to VAVs.
GO and KEGG pathway enrichment analyses of VAVs and co-expressed genes
Genes in the core module related to the VAV family were imported into DAVID to obtain enriched GO functions and KEGG pathways (Figure 8A–D).

GO function, and KEGG pathway analysis of VAV family and their co-expressed genes (DAVID). (A) BP:Biological Process. (B) MF:Molecular Function. (C)CC: Celluar Component. (D) KEGG.
VAV-related genes were significantly enriched for various biological processes, including the inflammatory response (GO:0006954) and immune response (GO:0006955) (Figure 8A). A molecular function analysis revealed enrichment for SH3/SH2 adaptor activity (GO:0005070), Rho guanyl-nucleotide exchange factor activity (GO:0005089), guanyl-nucleotide exchange factor activity (GO:0005085), protein binding (GO:0005515), Rac guanyl-nucleotide exchange factor activity (GO:0030676), and epidermal growth factor receptor binding (GO:0005154) (Figure 8B). A cell component analysis revealed that the cytosol (GO:0005829), cell–cell junction (GO:0005911), plasma membrane (GO:0005886), and intracellular structures (GO:0005622) were significantly regulated by VAV family members (Figure 8C). A KEGG analysis showed that the genes were mainly involved in the T cell receptor signaling pathway, natural killer cell-mediated cytotoxicity, B cell receptor signaling pathway, NF-kappa B signaling pathway, leukocyte transendothelial migration, and cAMP signaling pathway (Figure 8D). These results provide potential functions by which differentially expressed VAVs may participate in the occurrence and development of AML.
Discussion
VAVs are highly expressed in a variety of cancers and are associated with prognosis. However, the prognostic value of VAVs in AML remains unclear. Here, we clearly establish the importance of VAV1 expression for prognosis in AML by a bioinformatics approach and analyses of clinical data from our center.
We found that VAV expression levels are significantly elevated in AML based on GEPIA data (Figure 1A) and VAV1, VAV2, and VAV3 levels were higher in clinical AML samples than in the control group (Figure 1B). In addition, we confirmed that VAVs are highly expressed in patients with AML by western blotting (Figure 1C) and PCR (Figure 1D). To explore the value of VAVs in greater detail, we analyzed relationships between VAV expression and the clinical characteristics of patients with AML (Table1 2). In 35 cases of AML at our center and TCGA cases, there were no significant differences in WBC, hemoglobin count, platelet count, and bone marrow blast cell count between the VAV high expression group and VAV low expression group. Data from our center showed that the CR rate was significantly lower in the VAV1 high expression group than in the VAV1 low expression group, with no significant differences in CR rates between the high and low expression groups for VAV2 and VAV3. A TCGA univariate analysis showed that middle- to high-risk stratification and high VAV1 expression predict a shorter OS in AML. A Cox multivariate analysis showed that high expression of VAV1, FLT3 mutation, and high-risk stratification in ELN are independent risk factors affecting patient survival. ELN-2017 is a revised version of the European Leukemia Network (ELN) for the diagnosis and management of adult AML. Previous studies have shown that the ELN-2017 risk classification system is related to the prognosis of patients with AML, with a shorter OS for the middle- to high-risk AML group than the low-risk group. Our results confirmed the significance of FLT3 mutation and ELN risk stratification for the prognosis of AML. In correlation analyses, there was no significant difference in VAV1 expression with respect to the FLT3 mutation status, while VAV1 expression was significantly lower in the low-risk group than in the medium-risk and high-risk groups (Figure 2A, B). By an analysis of 471 patients with AML from the VIZOME database, we again verified that the intermediate and high-risk patients had higher VAV1 expression levels (Figure 2C).
CCLE results showed that VAV expression levels were altered in various tumor cell lines. As shown in Figure 3B, VAV1 was mainly highly expressed in hematological tumors, while VAV2 and VAV3 were also highly expressed in breast cancer, digestive system tumors, and other non-hematological tumors. It has been reported that VAV1 is largely confined to the circulatory system,25,26 while VAV2 and VAV3 are more broadly distributed,27,28 consistent with our analysis using CCLE. An EMBL-EBI analysis also showed that VAVs are highly expressed in different AML cell lines. In particular, the expression levels of VAV1 in various AML cell lines were higher than those of VAV2 and VAV3 (Figure 4A). At the protein level, VAVs were highly expressed in the AML cell lines KG-1 and MV4 to 11(Figure 4B).
The link between VAVs and prognosis has been established in various cancers. For example, in esophageal squamous cell carcinoma tissues, the OS of patients with high VAV1 expression is significantly lower than that of patients with low VAV1 expression (P = 0.014). 6 VAV2 expression is closely related to a poor prognosis in head and neck squamous cell carcinoma 7 and adrenocortical carcinoma. 8 The overexpression of VAV3 may be an independent risk factor for the prognosis of gastric cancer. 10 Therefore, we studied the relationship between VAV expression and prognosis based on 106 AML samples from TCGA and 79 AML samples from GSE12417 dataset. A bioinformatics analysis showed that high expression levels of VAV2 and VAV3 indicated a poor OS of AML, but these relationships were not significant, while high VAV1 expression was significantly correlated with a poor OS in AML (Figure 6A, B). Next, using LinkedOmics, we found that SIPA1, SH2D3C, and HMHA1 levels were significantly positively correlated with VAV1 levels (Appendix 1, 2). Previous studies have shown that HMHA1 significantly promotes the proliferation, invasion, and migration of melanoma cells. 29 SIPA1 deficiency-induced bone marrow niche alterations lead to the initiation of myeloproliferative neoplasm. 30 In hematologic tumors, Singh et al. demonstrated that the significant down-regulation of SH2D3C promotes the premature failure of hematopoietic stem cells and the development of myeloproliferative diseases. 31 Consistent with these previous results, we found that the expression levels of VAV genes were significantly related to the prognosis of AML (Figure 6C). Taken together, our analyses indicate that VAV1 is a potential prognostic marker for patients with AML.
By a PPI network analysis of VAVs and their co-expressed genes (Figure 7A), we obtained core modules related to VAVs (Figure 7B). The genes contained in this module included the VAV family, PLCG1, ZAP70, BLNK, SYK, LCP2, and GLAP2, most of which have been proven by experimental studies to be of great significance in the occurrence, development, and prognosis of hematologic tumors. Spleen tyrosine kinase (SYK) induces the proliferation of AML cells, and the overexpression of SYK promotes the resistance to targeted therapy. The hyperexpression of phosphorylated SYK is associated with a poor prognosis in AML.32–34 The expression of ζ-related protein (ZAP-70) is observed in the vast majority of patients with CLL/SLL and Richter syndrome. 35 B cell linker protein is a selective target of PAX5-PML to inhibit differentiation, which can lead to the development of acute lymphoblastic leukemia. 36 A systematic study of diffuse large B-cell lymphoma has shown that LCP2 is a prognostic marker and its high expression is associated with good survival.37–39 These results confirmed that the functional module identified in our study has important significance in hematological tumors.
To explore the role and function of the core module related to VAVs in hematological tumors, we conducted GO and KEGG pathway enrichment analyses and found that VAVs are mainly involved in the immune response and inflammatory response and in the pathway NF-kappa B and cAMP signaling pathways. Previous studies have shown that the immune response and inflammatory response via NF-κB and cAMP signal transduction play important roles in the development and prognosis of AML. During bone marrow transplantation, the Rac-specific activator VAV1 is critical for the functions of hematopoietic stem and progenitor cells in response to inflammation. 40 NF-κB is a key regulator of inflammatory activation in hematopoietic stem cells. 41 The down-regulation of the NF-κB signaling pathway can inhibit the proliferation of HL60 and K562 leukemia cells and induce apoptosis. 42 An increase in cAMP can reduce inflammation and the immune response. 43 The inhibition of the cAMP signaling pathway leads to resistance to dexamethasone. The synergistic effect of cAMP signaling and dexamethasone can increase the death of human T-ALL cells resistant to GC, resulting in GC re-sensitization in T-ALL. 44 These results show that the immune response and inflammatory response can affect the development and prognosis of leukemia via the NF-κB and cAMP signaling pathways. It is known that the interaction between AML cells and various components of the environment is very complex. The development of combination therapies is an important research topic. Our bioinformatics analysis revealed that VAVs play an important role in immune and inflammatory responses. This suggests that VAVs play a role in the disease via the NF-κB and cAMP pathways. Based on the significance of VAV1 in the prognosis of AML, we speculate that VAV1-targeted therapy, NF-κB signaling pathway inhibitors and cAMP signaling pathway inhibitors may be new directions for improving the prognosis of AML.
This study combined database tools, clinical specimens, and laboratory technology to evaluate AML from multiple perspectives. However, the study had some limitations, including the small number of clinical specimens and the lack of verification of the relationship between FAB subtypes and VAVs. Cell transfection and in vivo experiments were not performed. Further studies are needed to verify the relationship between the VAV family and AML prognosis, and this will be the focus of our future research.
Conclusions
In summary, our results indicated that VAV expression levels are significantly higher in AML than in normal tissues. In particular, high VAV1 expression is significantly related to a poor prognosis, making it a promising prognostic marker and potential therapeutic target for AML.
Ethics Approval and Consent to Participate
This study was carried out in accordance with the guidelines of the Ethics Committee of the *** and was conducted according to the World Medical Association Declaration of Helsinki. It was approved by the Medical Ethics Committee of the *** (NO.:KY2021166) and individual consent for this retrospective analysis was waived.
This study was carried out in accordance with the guidelines of the Ethics Committee of the Affiliated Hospital of Southwest Medical University and was conducted according to the World Medical Association Declaration of Helsinki. It was approved by the Medical Ethics Committee of the Affiliated Hospital of Southwest Medical University (NO.:KY2021166) and individual consent for this retrospective analysis was waived.
Footnotes
Funding
The author(s) disclosed receipt of the following financial support for the research, authorship, and/or publication of this article: This work was supported by the Basic Research Project of Sichuan Province (grant no. 2019YJ0690); and the Major Science and Technology Projects in Sichuan Province (grant no. 2019YFS0531).
Declaration of Conflicting Interests
The author(s) declared no potential conflicts of interest with respect to the research, authorship, and/or publication of this article.
Ethics Approval and Consent to Participate
This study was carried out in accordance with the guidelines of the Ethics Committee of the Affiliated Hospital of Southwest Medical University and was conducted according to the World Medical Association Declaration of Helsinki. It was approved by the Medical Ethics Committee of the Affiliated Hospital of Southwest Medical University (NO.:KY2021166) and individual consent for this retrospective analysis was waived.
Genes correlated to VAVs in AML (LinkedOmics). (A) Volcano map of genes correlated to VAV1 expression in AML, and heat maps of the top 50 genes positively and negatively correlated with VAV1. (B) Volcano map of genes correlated to VAV2 expression in AML, and heat maps of the top 50 genes positively and negatively correlated with VAV2. (C) Volcano map of genes correlated to VAV3 expression in AML, and heat maps of the top 50 genes positively and negatively correlated with VAV3. Gene correlation expression analysis of VAVs (LinkedOmics). (A) The scatter plot shows the Pearson correlation between VAV1 expression and SIPA1, SH2D3C and HMHA1 expression. (B) The scatter plot shows the Pearson correlation between the expression of VAV2 and SRGAP2, MAPK7 and RELL2. (C) Scatter plot showing the Pearson correlation between VAV3 expression and CNST, GUCY1A3 and SLC9A7 expression. Prognostic analysis of VAV expression-correlated genes in AML patients (LinkedOmics). (A) OS curve of SRGAP2, MAPK7, and RELL2 in AML. (B) OS curve of CNST, GUCY1A3, and SLC9A7 in AML.

