
Abstract
Introduction
Renal cell carcinoma (RCC), the tenth mainly occurring malignant cancer worldwide,1,2 has shown an increased incidence over the last decade in the Republic of Korea. 3 RCC is not sensitive to conventional chemotherapy and is at least partly resistant to apoptosis, 4 but is known to be susceptible to lipid repair enzyme glutathione peroxidase-4 (GPX4)-regulated ferroptosis. 5 Ferroptosis is initiated by an increase in the labile iron pool and by production of lipid reactive oxygen species (ROS).6–8 The chelation of iron by deferoxamine rescues the experimental ferroptosis, 9 but inhibition of cysteine uptake or the inactivation of GPX4 induces ferroptosis.6,8 In this context, changes in iron profiles, such as serum iron, ferritin, and transferrin receptor (TfRC), have been suggested as successful chemotherapeutic markers for metastatic RCC, 10 and a variety of iron metabolism genes have been shown to be significantly associated with the survival. 11
The resistance of RCC might be associated with the characteristics of cancer stem cells (CSCs). CSCs, which present characteristics reminiscent of normal stem cells (ie, Oct4, Sox2, c-Myc, and Lgr5), have common features that include maintenance of the stem cell pool, tumorigenesis, metastasis, and treatment resistance and recurrence.12–14 A certain RCC marker (Oct4 or CD105) was found to be specifically expressed in CSCs, although CSC markers are not unique among tumor types. 13 In addition, tumor cells in the non-CSC subpopulation can spontaneously undergo epithelial–mesenchymal transition (EMT) and acquire a CSC-like phenotype and surface marker expression.15–17 High expression of CD44 in RCC also correlated with recurrence and poor prognosis. 18
Altered iron metabolism may differentially contribute to growth inhibition or ferroptosis induction in various RCC cell lines since iron itself contributes to mutagenicity and malignant transformation, and the transformed malignant cells require high amounts of iron for proliferation.7,19 Cancer is highly complex and exhibits a great deal of heterogeneity, and therefore, choosing the right cell line for RCC research has been suggested. 20 An appropriate in vivo RCC model, which shows characteristics similar to human RCC, would be useful for investigating the molecular mechanisms behind various resistances. Herein, we aimed to identify a feasible candidate cell line for RCC model.
Methods
Reagents and Antibodies
MTT was purchased from Amresco, Inc. (VWR International LLC). Deferoxamine mesylate (#D9533), 5-fluorouracil (5-FU; #F6627), poly-2-hydroxyethyl methacylate (#P3932), and sulfasalazine (#S0883) were purchased from Sigma-Aldrich (Merck KGaA), and RSL3 (#B6095) was purchased from APExBIO Technology. Epidermal growth factor (EGF; #PHG0311) and basic fibroblast growth factor (bFGF; #13256029) were purchased from Gibco (ThermoFisher Scientific), and B27 supplement (#17504-044) was purchased from Invitrogen (ThermoFisher Scientific).
The antibodies specific for β-actin (sc-47778; diluted 1:5000), c-Myc (sc-40; diluted 1:1000), E-cadherin (sc-7870; diluted 1:1000), EpCAM (sc-25308; diluted 1:1000), ferritin heavy chain (FTH1; sc-376594; diluted 1:2000), Oct3/4 (sc-5279; diluted 1:1000), SNAIL (sc-271977; diluted 1:1000), Sox2 (sc-365823; diluted 1:1000), TfRC (sc-65882; diluted 1:2000), and vimentin (sc-6260; diluted 1:2000) were purchased from Santa Cruz Biotechnology; CD24 (ab64064; diluted 1:1000), CD44 (ab157107; diluted 1:1000), CD105, EGFR, GPX4, Lgr5, and SLC40A1 (ferroportin, FPN) were purchased from Abcam; and α-smooth muscle actin (A5228; diluted 1:2000; Sigma-Aldrich), CD10 antibody (ready for use; Ventana), CD44-variant 9 (CD44v9/1459; NBP2-53204; diluted 1:1000) (Novus Biologicals), fibronectin (CL54951AP; diluted 1:2000; Cedarlane), PAX8 (ready for use; Roche Diagnostics), and SLC7A11 (cysteine/glutamate transporter [xCT]; ANT-111; diluted 1:1000; Alomone Labs) were purchased as indicated.
Cell Culture
Human kidney proximal tubule cells (HK-2) and RCC cells (Caki-1, Caki-2, SNU-333, SNU-349, and SNU-1272) were purchased from the Korean Cell Line Bank, and cultured according to the supplier’s protocol. HK-2, SNU-333, SNU-349, and SNU-1272 cells were cultured in RPMI-1640 medium, and Caki-1 and Caki-2 cells were cultured in DMEM/high glucose. All media were from Welgene and contained 10% fetal bovine serum and 1% penicillin-streptomycin. The cells were grown in monolayers at 37 °C in a 5% CO2 incubator unless otherwise described.
Cell Viability Assay
The effect of drugs on cell viability was evaluated by MTT reduction to its formazan product. The cells were seeded in triplicate wells of 96-well plates (2 × 10³ cells/well), and treated with 5-fluorouracil, RSL3, sulfasalazine, and deferoxamine at various concentrations. Three days after incubation with each drug, 10 µL of the MTT reagent (5 mg/mL in PBS) was added to each well and the cells were incubated for 3 h, and then dissolved in DMSO for 15 min. The MTT reduction was measured spectrophotometrically at 595 using the absorbance at 620 nm as background by a VERSAmax microplate reader (Molecular Devices Korea LLC).
Sphere-Forming Assay
The sphere-forming assays were conducted as previously reported21,22 with a slight modification. In brief, single-cell suspensions were plated in 96-well plates coated with poly-2-hydroxyethyl methacylate to prevent cell attachment, at a density of 5 × 10² cells in serum-free DMEM/F12 medium (Welgene) supplemented with 1% B27 supplement, 20 ng/mL EGF, and 20 ng/mL bFGF. After 15 days in culture, the number and the size of the spheres per well were acquired.
Western Blotting
Cultured cells were harvested in M-PER mammalian protein extraction reagent (ThermoFisher Scientific) including 1% protease inhibitor cocktail set III (EMD Millipore), 0.5% phosphatase inhibitor cocktail 2, and 0.5% phosphatase inhibitor cocktail 3 (both from Sigma-Aldrich). The protein concentrations were assessed using BCA protein assay (ThermoFisher Scientific) according to the manufacturer’s instructions.
Electrophoresis of the protein in cell lysates was performed with the TGX Stain-Free FastCast™ Acrylamide Starter Kit (Bio-Rad Laboratories, Inc.) using a Tris/glycine buffer system (Bio-Rad Laboratories) and transferred onto PVDF membranes as previously described. 23 The membranes were blocked with 5% skim milk for 1 h and then incubated with primary antibodies overnight at 4 °C. After washing, peroxidase anti-mouse or anti-rabbit IgG antibodies (Vector Laboratories, Inc.) were applied for 1 h at room temperature. Next, Western Lightning Chemiluminescence Reagent (PerkinElmer, Inc.) was used to detect the proteins. Anti-β-actin antibody was used as a loading control on the stripped membranes. The bands were quantified using AzureSpot analysis software (version 14.2; Azure™ c300; Azure Biosystems, Inc.). Each result was first normalized by β-actin and then compared with the results obtained from HK-2 cell as a standard.
Orthotopic RCC Model
All animal experiments were conducted in accordance with and approved by the Jeju National University Institutional Animal Care and Use Committee (2019-0015).
Athymic BALB/c nude mice (7-week-old males) were purchased from OrientBio, housed under standard conditions in a controlled environment with a 12 h dark-light cycle with free access to food and water ad libitum. The mice were randomly divided into 5 groups (n = 5/group), and anesthetized using an intraperitoneal injection of sodium pentobarbital (50 mg/kg, Hanlim Pharm. Co. Ltd). Under aseptic conditions, a small longitudinal incision was made in the left lower back, and each RCC cell (2 × 10⁵ cells/20 µL of Matrigel [BD Biosciences, Becton Dickinson]) was injected with a 27-gauge needle into the renal capsule. Thirty days after injection, the mice were euthanized under deep anesthesia by sodium pentobarbital, the tumor masses explanted and fixed for 24 h in 4% paraformaldehyde, and the fixed tissues were dehydrated and embedded in paraffin wax. Sections (4 µm-thick) were cut with a microtome and prepared for hematoxylin/eosin staining and immunohistochemistry (IHC).
Immunohistochemistry
Commercially available Korean kidney tissue arrays (CL2 kidney cancers) from SuperBioChips Laboratories were used for IHC. The tissue arrays consist of normal (N = 9), stage I (n = 19), stage II (n = 10), stage III (n = 14), and stage IV (n = 4) RCCs, in which the number of clear cell type RCCs was stage I (n = 16), stage II (n = 7), stage III (n = 12), and stage IV (n = 4). GPX4 IHC was performed according to the supplier’s protocol. GPX4 antibody was visualized by staining with a biotinylated anti-rabbit secondary antibody (Vector Laboratories), developed with diaminobenzidine, and counterstained with hematoxylin. For diagnosing RCC, we used the Benchmark XT staining system (Roche Diagnostics) on the orthotopic RCC masses with primary antibodies, CD10 and PAX8 (ready-to-use) as a marker for proximal and distal tubule cells, respectively. Histoscores (H-scores) were calculated by multiplying the intensity score (0 = negative; 1 = weak; 2 = moderate; 3 = strong) and percentage of positive tumor cells (range = 0-100), ranging from 0 to 300.
Statistical Analysis
All data were compiled from a minimum of 3 replicate experiments and expressed as mean ± SD. Statistical significance (P < .05) was tested for by 1-way analysis of variance with a Bonferroni post-hoc test. In case of tissue arrays, a Mann–Whitney U test was conducted to compare the RCCs and normal adjacent tissues and Spearman rank correlation to compare between stages and H-scores with SPSS software, version 27 (SPSS Inc.).
Results
RCCs Exhibit Lower GPX4 Immunostaining
GPX is strongly expressed in normal tubular epithelial cells, while RCCs show varying degree of expressions as follows: weak expression in a clear cell type, moderate expression in a collecting duct type, and strong expression in a papillary cell type. H-score showed that clear cell RCC is significantly lower among groups (P < .001). The intensity of GPX4 immunostaining was significantly lower in RCC tissue compared to normal human kidney (P = .001), while there were no considerable changes among stages (Figure 1).

GPX4 immunostaining of human renal cell carcinoma (RCC) tissue array. GPX4 immunostaining is significantly weak in clear cell RCC compared with normal tubular epithelial cells. Expression of GPX was considerably low in RCCs, but there were no considerable changes among stages. **P < .01, ***P < .001 versus normal adjacent kidney.
Primary RCCs Show Resistance to Ferroptosis
The effects of ferroptosis inducers (RSL3 and sulfasalazine) and a ferroptosis inhibitor (deferoxamine) on cell viability were assessed using the MTT assay (Figure 2). The IC50 values of HK-2, Caki-1, Caki-2, SNU-333, SNU-349, and SNU-1272 cells with RSL3 were 0.05, 0.39, 0.45, 4.16, 0.46, and 0.44 μM, respectively. The IC50 values of cells as listed above with sulfasalazine were 2.7, 0.4, 2.5, 2.7, 2.9, and 2.6 mM, respectively. The IC50 values of cells as listed above with deferoxamine were 55.3, 35.2, 53.8, 289.8, 370.9, and 48.7 μM, respectively.

Cell viability of renal cell carcinoma (RCC) cells treated with ferroptosis-related compounds. The effects of RSL3 (GPX4 inhibitor), sulfasalazine (SSZ, xCT inhibitor), and deferoxamine on cell viability were assessed by MTT assay. All RCC cell lines showed considerably higher IC50 values for RSL3 compared to HK-2 cells, and primary RCC cell lines also showed significant differences compared to Caki-1 cells. Caki-1 cells showed significantly lower IC50 values with SSZ and deferoxamine compared to HK-2 cell, but the primary RCC cell lines showed considerably higher IC50 values compared to HK-2 and Caki-1 cells, respectively. *P < .05, **P < .01, and ***P < .001 versus HK-2 cells. #P < .05, ##P < .01, and ###P < .001 versus Caki-1 cells.
Caki-2 and SNU-333 Cells Show Increased Levels of CSC or Tumor Markers
Ferroptosis-related proteins were first assessed in the RCC cell lines (Figure 3). Compared to HK-2 cells, only Caki-2 cells showed significantly increased levels of GPX4 (P = .012), xCT (P = .047), TfRC (P = .018), and FTH1 (P = .011). SNU-333 cells showed significantly increased levels of FTH1 (P = .006).

Quantitative results of ferroptosis-related markers. Representative images of Western blots and densitometry of ferroptosis-related markers. Caki-2 cells showed significantly increased levels of GPX4, xCT, TfRC, and FTH1, whereas Caki-1 cells showed decreased levels of GPX4, xCT, and TfRC compared to HK-2 cells. SNU-333 cells showed significantly increased levels of FTH1, while the other markers were comparable to those of HK-2 cells. *P < .05, **P < .01, ***P < .001 versus HK-2 cells.
We next assessed CSC and tumor markers in the RCC cell lines (Figure 4A). Compared to HK-2 cells, only Caki-2 cells showed significantly increased levels of Sox2 (P < .001), c-Myc (P = .029), and CD105 (P = .001), while Caki-1 cells only showed increased levels of Sox2 (P = .017). SNU-333 cells showed significantly increased levels of Sox2 (P = .012), c-Myc (P < .001), and Lgr5 (P = .032). SNU-349 cells had elevated levels of c-Myc (P = .001).

Quantitative results of cancer stem cell and tumor markers. (A) Representative images of Western blots and densitometry of cancer stem cell and tumor markers. Caki-2 cells showed significantly increased levels of Sox2, c-Myc, and CD105, while Caki-1 cells showed decreased levels of Sox2 compared to HK-2 cells. SNU-333 cells showed significantly increased levels of Sox2, c-Myc, and Lgr5. (B) Representative images of Western blots and densitometry of surface tumor markers. Caki-2 cells showed significantly increased levels of CD24 and CD44, while others showed reduced or comparable levels to HK-2 cells. *P < .05, **P < .01, ***P < .001 versus HK-2 cells.
Epithelial (CD24) and mesenchymal (CD44 and CD44v9) surface markers were assessed in the RCC cell lines (Figure 4B). Compared to HK-2 cells, Caki-2 cells showed significantly increased levels of CD24 (P = .012) and CD44 (P = .004).
Caki-1 and SNU-333 Cells Exhibit Tumorigenic Capacity In Vitro
Following 2 weeks of sphere-forming assay (Figure 5A), only Caki-1 and SNU-333 cells successfully formed spheres. The number of renospheres of SNU-333, SNU-349, and SNU-1272 cells was significantly lower than Caki-1 cells (P < .001). The mean sizes of the renospheres of SNU-333 cells showed significantly bigger than Caki-1 cells (P = .005). Caki-2 (P < .001) and SNU-333 (P = .001) cells showed significantly higher EGFR expression than HK-2 cells (Figure 5B).
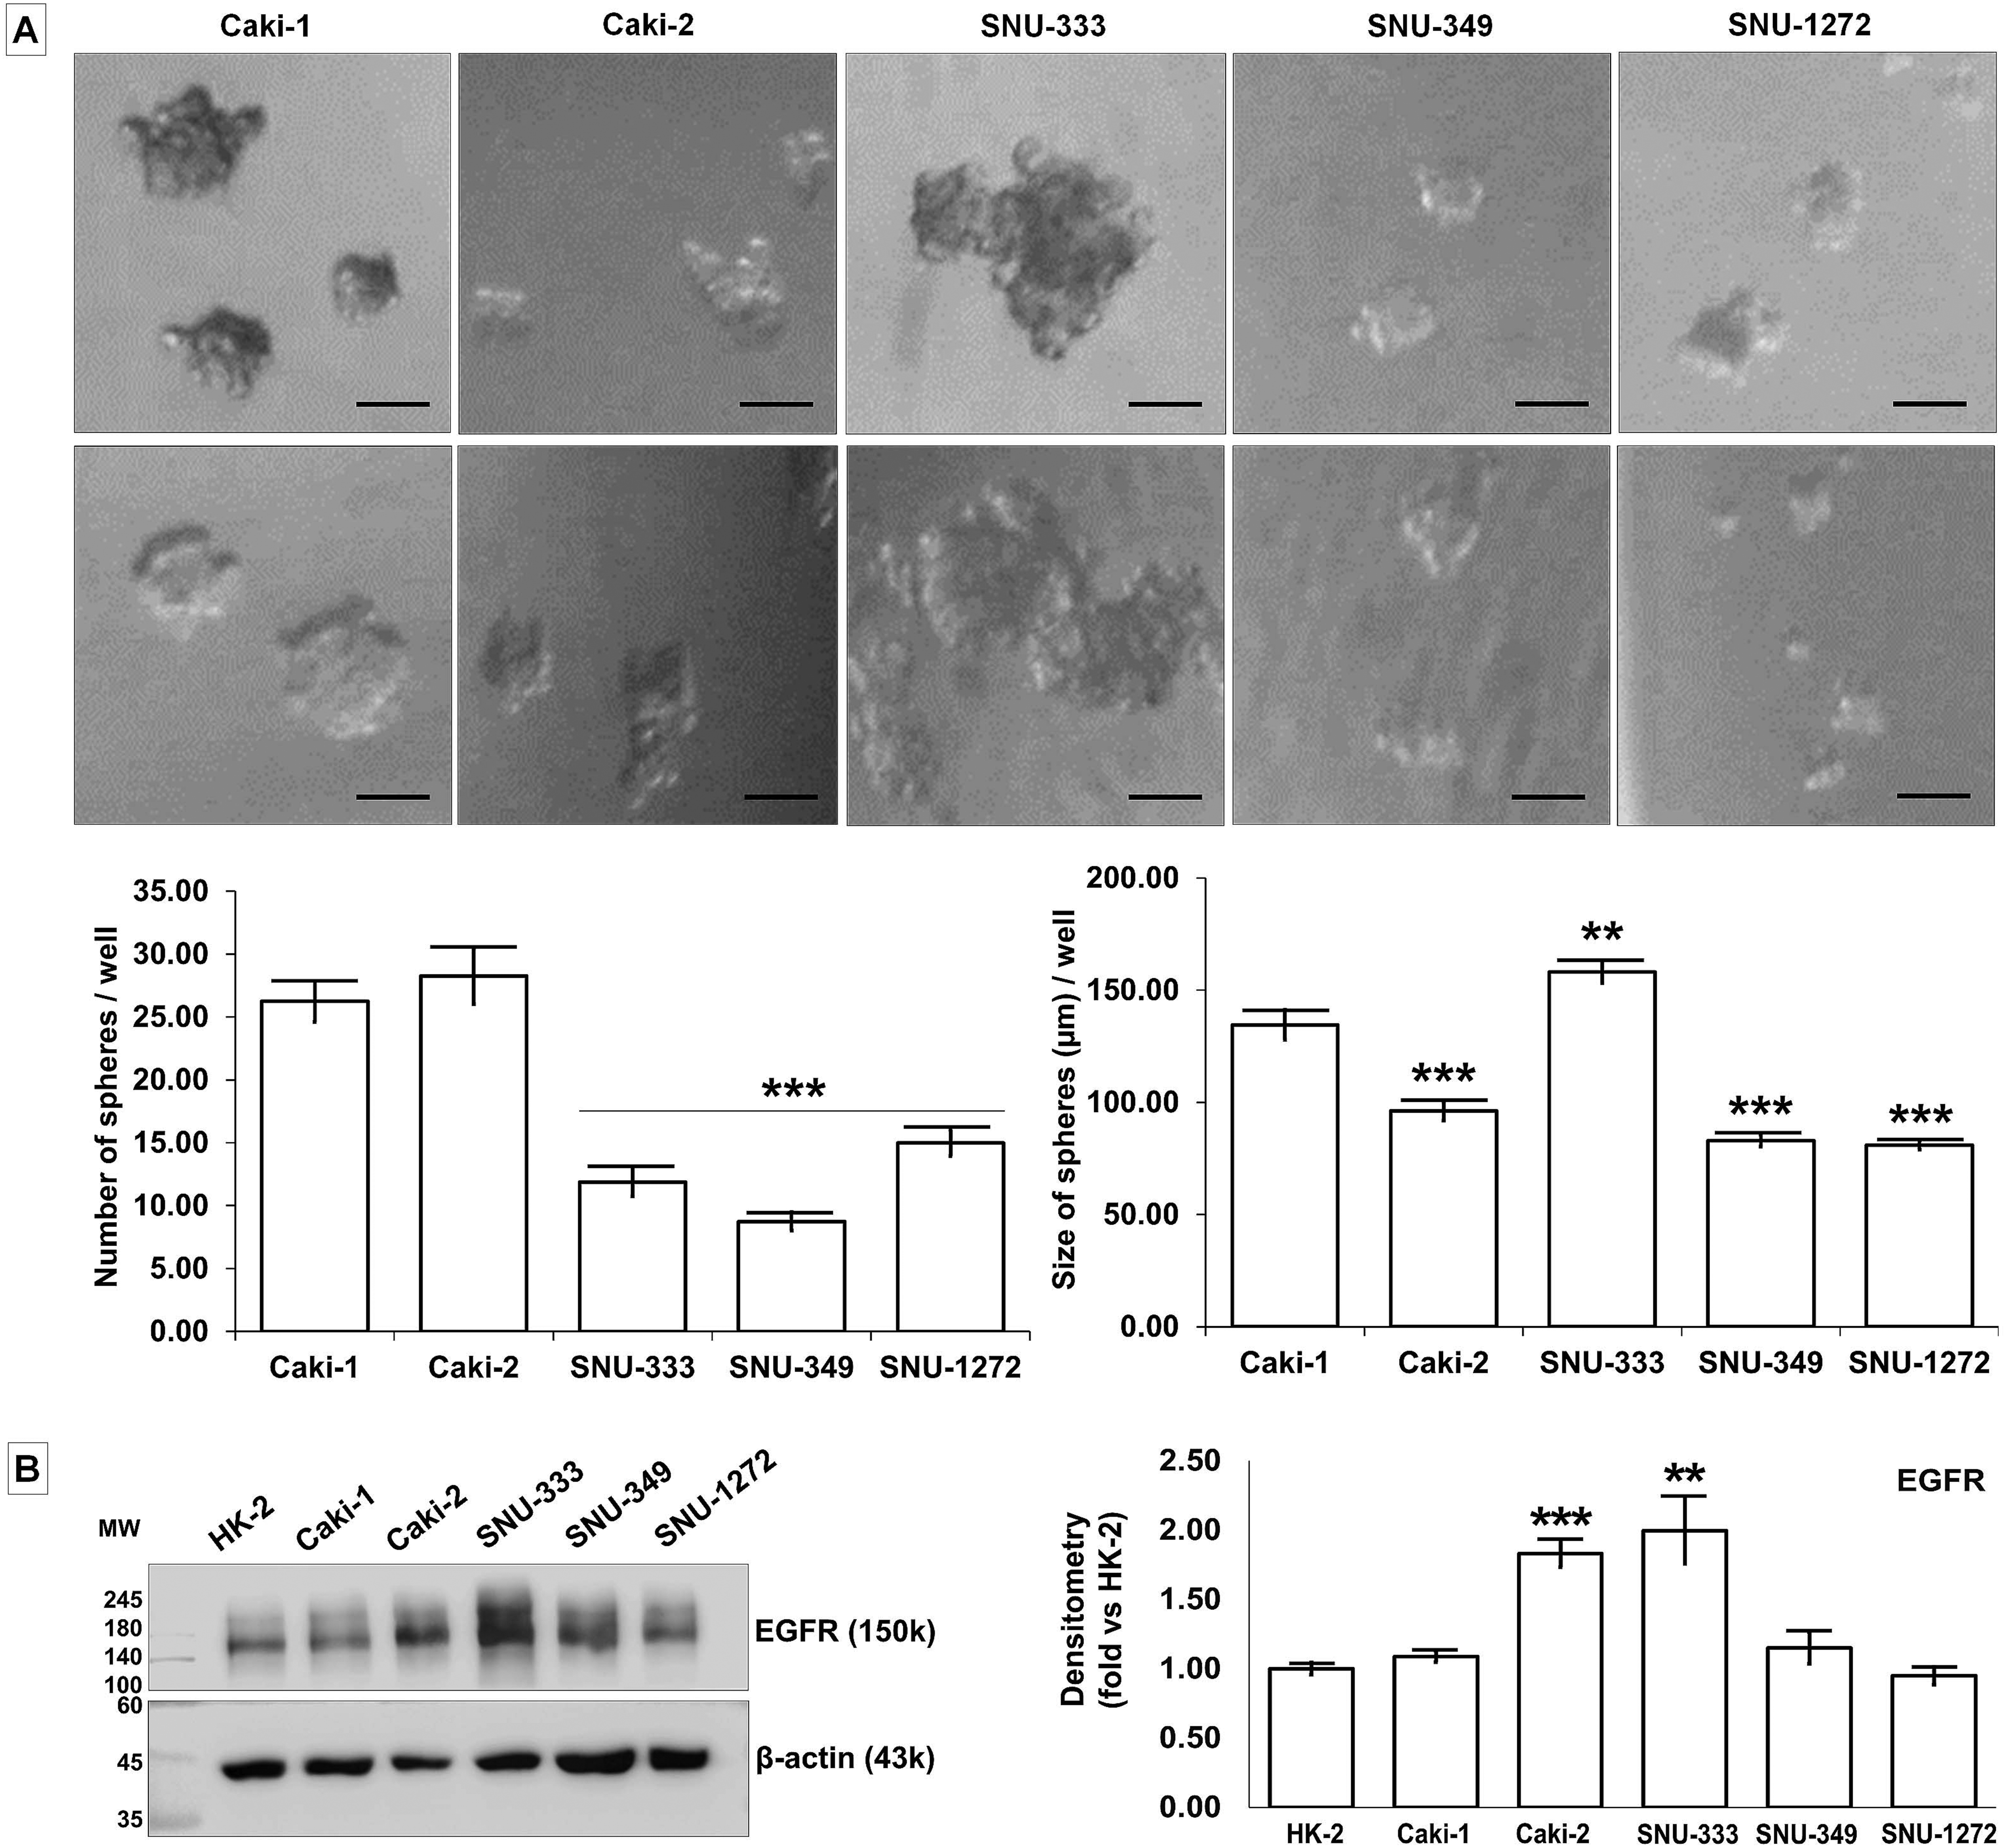
Sphere formation and tumorigenic capacity of renal cell carcinoma (RCC) cell lines. (A) Representative images of the morphology of renospheres grown in suspension culture in serum-free media supplemented with growth factors. The number of renospheres was significantly lower in SNU-333, SNU-349, and SNU-1272 cells compared to Caki-1 cells. SNU-333 renospheres were bigger than those produced by Caki-1 cells. Scale bar = 100 μm. **P < .01, ***P < .001 versus Caki-1 cells. (B) Representative images of Western blots and densitometry of EGFR. Caki-2 and SNU-333 cells showed significantly increased levels of EGFR compared to HK-2 cells. *P < .05 versus the HK-2 cell.
As the sphere-forming assay inhibits adhesion of cells and formation of monolayers, EMT markers were assessed (Figure 6). All RCC cell lines showed significantly higher levels of αSMA (P < .001) compared to HK-2 cells. Caki-2 cells showed significantly increased levels of fibronectin (P = .007), vimentin (P = .011), and SNAIL (P = .012), but decreased levels of E-cadherin (P < .001) compared to HK-2 cells. SNU-333 cells showed significantly increased levels of E-cadherin (P < .001) and EpCAM (P = .005) compared to HK-2 cells.

Quantitative results of epithelial–mesenchymal transition (EMT) markers. Representative images of Western blots and densitometry of EMT markers. All RCC cell lines showed significantly higher levels of αSMA. Caki-2 cells showed significantly increased levels of fibronectin, vimentin, and SNAIL, while SNU-333 cells showed significantly increased levels of E-cadherin and EpCAM compared to HK-2 cells. *P < .05 versus the HK-2 cell.
SNU-333 Cells Exhibit Tumors Similar to Human RCC In Vivo
Among the orthotopically injected RCC cell lines, Caki-1 and SNU-333 cells successfully formed tumor masses. Caki-1-bearing tumors consisted of spindle tumor cells with marked nuclear pleomorphism and desmoplasia, whereas SNU-333-bearing tumors consisted of epithelioid tumor cells with clear or granular cytoplasm (Figure 7A).

Orthotopic renal cell carcinomas (RCCs) established from RCC cell line injections. (A) Representative images of the orthotopic RCC masses (demarked boundaries by dotted line) in BALB/c nude mice. Hematoxylin/eosin (H/E) staining showed that Caki-1-bearing tumors (asterisk) consisted of spindle tumor cells with marked nuclear pleomorphism and desmoplasia, but SNU-333-bearing tumors (arrow) consisted of epithelioid tumor cells with clear or granular cytoplasm. (B) Immunohistochemistry of the orthotopic RCC masses. Proximal and distal tubules (positive control) show strong staining of CD10 and PAX8, respectively. Compared with Caki-1-induced tumors, SNU-333-induced tumors showed strong expression of CD10 and PAX8. ***P < .001 versus Control. ###P < .001 versus Caki-1-induced tumors.
Normally, the epithelial cells of proximal tubules show strong membranous staining of CD10 and distal tubular epithelial cells show nuclear staining of distal tubules (Figure 7B). IHC showed focal CD10 and PAX8 immunopositivity in Caki-1 bearing tumors. Compared with Caki-1, SNU-333-bearing tumors showed strong expression of CD10 and PAX8 (Figure 7B).
Discussion
While Caki-1 cells were resistant to 5-FU but susceptible to ferroptosis as previously reported.4–6,8,9 Caki-2 and SNU-333 cells showed resistance to ferroptosis and 5-FU when compared to Caki-1 and/or HK-2 cells. Caki-2 cells showed significantly increased levels of GPX4 and xCT compared to the other cell lines, which may be the basic mechanisms which underlies the resistance to ferroptosis. The GPX4-mediated resistance to ferroptosis in Caki-2 cells is consistent with recent studies reporting that clear cell RCC is hypersensitive to GPX4 knockdown 24 and demonstrates vulnerability to ferroptosis via GPX4 dependency. 25 As Caki-2 cell was recently confirmed as a papillary RCC, 20 the increased GPX4 mainly confers to the resistance to ferroptosis. In addition, Caki-2 cells exhibited significantly increased levels of TfRC and FTH1 and SNU-333 cells showed increased levels of FTH1, which may represent another mechanism for the resistance. Iron is usually dysregulated in cancers and cancer cells often show higher levels of TfRC, downregulation of FPN, and lower levels of ferritins, which together lead to an increase in the intracellular labile iron pool.7,19 Although iron is mostly utilized for tumor growth by cytosolic and mitochondrial iron enzymes, excessive amounts can promote increased oxidative stress and result in ferroptosis. Caki-2 and SNU-333 cells showed paradoxically increased levels of FTH1, which is comparable in effect to a decreased intracellular labile iron pool and may lead to the resistance to ferroptosis. This was also reinforced by the results with deferoxamine, in which SNU-333 exhibited a higher IC50 value. Although deferoxamine inhibits xCT-dependent ferroptosis, 26 it also binds to iron making it unavailable for use in the cell and eventually inhibits proliferation. SNU-333 cells were less affected by deferoxamine-induced iron chelation as compared to Caki-2 cells, which might be another mechanism contributing to the ferroptosis resistance of the SNU-333 cell.
Although the CSC markers are not unique across tumor types, 13 normal stem cell markers and CSC markers illustrate the presence of stem cell characteristics in RCCs.12,13 Caki-2 cells showed increased levels of Sox2 and CD105, whereas SNU-333 cells showed increased levels of c-Myc and Lgr5 compared to the other RCC cell lines. In addition, only Caki-2 cells showed elevated levels of CD24 and CD44. Ishimoto et al 26 suggested that overexpression of CD44v(8-11) could stabilize xCT in the gastrointestinal cancer cells, which increases intracellular glutathione and eventually induces resistance to ROS. However, we did not find increased CD44v9 in any RCC cell line. Therefore, surface markers showed that RCC cell lines are more epithelial in nature rather than mesenchymal, with the exception of Caki-2 cells. As non-CSCs can acquire a CSC-like phenotype during EMT15,16 and EMT-induced cells form spheres, 17 a sphere-forming assay was conducted. As Caki-1 cell line was reported to form more spheres compared to Caki-2 cells, 22 the former was considered a positive control. Of the RCC cell lines tested, SNU-333 cells formed bigger renospheres, which were coincided with the expression of significantly higher levels of EGFR. Mizumoto et al 27 suggested that acquired resistance to sunitinib in RCC cells may be related to the activation of EGFR. Since the sphere-forming assay is anchorage-independent in culture, 13 EMT properties were examined. The RCCs showed significantly increased levels of αSMA, while Caki-2 cells showed increased fibronectin, vimentin, and SNAIL, and SNU-333 cells demonstrated increased E-cadherin and EpCAM. Interestingly, SNU-333 cells exhibited soluble E-cadherin (80 kDa), which was known to activate EGFR as a kind of oncogene. 28 Therefore, increased EGFR in SNU-333 cells might play a role in resistance, as well as sphere formation.
Finally, to evaluate the tumorigenic potential of RCCs in vivo, Caki-1 and SNU-333 cells successfully formed orthotopic tumor masses. The orthotopic masses were rarely immunostained with GPX4 while normal tubules were consistently positive, which was similar to the results seen with the human RCC tissue array. Based on the histologic and CD10 and PAX8 immunostaining results, SNU-333 cell line showed staining patterns that were originated from renal tissue similar to human RCC. Metastatic RCC cells, including Caki-1 cells, have been used to induce orthotopic RCC models.29,30 However, these established orthotopic RCC models may not be appropriate for ferroptosis-related research because this study showed that Caki-1 cells are susceptible to ferroptosis and are not similar to human RCC. Using the most appropriate cell line is crucial to furthering our understanding of RCC. In contrary to Caki-1 cells, SNU-333 cells showed resistance to ferroptosis, tumorigenic capacity in vitro and in vivo, and histological characteristics similar to human RCC. Therefore, SNU-333 cells could be used to induce an orthotopic RCC model to explore newly emerging cancer therapeutic strategies.
In conclusion, SNU-333 cell line exhibited resistance via iron metabolism and stemness, and further, had tumor-initiating capacities in vitro and in vivo. These results suggest that SNU-333 cell line was the most promising for the establishment of an orthotopic RCC model for further research, including an era of ferroptosis, drug resistance, and CSCs.
Footnotes
Abbreviations
Acknowledgments
We thank Dr Euihyeon Na (Department of Neuropsychiatry, Presbyterian Medical Center, Jeonju, Republic of Korea) for the support on the statistical analysis.
Authors’ Note
O.T., I.Y.C., and S.P.Y. conceived and designed the present study, and wrote the manuscript. O.T., I.Y.C., D.M., Y.H.M., and B.J. performed the experiments for data acquisition and analysis. O.T., I.Y.C., and S.P.Y. interpreted the experimental results. All authors read and approved the final manuscript. The data and materials in the current study are available from the corresponding author on responsible request. All animal experiments were conducted in accordance with and approved by the Jeju National University Institutional Animal Care and Use Committee (2019-0015).
Declaration of Conflicting Interests
The authors declared no potential conflicts of interest with respect to the research, authorship, and/or publication of this article.
Funding
The authors disclosed receipt of the following financial support for the research, authorship, and/or publication of this article: This work was supported by the National Research Foundation of Korea (NRF) funded by the Ministry of Education (grant number 2018R1D1A1A02050497).