
Abstract
Purpose:
Quantitative features from pre-treatment positron emission tomography (PET) have been used to predict treatment outcomes for patients with cervical carcinoma. The purpose of this study is to use quantitative PET imaging features and clinical parameters to construct a multi-objective machine learning predictive model.
Materials/Methods:
Seventy-five patients with stage IB2-IVA disease treated at our institution from 2009–2012 were analyzed. Models predicting locoregional and distant failure were generated using clinical parameters (age, race, stage, histology, tumor size, nodal status) and imaging features (12 textural, 9 intensity, 8 geometric features, 2 additional imaging features) from pre-treatment PET. Model features were selected based on a multi-objective evolutionary algorithm to maximize specificity given a fixed moderately high sensitivity using support vector machine learning methods. Model 1 used clinical parameters only (C), Model 2 used imaging features only (I), and Model 3 used clinical and imaging features (C+I). Sensitivity, specificity, area under a receiver-operating characteristic curve (AUC), and p-values were compared to assess ability to predict locoregional and distant failure.
Results:
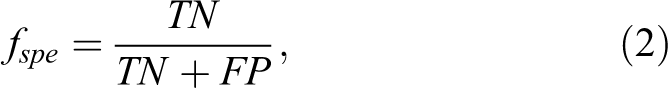
C+I had the highest performance for both locoregional failure (AUC 0.84, p < 0.01; specificity: 0.86; sensitivity: 0.79) and distant failure (AUC 0.75, p < 0.01; specificity: 0.75; sensitivity: 0.75).
Conclusions:
Based on a moderately high fixed sensitivity and optimized for specificity, the model using both clinical parameters and imaging features (C+I) had the best performance in predicting both locoregional failure and distant failure.
Introduction
[18F] fluoro-2-deoxy-D-glucose (FDG) based positron emission tomography (PET) imaging has become increasingly utilized for radiation therapy treatment planning 1 and to characterize metabolic aspects of the target tumor. 2 -4 Allal et al demonstrated the prognostic value of standardized uptake value (SUV) from pre-treatment PET in patients with head and neck cancer treated with radiation with or without chemotherapy. 5 Patients with tumors with high tumor SUV max had a significantly lower 3-year local control (55% vs. 86%, p = 0.01) and disease-free survival (42% vs. 79%, p = 0.005) compared to patients with tumors with low FDG uptake. In the setting of cervical cancer, 287 patients with Stage IA2-IVB disease who underwent pre-treatment PET followed by surgery, chemoradiation, or palliation were assessed for SUVmax, tumor volume, sites of lymph node metastases, and histology, and only SUVmax was identified as an independent predictor of death from cervical cancer. 6
Development of a range of complex image analytics has led to the expansion of the field of “radiomics,” which utilizes data beyond the single value represented by SUVmax, a value limited by patient-specific and image-acquisition-specific factors. 7,8 Radiomics is a method of quantitative data extraction from radiographic imaging to find image correlates to tumor characteristics. 9,10 A potential application is to identify complex image intensity, shape, and textural features that predict a tumor’s behavior, response to treatment, and oncologic outcomes, but very few multi-parametric studies have looked at these relationships. 11
In cervical carcinoma, even with optimal therapy, at least 20% of patients with locally advanced disease confined to the pelvis will fail distantly. 12,13 Identifying these patients early may allow physicians to tailor their treatment to achieve a more durable treatment response and prevent distant failure with additional systemic treatment. The goal of this study is to build a predictive model, using pre-treatment clinical and imaging characteristics, that determines likelihood of locoregional and distant failure for cervical carcinoma patients, enabling the selection of patients who should be considered for further systemic therapy. While radiomics analyses have been explored for treatment outcome prediction for cervical carcinoma after radiation or chemoradiation therapy, 14 -19 these analyses often focus on some individual radiomic features or use a single objective during the model training. In this work, we present a multi-objective model to predict distant failure and locoregional failure for cervical carcinoma patients.
Methods and Materials
Patients and Clinical Parameters
Following institutional IRB approval at UT Southwestern Medical Center (approval no. 082013-008), departmental records were reviewed to identify patients treated for cervical carcinoma with definitive intent between 2009 and 2012, allowing time for follow-up. Because this is retrospective review study, informed consent was waived. Patients with stage IB2-IVA disease treated with definitive chemoradiation and high dose rate (HDR) intracavitary brachytherapy (without outback chemotherapy), with complete clinical data and retrievable pre-treatment PET/CT scans were identified (n = 75). A retrospective analysis of clinical parameters, pre-treatment PET/CT imaging characteristics and features, and oncologic outcomes for these patients was performed.
These 75 patients (characteristics described in Table 1) were used to build the locoregional and distant failure prediction models. Clinical parameters (age, race, stage, histology, tumor size, and nodal status at diagnosis) were obtained from chart review.
Patient Characteristics.

Events were defined as follows: local failure (LF) includes failure in the area receiving high-dose treatment, including cervix, pelvic side wall, parametria, vagina; regional failure (RF) includes failures occurring in areas receiving external beam alone, including pelvic lymph nodes; distant failure (DF) includes distant metastases, including para-aortic lymph nodes (unless included in the treatment field); and locoregional failure (LRF) is any combination of LF and RF events. Only LRF and DF were analyzed as outcomes for the model; the models were designed to predict for these outcomes.
PET/CT images were acquired with a Siemens Biograph 64 (Siemens Medical Solutions USA, Inc. Malvern, PA USA) with 4 detector rings, a spatial resolution of 7-8 mm, and a slice thickness of 5 mm. Segmentation of patients’ primary tumor was performed on pre-treatment PET and CT imaging using the imaging informatics system Velocity (Varian, Palo Alto, CA). The clinical target volume (CTV), including the anatomical cervix and PET-positive extension of tumor, was contoured by the clinician investigators using SUV-based thresholding on the primary cervical lesion to include all the PET-avid areas with an SUVmax value of ≥4 into the CTV (excluding the bladder) for purposes of subsequent analysis. SUV-based intensity metrics were calculated within the edited ROI, and additional image features (referred to as texture and geometry features) were extracted. For intensity features, the mean, median, standard deviation, maximum and minimum value, skewness, kurtosis, and variance were calculated based on the intensity histogram. Before extracting the texture features, a gray level co-occurrence matrix (GLCM) was constructed, using histograms with 64 bins and 3D analysis of the tumor region with 26 neighboring voxels and 13 directions in 3D space. Construction of this GLCM allowed 12 texture features to be extracted. Geometry features (a description of the shape, size, or the relative position of the tumor), metabolic tumor volume (MTV), which is defined as the volume of tumor having at least 40% of max SUV, and total lesion glycolysis (TLG), which is defined as TLG = MTV*mean SUV, were obtained. The complete list of clinical and imaging features used in this study is in Table 2.
List of Clinical and Imaging Features.

MTV = metabolic tumor volume. TLG = total lesion glycolysis.
Multi-Objective Predictive Model Construction
In most radiomics studies, predictive models are constructed based on a single objective such as overall accuracy or AUC.
11
However, overall accuracy alone may not be a good measure for the predictive models, which can lead to low sensitivity or specificity when positive and negative events are imbalanced in training datasets.
20
Although AUC provides a better measure than overall accuracy by taking both sensitivity and specificity into account, it can be a misleading measure of the predictive model performance.
21
-24
Lobo et al summarized 5 drawbacks of AUC measure as follows: “(1) it ignores the predicted probability values and the goodness-of-fit of the model; (2) it summarizes the test performance over regions of the ROC space in which one would rarely operate; (3) it weights omission (falsely predicted positive fraction) and commission errors (falsely predicted negative fraction) equally; (4) it does not give information about the spatial distribution of model errors; and, most importantly, (5) the total extent to which models are carried out highly influences the rate of well-predicted absences and the AUC scores.”
21
To overcome the limitations of the conventional single-objective based models, a multi-objective radiomics model was designed to train the predictive model, where both sensitivity and specificity are considered as the objective functions simultaneously. Assume that sensitivity and specificity are denoted by
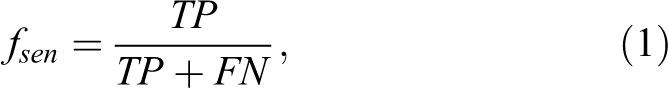
where

where
To systematically investigate the influence of the input of different features, 3 versions of the models were built to predict each of the 2 primary outcomes, LRF and DF (total of 6 models). The first model used clinical parameters only (age, race, stage, histology, tumor size, and nodal status at diagnosis); the second model used imaging features only (including intensity, texture, geometric features, and an expanded set of imaging features that included MTV and TLG); the third model used a combination of clinical and all imaging parameters. Not every clinical and imaging parameter was significant for each outcome; the models were built on all available features and the minimum optimal set was selected during the model optimization by IMIA.
Experimental Setup and Evaluation
This study used IBM SPSS Statistics Software version 24 (IBM, Armonk, NY) to perform correlation and survival analysis and to generate receiver-operating characteristic (ROC) curves. Sensitivity, specificity, AUC, and the p-value of the ROC function were compared for each model. All the experiments were run 10 time, and mean as well as standard deviation values are calculated. ROC curves were compared with the unpaired t-test at a significance level of 0.05. The model was built in MATLAB2019b. All the features are extracted full-automatically. Five-fold cross validation is performed for all the models. In our experiment, each fold in cross validation can be considered as held-off set in each test as this fold has never been seen by the model trained on the other 4 folds.
Results
Median follow-up time for the study population was 27.4 months (range: 3.4-83.5 months, 3 patients with <6 months follow up). Follow-up was short for some patients due to non-compliance. The median number of external beam radiation therapy fractions was 25 at a median dose per fraction of 180 cGy. Patients received a median number of 5 fractions of HDR intracavitary brachytherapy at a median dose per fraction of 600 cGy.
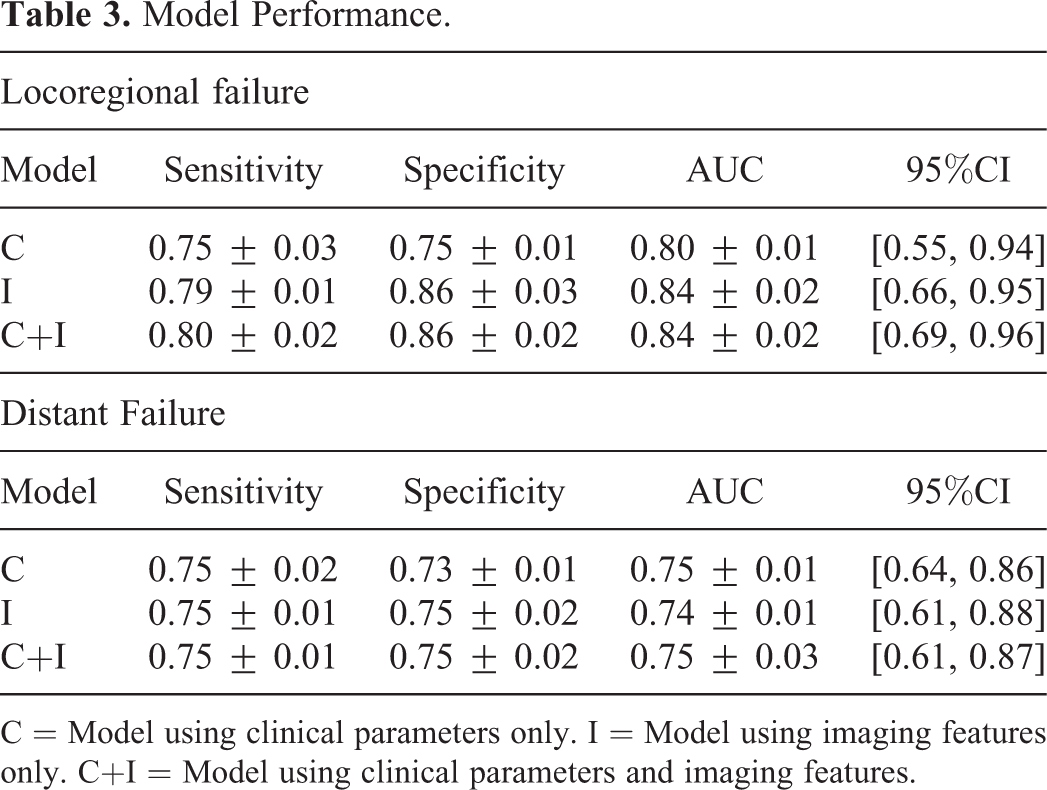
The sensitivity, specificity, area under the ROC curve (AUC), and p value for each predictive model is listed in Table 3. Additionally, we assessed the ability of each clinical parameter and each imaging parameter to predict outcomes. These data are provided in Table 4. When compared to the 3 versions of the models for each outcome, the combined model using both clinical and imaging features as input outperformed the other models that used clinical or imaging features alone (Figure 1). The combined model using both clinical and imaging features had excellent prognostic power for locoregional failure, with an AUC of 0.84 (p < 0.01) and specificity of 0.86 at a sensitivity of 0.80, and for distant failure, with an AUC of 0.75 (p < 0.01) and specificity of 0.75 at a sensitivity of 0.75. The combined model also outperformed all individual clinical and imaging parameters. Of note, as shown in Table 4, using stage alone had very poor predictive value and was not a significant predictor for LRF or DF for the 2 groups of patients. The selected features in 3 models for locoregional failure and distant failure are shown in Tables 5 and 6. When predicting locoregional failure, 3, 13 and 13 features are selected for C, I and C+I models, respectively. In these features, stage is selected in both C and C+I models, while SUV_median, SUV_kurtosis, Energy, Cluster tendency are selected in both I and C+I models. The number of selected features in 3 models for distant failure is 5, 9, 8 for C, I and C+I models, respectively. Age and nodal status are selected in both C and C+I. SUV_var, SUV_kurtosis, and MTV are selected in both I and C+I models. We also evaluated the importance of each individual selected feature, which adopted the same strategy in our previous study34. Specifically, for each test sample, we manually changed each selected feature value to their minimal and maximal value, and then the modified test sample is fed into the trained model. The importance of individual feature can be evaluated by the AUC change of prediction model as shown in Tables 5 and 6. A larger difference indicates the greater contribution of this feature on prediction results. The important features for locoregional failure prediction are Stage, Correlation and Variance, while Stage, SUV Kurtosis and MaxProbability are the important features for distant failure prediction, respectively. To better visualize the change, the magnitude of AUC changes for all the selected features in the 6 models are shown in Figure 2. A larger difference indicates the greater contribution of this feature on prediction results. Since volume is an important feature in many outcome predictions, we also evaluate the performance based on volume alone. We calculated the AUC values for the volume alone, which are 0.41 and 0.39 for locoregional and distant failure prediction, respectively. The corresponding ROC curves are shown in Figure 3.
Model Performance.
C = Model using clinical parameters only. I = Model using imaging features only. C+I = Model using clinical parameters and imaging features.
Individual Performance of Each Clinical and Imaging Feature.


Receiver-operating characteristic (ROC) curves for the 4 models to predict for distant failure. Blue line = C = Model using clinical parameters only. Orange line = I = Model using imaging features only. Yellow line = C+I = Model using clinical parameters and imaging features.
Selected Features and Importance Analysis of Individual Feature for Locoregional Failure Prediction.

AUC-min value and AUC-max value correspond to the results using the minimal or maximal value of the corresponding feature, respectively.
Selected Features and Importance Analysis of Individual Feature for Distant Failure Prediction.

AUC-min value and AUC-max value correspond to the results using the minimal or maximal value of the corresponding feature, respectively.
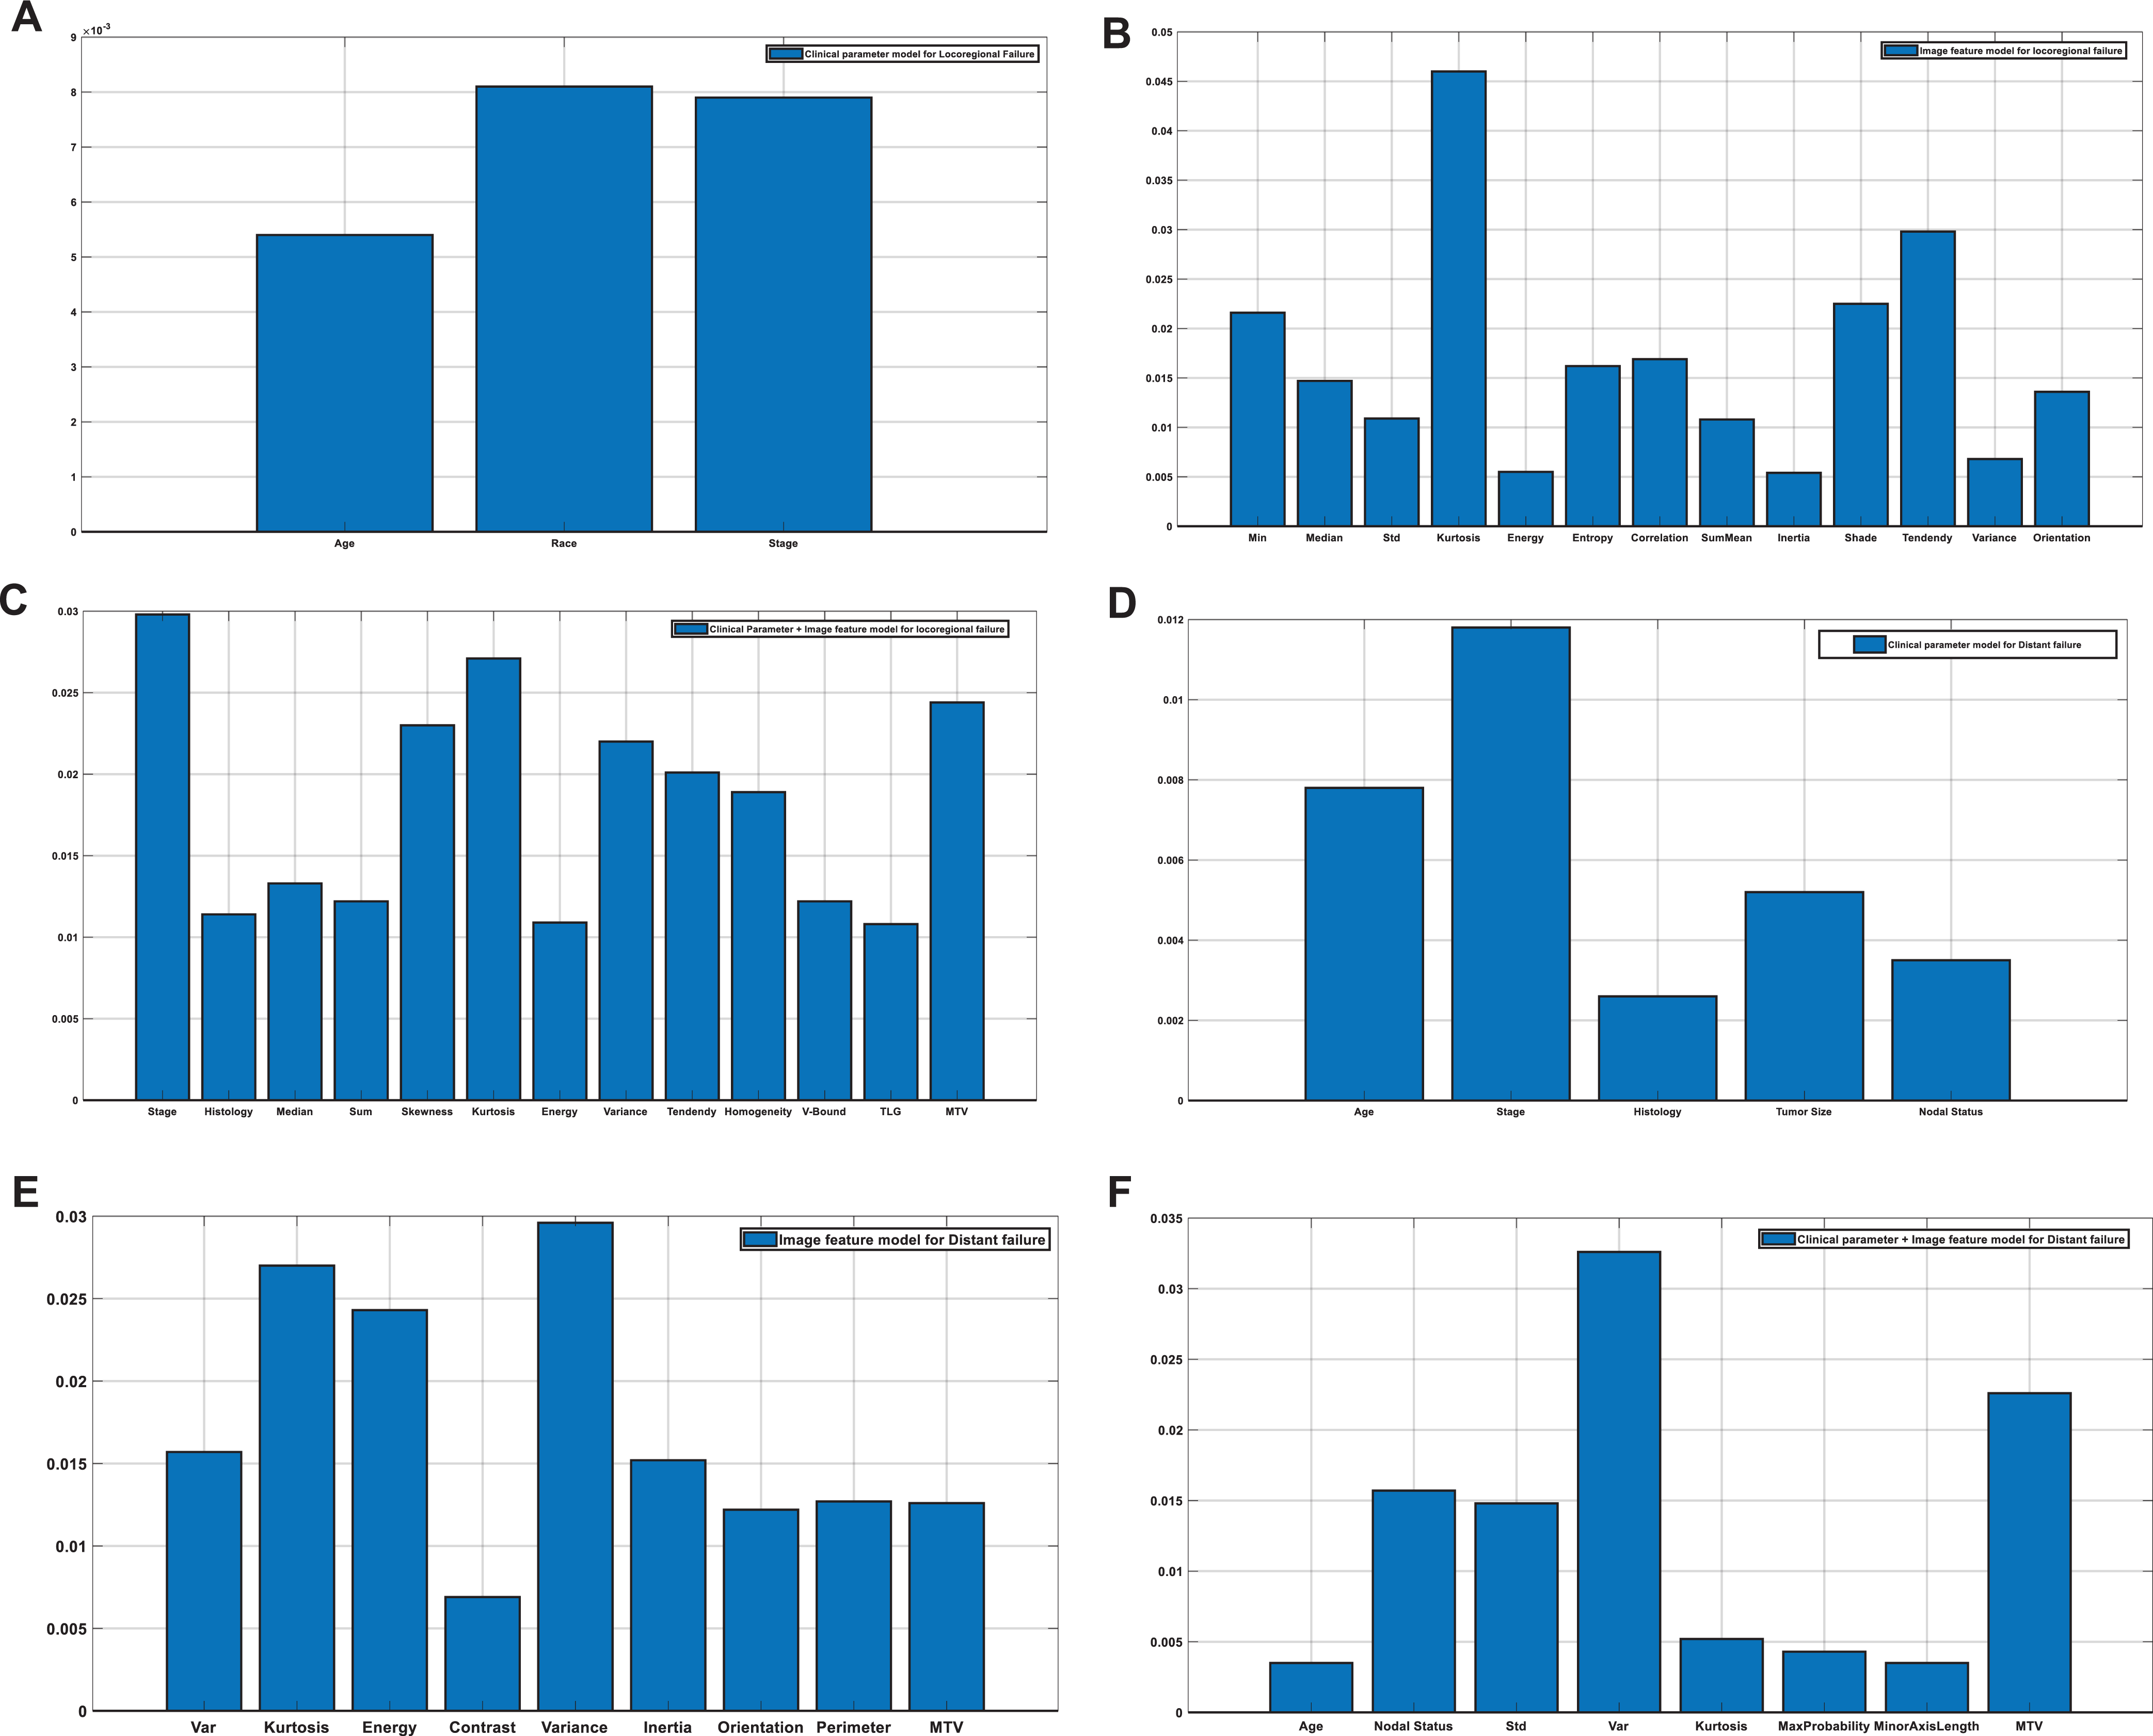
The magnitude of AUC changes for selected features in 6 models.
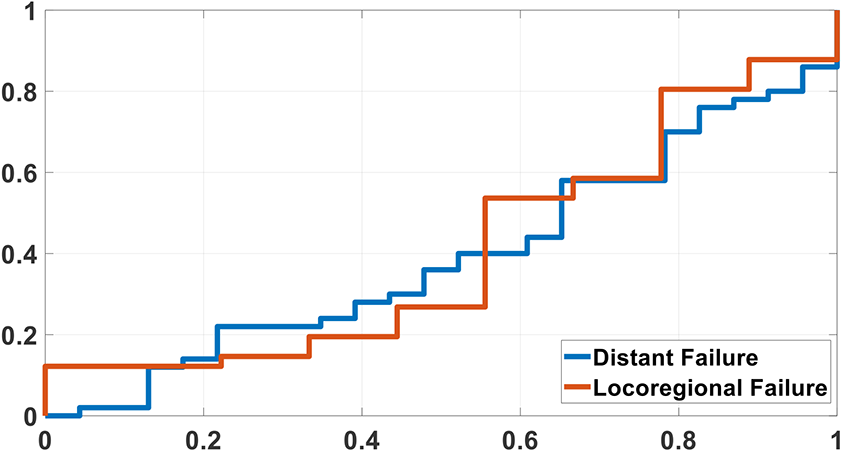
Receiver-operating characteristic (ROC) curves for volume with distant failure and locoregional failure prediction.
The Parameters for SVM in all the Models.

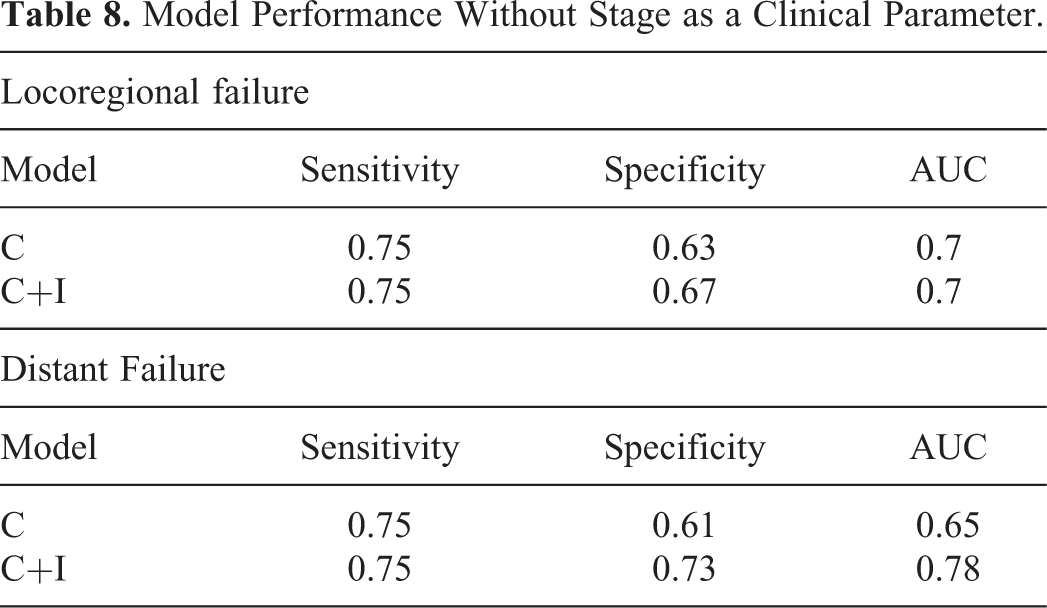
We found that the combined model still had the best performance regardless of whether stage was used or not (Table 8). Again, the highest performance (after excluding stage) was seen in the combined model. For LRF, the AUC was 0.7 (p < 0.01) and specificity was 0.67 at a fixed sensitivity of 0.75, and for DF, the AUC was 0.78 (p < 0.01) and specificity was 0.73 at a fixed sensitivity of 0.75. Bivariate analysis showed that a high probability of distant failure as determined by the combined model (probability > 0.7) correlated significantly with death (p < 0.01).
Model Performance Without Stage as a Clinical Parameter.
A log-rank test was performed to compare survival of patients who were predicted to have a low probability of distant metastases (probability < 0.5) compared to the survival of patients predicted to have a high probability of distant metastases (probability ≥ 0.5) by the combined model. Patients with a low probability of distant metastases had a mean survival time (median not reached) of 57.8 months (95% CI: 50.5-65.1) while patients with a high probability of distant metastases had a median survival time of 19.0 months (95% CI: 12.6-25.4, p < 0.01) (Figure 4). Figure 5 shows the incidence of distant metastases for patients predicted to have low probability of distant failure (probability < 0.5) to that of patients predicted to have high probability of distant failure (probability ≥ 0.5) by the combined model.
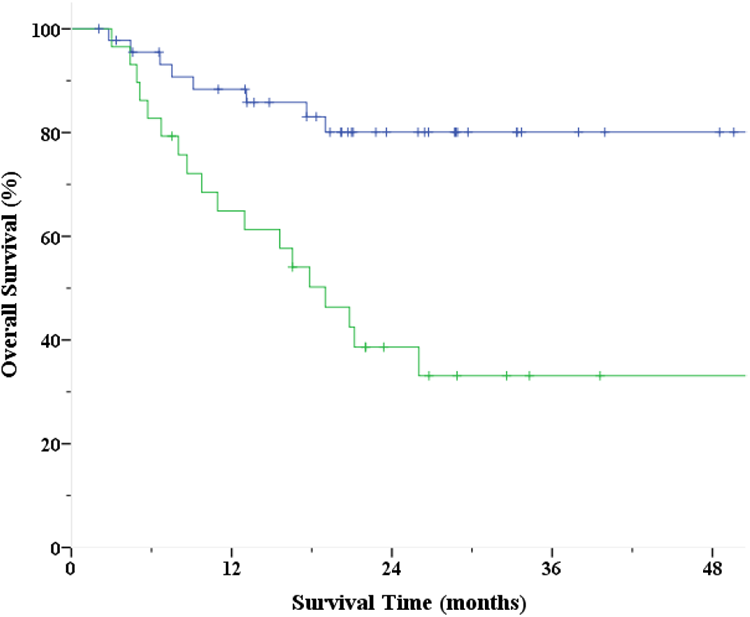
Survival of patients predicted to have low probability of distant failure (probability < 0.5, blue) compared to survival of patients predicted to have high probability of distant failure (probability ≥ 0.5, green) by C+I (model using clinical parameters and imaging features).

Incidence of distant metastases for patients predicted to have low probability of distant failure (probability < 0.5, blue) compared to patients predicted to have high probability of distant failure (probability ≥ 0.5, green) by C+I (model using clinical parameters and imaging features).
Discussion and Conclusion
Radiotherapy with concurrent chemotherapy is a standard of care for patients with stage IB2-IVA cervical cancer. 27 A meta-analysis showed chemoradiation was associated with a 5-year DFS improvement of 8% over patients receiving radiation alone. 28 However, relapses are common in the setting of standard therapy (with studies showing 5-year distant failure rates of 23% 29 and 27% 30 ), indicating the need for additional intensified therapy to achieve optimal outcome. Adjuvant chemotherapy has additional survival benefits, with a meta-analysis showing its association with a 54% reduction in the risk of death and an absolute benefit of 19% at 5 years (60%-79%) when used after a course of definitive chemoradiation 28 This treatment is associated with increased toxicity, 31 and randomized studies have been initiated to address its benefit. The OUTBACK trial is a phase III protocol including unselected patients with stage IB2- IVA cervical cancer who will receive definitive concurrent chemoradiation and then be randomized to receive additional chemotherapy with 4 cycles of adjuvant carboplatin and paclitaxel versus no further therapy. 32 Unfortunately, due to diverse eligibility criteria, inclusion of patients at low risk for DF may result in an inability to show a benefit for OUTBACK chemotherapy, and unselected administration of chemotherapy may result in excess toxicity for minimal benefit.
With the goal of identifying a subset of patients for which benefits of intensified therapy might outweigh its additional risks, prior studies have attempted to evaluate the use of various clinical and imaging parameters individually in prognosis and in predictive models. Studies examining the prognostic ability of individual parameters include one which found tumor spatial heterogeneity could predict patient outcomes for sarcoma (p < 0.001). 33 Among various FDG PET-CT features, intensity-volume-histogram variables had the highest association for locoregional recurrence after radiotherapy in non-small cell lung carcinoma. 34 A study using predictive models created support vector machine and logistic regression models that used a combination of clinical and FDG PET-CT parameters to predict pathologic tumor response to chemoradiation in esophageal carcinoma. 35 The support vector machine model achieved very high accuracy (AUC 1.00) when spatial-temporal PET features were combined with conventional PET-CT measures and clinical parameters. Most of the PET prognostic studies for cervix cancer are qualitative correlative studies 36 -38 or have focused on single quantitative measures like textural analysis. 39 Using a cohort of 14 cervical cancer patients treated at a single institution, El Naqa et al found that a combination of intensity-volume histogram (IVH) metrics and texture features extracted from PET images had high predictive power for response to treatment. 11 The models in our study were constructed using a larger dataset consisting of 75 patients for model training and testing. Additionally, we used both clinical and a more expansive set of imaging parameters to build our model with the highest predictive power, which had an AUC of 0.84 for locoregional failure prediction. Nevertheless, for distant failure prediction, the model achieved lower AUC of 0.75. The performance difference between distant and locoregional failure prediction could be caused by the regions used to extract features. In this work, all radiomic features were extracted from segmented primary lesion. For distant metastasis, regions surrounding the tumor or “Shell” 40 may provide more prognostic information on tumor metastasis potential, which was not considered in this work. Incooperating features extracted from the shell may improve the model performance for distant failure prediction, which is worthy of investigation in a future study.
The strengths of this study include a relatively large sample of patients treated uniformly over a short period with sufficient risk factors to have local and systemic failures. In addition, the combined clinical and imaging predictive model approach helps maximize the prognostic capability. Limitations to our study are the absence of an external validation set and verification at another institution. The utilization of magnetic resonance imaging-based features, which we did not address in this study, may also add to the predictive capability. Our analysis was performed using some patients with short follow-up, which could be seen as another limitation; however, only 3 patients had <6 months of follow up and would not be expected to have a significant impact on the results. Additionally, we are focused on early failures, since these patients would theoretically benefit most from an early intervention that could be predicted by pre-treatment imaging. Therefore, we feel a longer follow-up may not be as critical to address this clinical question.
When provided a high sensitivity and then optimized to maximize specificity, we found that the most complex model using clinical parameters and imaging parameters had the best results, compared to the other 2 models and to all the individual clinical and imaging parameters, for locoregional failure and distant failure. The combined model could be used to select patients at high risk for distant or locoregional failure who would potentially benefit from additional adjuvant therapy as administered in the OUTBACK protocol.
Footnotes
Declaration of Conflicting Interests
The author(s) declared no potential conflicts of interest with respect to the research, authorship, and/or publication of this article.
Funding
The author(s) disclosed receipt of the following financial support for the research, authorship, and/or publication of this article: We acknowledge funding support from US National Institutes of Health (R01 EB027898).