
Abstract
Electroporation is the process by which applied electric fields generate nanoscale defects in biological membranes to more efficiently deliver drugs and other small molecules into the cells. Due to the complexity of the process, computational models of cellular electroporation are difficult to validate against quantitative molecular uptake data. In part I of this two-part report, we describe a novel method for quantitatively determining cell membrane permeability and molecular membrane transport using fluorescence microscopy. Here, in part II, we use the data from part I to develop a two-stage ordinary differential equation model of cellular electroporation. We fit our model using experimental data from cells immersed in three buffer solutions and exposed to electric field strengths of 170 to 400 kV/m and pulse durations of 1 to 1000 μs. We report that a low-conductivity 4-(2-hydroxyethyl)-1 piperazineethanesulfonic acid buffer enables molecular transport into the cell to increase more rapidly than with phosphate-buffered saline or culture medium-based buffer. For multipulse schemes, our model suggests that the interpulse delay between two opposite polarity electric field pulses does not play an appreciable role in the resultant molecular uptake for delays up to 100 μs. Our model also predicts the per-pulse permeability enhancement decreases as a function of the pulse number. This is the first report of an ordinary differential equation model of electroporation to be validated with quantitative molecular uptake data and consider both membrane permeability and charging.
Introduction
An intact cell membrane normally provides a barrier to most molecular transport into and out of a cell. Electroporation (EP) is a biophysical process in which brief, yet intense, electrical pulses disrupt bilayer membranes to enhance the flow of molecules. The electrically motivated buildup of charged molecules at the water–lipid interface raises the electric potential difference between the inside of the membrane and the outside, known as the transmembrane potential (TMP). 1 –4 When the TMP reaches threshold values of 0.2 to 1.0 V, EP spontaneously occurs, as polar molecules are inserted through the membrane. 5 Simulations of molecular systems including phospholipids, water, and other small-molecule solutes have shown that nanoscale defects formation occurs on the order of picoseconds to nanoseconds. 6,7
When applied to cell membranes, EP-mediated defects render the cell membrane porous and enable solutes to better flow into and out of the cell. In the minutes to hours following EP, a porous membrane can reseal to again inhibit molecular transport. 8,9 The generation of these defects is typically modeled using the asymptotic Smoluchowski model (ASM), which considers the nucleation of trapezoidal defect structures approximately 0.8 nm in radius. 10 The ASM enables the calculation of the dynamic density of these defects on a membrane and includes considerations for the surface tension, tension of the defect, electrical energy, and steric hindrance of the membrane, as lipid molecules are reoriented. 11 The ASM has been widely implemented in spatiotemporal EP models, 12 –16 although direct comparisons to quantitative experimental data are yet to be made. This model also relies on the exponential of the squared TMP and therefore requires small time steps to resolve in numerical simulations. Simulations of even an idealized cell with sufficient resolution to capture the spatiotemporal dynamics of EP are computationally expensive. These resource requirements functionally limit the validation of such simulations against experimental data over the longer time scales (minutes to hours) relevant to the applications of EP-based technologies, including electrochemotherapy or irreversible EP.
The translation of the presence of conductive membrane defects to an effective permeability has been used to couple the generation of membrane defects with the electric flux continuity 17 and drift–diffusion equations. 18 Measurements of the electric current through the cell membrane decreases from 30 to 260 - 0 pA over 10 to 500 milliseconds following in vitro EP treatment. 19,20 Experimental data have also shown the rate at which exclusion dyes enter a cell after EP decreases over 190 to 289 seconds 21 from initial permeabilities of 8.57 × 10⁻¹² m/s for a 20-microsecond pulse at 300 kV/m. 9 In part I of this 2-part report, we describe a novel method for measuring molecular transport across the cell membrane and quantitatively characterizing membrane permeability following EP. These permeability measurements are more readily compared to computational models through the abstraction of aggregate membrane defects to a net membrane porosity. 22 –25
Here, in part II of our report, we detail the development of such a model and fit it to the experimental data generated in part I from adherent cells in a microfluidic chamber. Previous models of membrane defect formation have included three to four stages in which an electroporated membrane can exist. 16,21,26 In these schemes, an intact membrane is modeled as having a minimal permeability. When the TMP reaches the EP threshold, the membrane becomes sufficiently permeable to conduct small ionic currents. At this stage, the membrane still inhibits the transport of larger molecules, such as exclusion dyes. As its porosity increases, especially during EP schemes comprised of longer pulses (0.1-1.0 milliseconds), larger polyions and other small-molecule solutes are able to cross the cell membrane. 9,21 The net porosity of the cell membrane is modeled as a linear combination of these porosity stages weighted by the fraction of the membrane in each stage, with an ordinary differential equation system representing the flow of the membrane through each available stage.
Once porous, membranes shunt ionic currents along the charge gradient, decreasing the TMP. 11,12,27 This charging to the EP threshold, followed by the rapid formation of membrane defects, results in a characteristic sharp peak in the evolution of the TMP over time. 19 Lumped parameter resistive–capacitive circuit models have been used to model the ionic currents through each defect stage. 11,28 –31 The parallel flow of ionic currents, modeled as parallel conductances, through the fraction of the membrane in each porosity stage is driven by an applied electric field, modeled as a source voltage in series with a Thevenin equivalent conductance that models the conductance of the buffer surrounding the cell. Lumped parameter models are particularly interesting, as they provide a means of connecting quantitative cell-level data with tissue-level phenomena. 32 While these models have the potential to simplify comparisons with experimental data, no computational model of EP to date has been fit to quantitative experimental data.
The goal of part II of our work was to investigate EP-facilitated membrane permeability within a theoretical framework and avoid the computational expense of spatial models. To this end, we have developed a lumped parameter model that includes a cell membrane circuit model coupled with a novel phenomenological dual-porosity model and simple diffusion. Our model treats the cell using parameters that are representative of the whole cell rather than varying spatially. 30,32 We fit our model using experimental data reported in part I of this report, including pulse durations of 1 to 1000 microseconds, electric field strengths of 170 to 400 kV/m, and 3 buffer compositions: phosphate-buffered saline (PBS), serum-free Dulbecco Modified Eagle Medium/F-12 cell culture medium (SFDF), and a low-conductivity 4-(2-hydroxyethyl)-1-piperazineethanesulfonic acid buffer (HEPES). Analysis of this model indicates that it is asymptotically stable following the removal of the applied electric field (ie, during defect resealing). Model parameters and variables were normalized, which reduced the parameter space to 6 parameters. Of these, 5 parameters were fixed based on existing literature, and the sixth, the forward transition rate between the low-porosity stage and the high-porosity stage, was fit to quantitative experimental data. Our results indicate that buffer composition plays a critical role in EP-mediated membrane porosity.
We extend our model to examine its implications for multipulse EP schemes. These results indicate that the relaxation of the high- to low-porosity stage is slow and results in a relatively long-lived membrane fraction in the high-porosity stage, compared to the fraction in the low-porosity stage. We show that the difference in relaxation time scales gives rise to a membrane permeability increase proportional to the pulse number raised to the power of 0.7. Finally, we demonstrate that the difference in relaxation times between the high- and low-conductivity stages, which explains the negligible impact of delays of less than 100 milliseconds between consecutive pulses. The small parameter space and conclusions of our model are consistent with existing literature and serve as a robust link between experimental observations and theoretical models. While the scope of the present work focuses on the biophysical mechanisms governing EP, we acknowledge that it has direct applications to optimizing clinical techniques using EP processes that rely on membrane transport, including electrochemotherapy. Robust linkages between theoretical and experimental results are critical to improving clinical EP technology. Our model provides a simple, concise methodology exploring these connections in greater depth.
Materials and Methods
We develop the following system of equations to describe EP and subsequent molecular transport into a single idealized, spherical cell immersed in an aqueous buffer (Figure 1). Our model comprises equations that describe EP as a reversible primary process coupled with an irreversible secondary process.
33
In the reversible primary process, a source current proportional to the applied electric field drives an increase in the TMP (U). As the TMP increases, the formation of reversible membrane defects begins to occur and more readily allow ions to flow across the membrane. These ionic currents slow the TMP increase until either a dynamic equilibrium between the formation and relaxation of conducting defects is reached or the source current is removed. When a defect is initially formed (N), it does not initially allow for the transport for molecules larger than small ions. However, these initial defects can be expanded radially to accommodate the transport of larger ions, such as propidium, in a secondary defect stage (M). In the irreversible process, the transport of a small-molecule solute (X), such as propidium, is considered from a high extracellular concentration into a cell initially containing no solute. EP model diagram. A, Electrical schematic representation of the cell membrane charging including the extracellular conductivity 
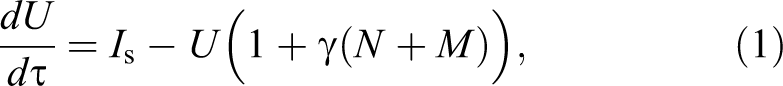


where
To maintain the utility of the present modeling scheme model for describing experimental results, the parameters
Equation 2 describes the fractional porosity of the cell membrane generated by normalized TMP U at rate α and is quadratic in U, consistent with the dominant term in a first-order Taylor expansion of the ASM. The second term describes the transition from the N porosity stage to the M porosity stage that occurs at rate δ and is motivated by the presence of the TMP U. The third term in Equation 2 describes the transition from the N stage back to a naive membrane stage with rate constant β. The fourth term describes the M to N transition that occurs at rate η. Within this scheme, the membrane fraction in the M stage cannot exist without passing through the N stage during generation and relaxation. Additionally, this scheme does not specifically address whether the mechanism by which N-stage defects transition to M-stage defects is through coalescence of the existing N-stage defects 34 or the radial expansion of M-stage pores 35 but instead considers the total contribution of each defect population to the membrane conductance and permeability.
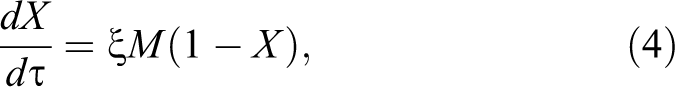
With the duration of the applied electric field 1000-fold shorter than the interval between the control measurement and the first posttreatment measurement in the experimental data, we assume that the molecular flux into the cell interior is purely diffusive.
36,37
A Hagen–Poiseuille model of mass transport through a porous membrane was used to develop Equation 4, where ξ is the normalized permeability coefficient of the M porosity stage. Flow through a porous membrane is given according to Equation 4, where
Results
Parameter Fitting
Equations 1
to 4 were implemented in Python 3.6.5 using the Livermore Solver for Ordinary Differential Equations (LSODA) algorithm
41
with the odeint() function in the Scipy (1.0.1) module.
42
The solver was initialized with the initial conditions:

where X model(ti ) and X data(ti ) are the model and data points for X, respectively, at time ti ∈ . Simulations were plotted over the experimental data and show good agreement visually, with the maximum max(SSRPBS) = 0.025, max(SSRSFDF) = 0.0070, and max(SSRHEPES) = 0.0066 Figure 2. Notably, the to generation rates δ were similar for cells immersed in PBS and SFDF but were consistently 3- to 5-fold larger for cells immersed in HEPES buffer.
HEPES Buffer Increases Membrane Permeability
Experimental data (part I) from 3 different buffer compositions reveal that cells immersed in the HEPES buffer during EP experienced a larger molecular uptake following the application of the 100-microsecond pulse than the cells immersed in PBS or SFDF. With a 1000-microsecond pulse, the ultimate molecular uptake was similar for each of the electric field strengths experimentally examined, but the time-to-saturation decreased with increasing field strength. Although the HEPES buffer has a lower conductivity than the PBS or SFDF by an order of magnitude, δ for the cells in the HEPES buffer is 2 orders of magnitude larger than for the cells in PBS and SFDF buffers, which are themselves similar (Table 1). This is counterintuitive to previous data from studies, where the ionic strength of the buffer was manipulated for otherwise similar buffers. 31 In our model, this observation is driven by a more rapid transition rate from the N membrane stage to the M membrane stage that results in a larger accumulation M that contributes to a rapid increase in X over the responses evoked by the other buffers (Figure 2). Our data show that although the HEPES buffer slows the rise in U (Figure 3), X increases similar to the cells in PBS and SFDF. This observation suggests that electroporating cells in a HEPES buffer may result in increased permeability over similar cells treated in PBS and SFDF, despite the lower induced TMP (U).
Model Parameters.
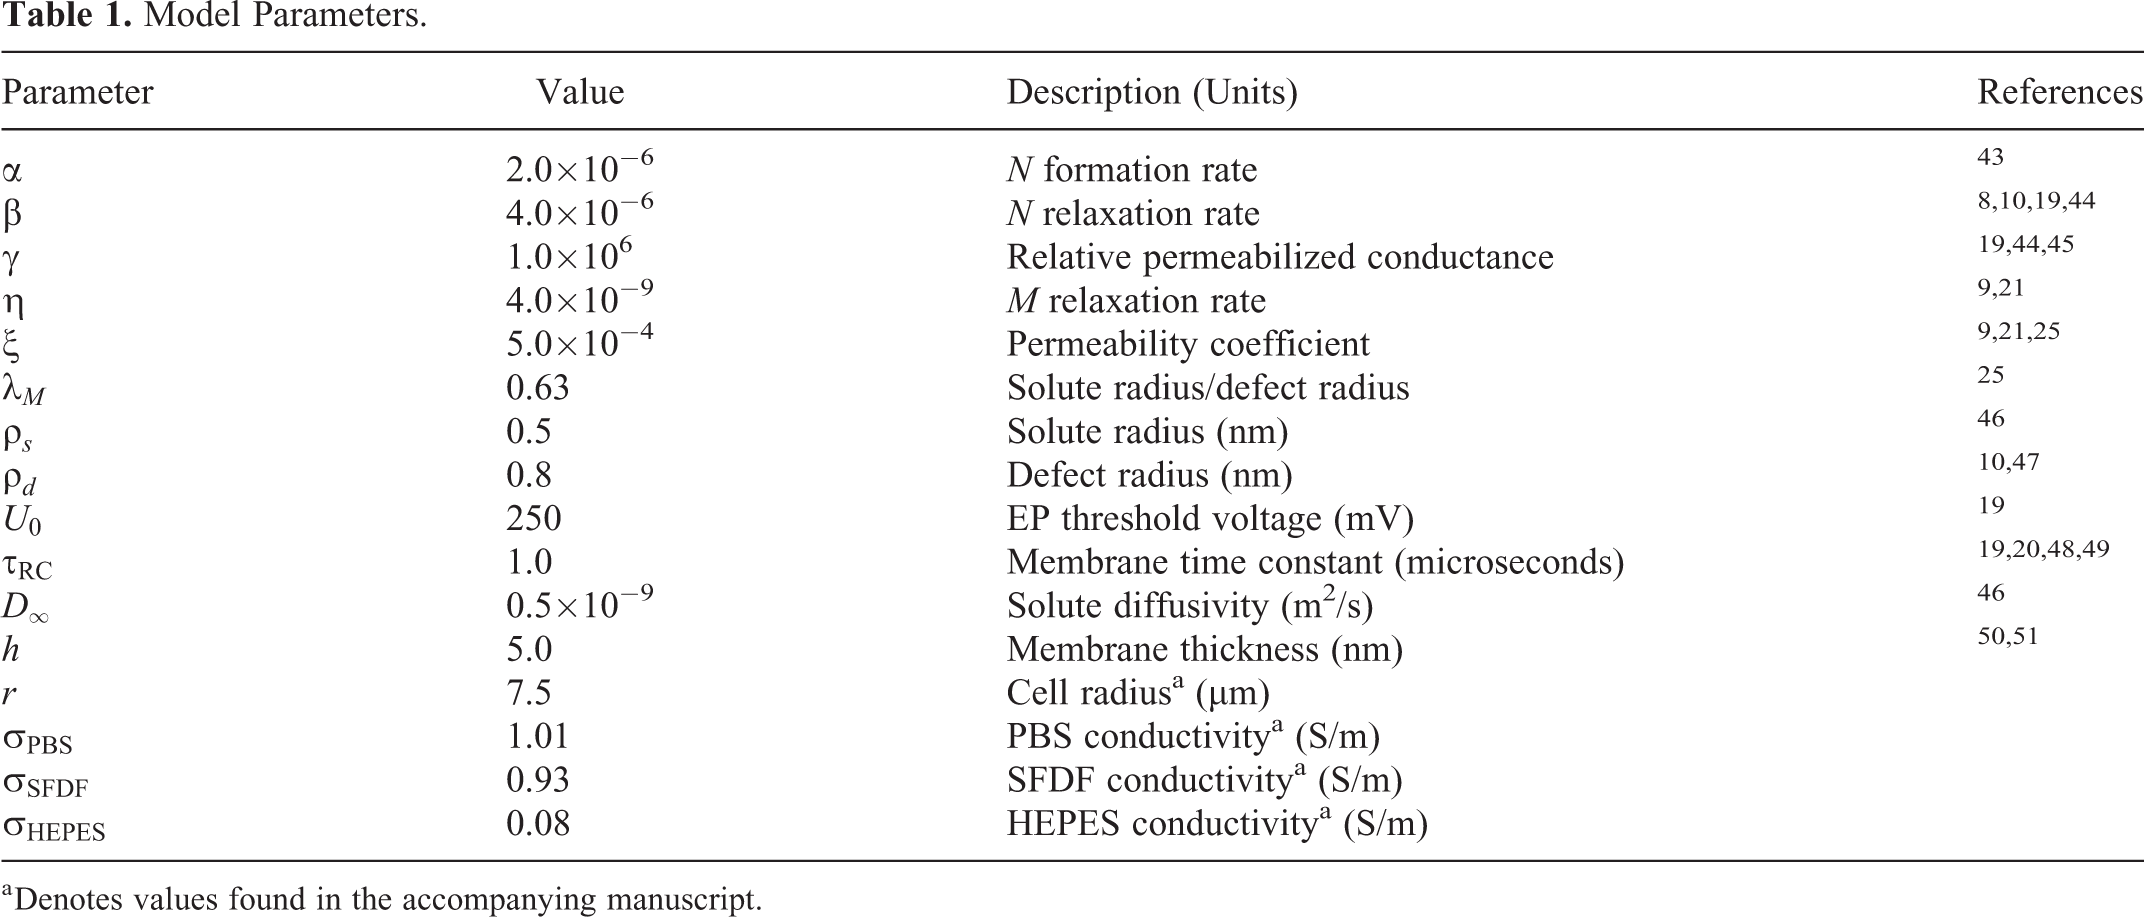
a Denotes values found in the accompanying manuscript.

The 2-stage model recapitulates experimental averages of molecular uptake. Representative parameter fits are shown for X for cells exposed to a pulse at 320 kV/m to pulse widths of 1, 10, 100, and 1000 microseconds in (A) phosphate buffered saline (PBS), (B) serum-free DMEM/F12 medium (SFDF), and (C) 4-(2-hydroxyethyl)-1-piperazineethanesulfonic acid buffer (HEPES). Equations 1
to 4 were fit to time series datasets from cells in 3 buffer compositions (PBS, SFDF, and HEPES), 4 pulse durations (1, 10, 100, and 1000 microseconds), and 4 electric field strengths (170, 250, 320, and 400 kV/m). Fitting was performed using the Nelder–Mead method to minimize Equation 6 by varying δ. (d) The best fit δ is shown as a product of the source term
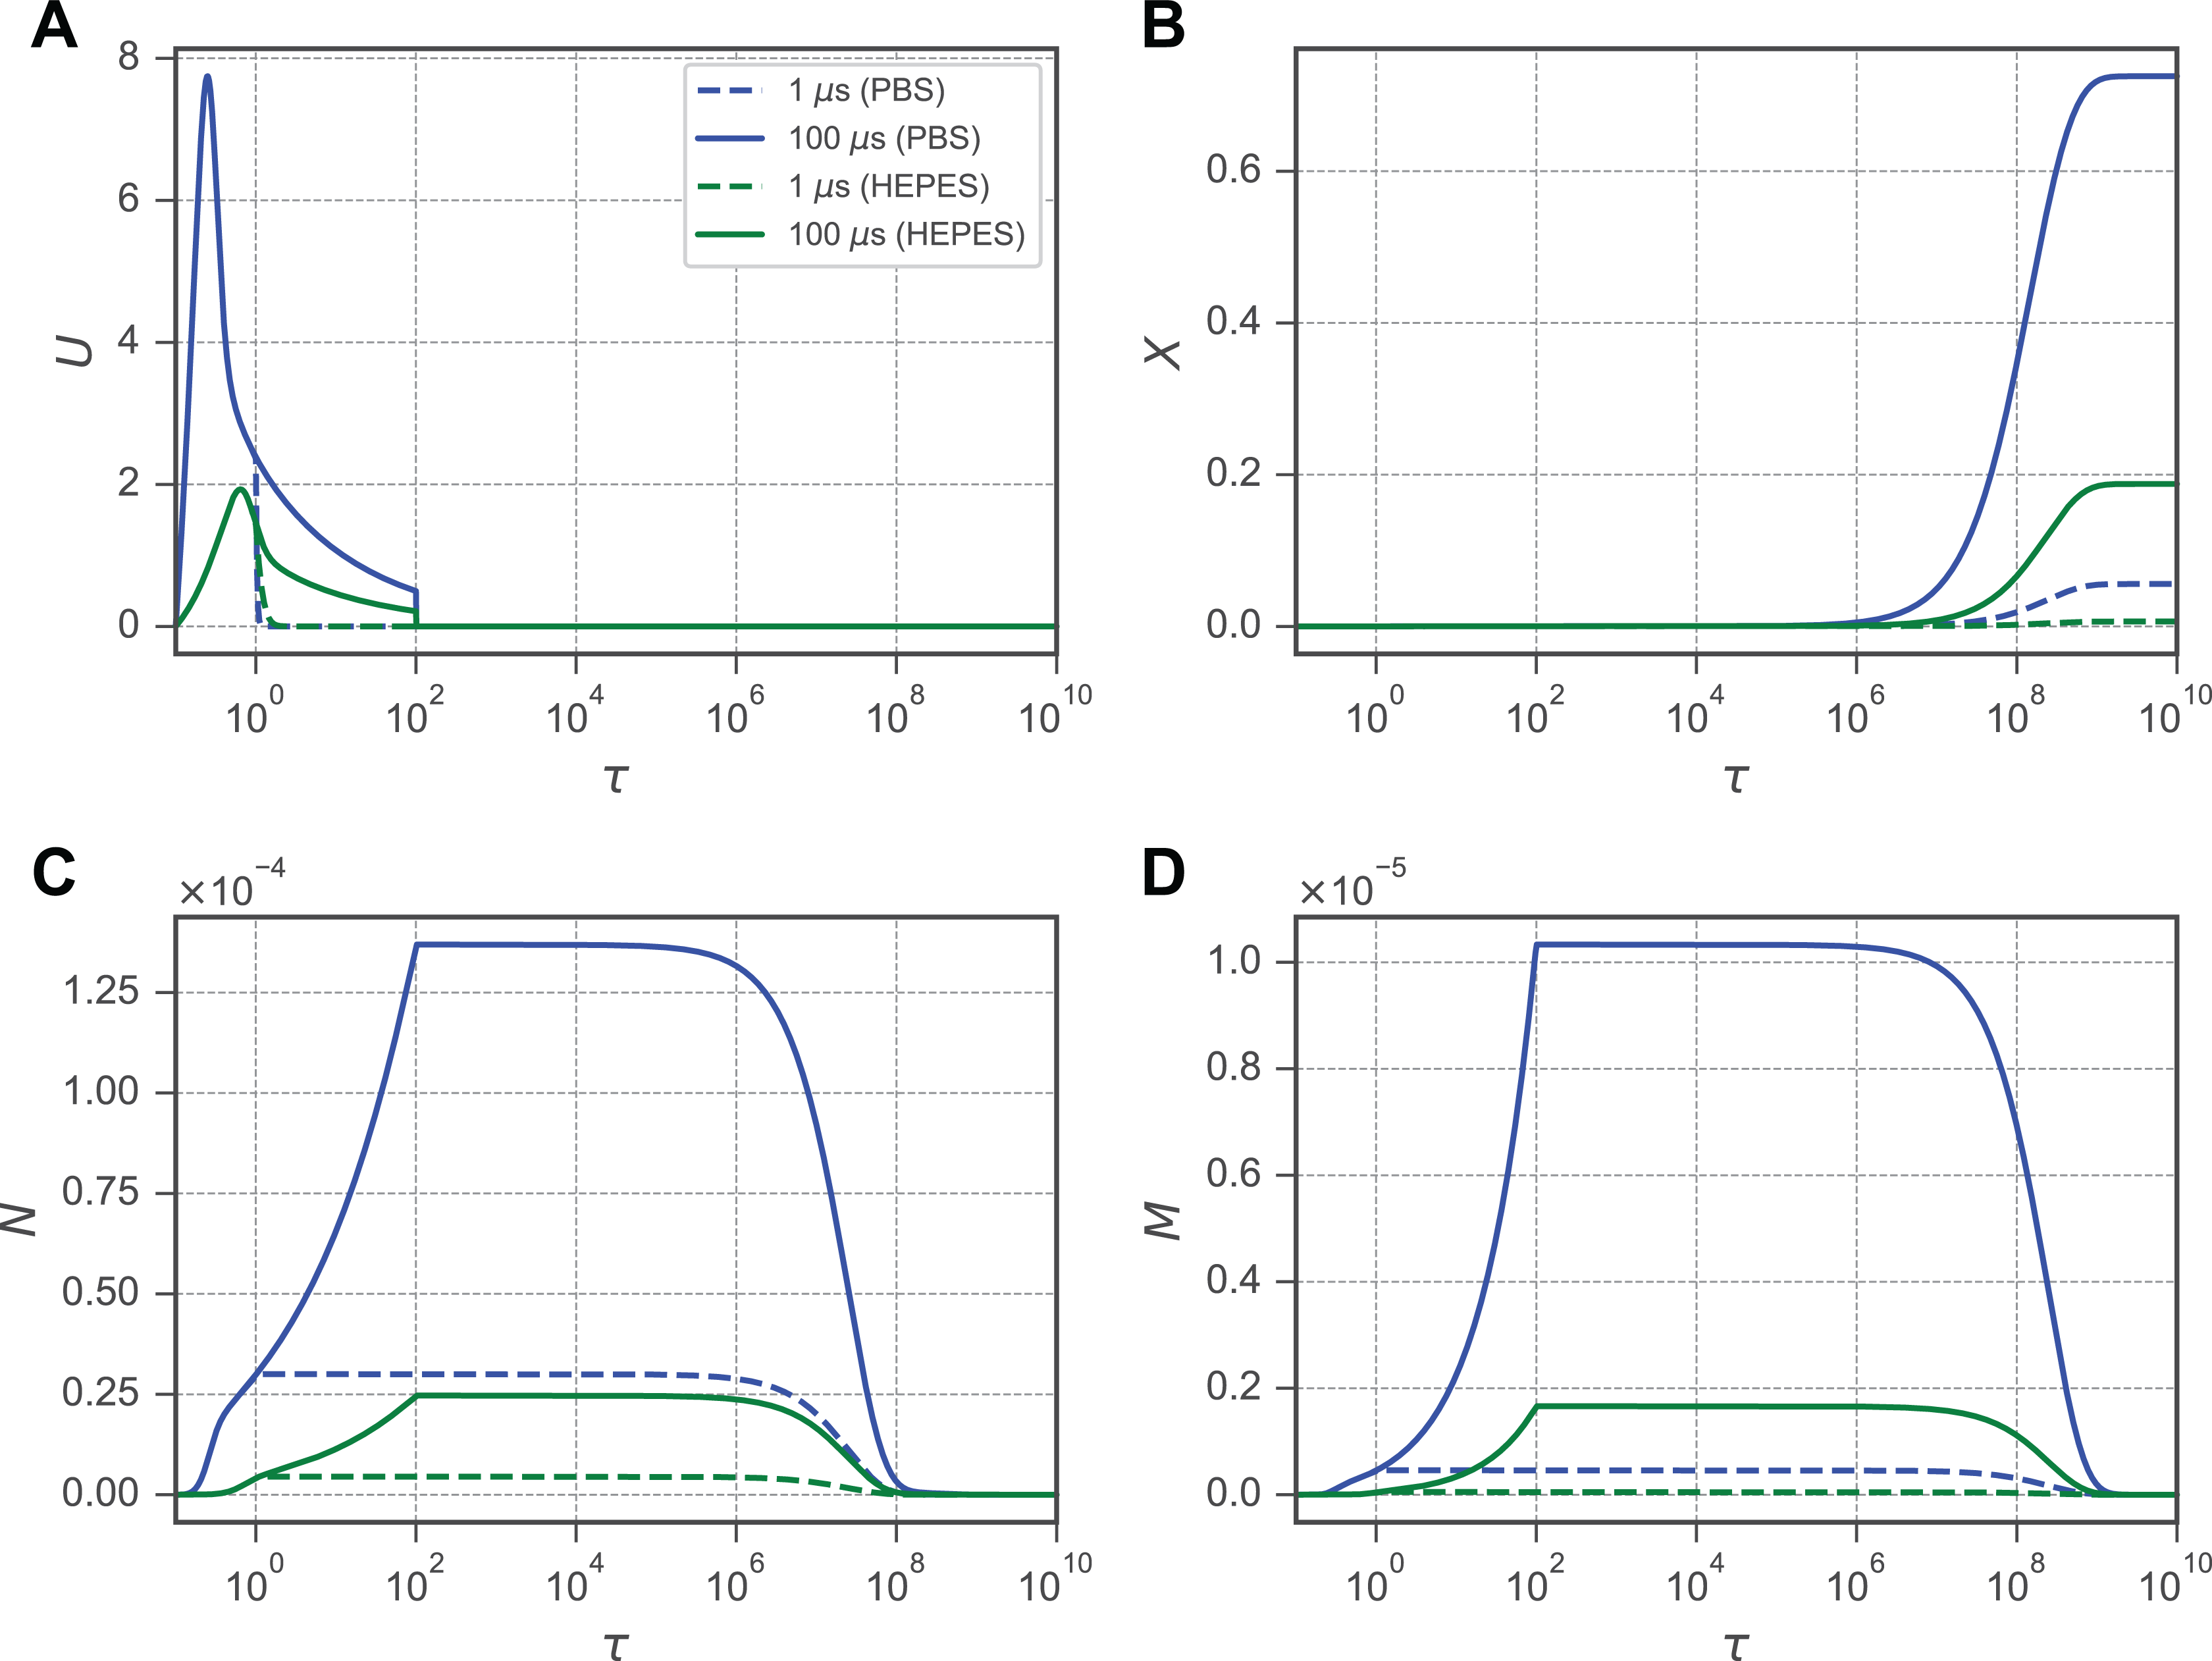
Evolution of membrane porosities N and M and the resultant molecular uptake X following an increase in the normalized transmembrane potential U. In each plot, solid lines indicate an applied electric field
Generally, in each of the primary variables (N, M, X, and U), several characteristic features emerge. Immediately following application of the electric field, the TMP U experiences a characteristic spike within to (Figure 3A). This spike is followed by a sharp decline as N and M increase and begin conducting ionic currents through the cell membrane. For N, the initiation of the waveform appears biphasic: An initial rapid increase is followed by a more gradual increase until a plateau is reached (Figure 3C). The first phase is where U is the largest. The second phase occurs when the membrane begins to shunt small ionic currents that rapidly decrease U and slows the increase in N. This progression occurs for cells in each buffer examined in this study, but the cells in HEPES experience a larger for both the 1- and 10-microsecond pulses than the cells in PBS experienced at 10 microseconds. For (Figure 3D), a similar biphasic response exists but is more stratified between the 1- and 10-microsecond pulse durations for the cells in the HEPES buffer. Interestingly, the 1-microsecond pulse generated an M for cells in the HEPES buffer similar to that generated by the 10-microsecond pulse for the cells in PBS. The result of this stratification is apparent in (Figure 3B). The membrane permeability (Pm = ξMh) is directly impacted by the M membrane stage, and consequently, depends on both the extracellular–intracellular concentration gradient (1 − X) and M. However, while the concentration gradient could limit the molecular uptake as it decreases, (1 − X) > 0.30 for even the largest pulse strengths and durations examined here. Therefore, it is assumed that the changes in M are largely responsible for the molecular uptake observed.
The High-Conductivity Membrane Fraction Is Slow to Relax
Prior experimental data have shown that U is highly dynamic during the application of an electric field but quickly returns to its ground state following the removal of Is (Figure 3A). However, it is clear that molecular transport across the membrane continues for minutes to hours afterward (Figure 2A–C). This discrepancy between the electrical and transport time scales is motivation to explore the mechanism producing a long-lived M stage membrane fraction (Figure 4A). As a large U generates an initial increase in N, a small M begins to develop (Figure 4B). M increases until the removal of Is , at which point the plateau of M coincides with the return of U to its ground state. Both M and N persist near their plateau for approximately 106τ, at which point N begins to relax to the ground state it reaches at 108τ. However, while the N stage decays, the M stage persists until 109. Because the membrane fraction in the M stage is approximately 2 orders of magnitude smaller than in the N stage, the transition of an M-stage porosity to an N-stage porosity results in a large decrease in the low conductivity, yet larger, portion of the membrane while the membrane overall continues to be permeable to solutes. This slow relaxation in the M stage is responsible for the difference in time scales between the rapid electrical charging and the relatively slow uptake of solutes in the minutes following EP.

The transmembrane potential and molecular uptake occur on dramatically different timescales. A, Pulses with durations of 10 and 100 microseconds are shown simulated using
Consecutive Pulses Diminish Permeabilization Efficiency
While multipulse experiments can confound observations of membrane dynamics due to the complex cellular response, EP schemes often rely on a series of pulses, rather than a single continuous pulse, to limit Joule heating. 52,53 δ = 1.0 × 10⁻³ was fixed within the range for the PBS buffer, which is commonly used experimentally. Alternating polarity pulses are becoming increasingly relevant to EP technology. 54 –56 To investigate the implications of our model within such schemes, bipolar pulse trains were simulated as ideal square waveforms from 1 to 1000 microseconds (Figure 5). The interpulse delay td between the start of the falling edge of 1 pulse and the start of the initiation of the following pulse has been implicated in governing cell permeability and death induced by EP protocols. 57 –61 To determine the role of td in the induced permeability Pm , simulations were performed using two consecutive, alternating polarity pulses at 400 kV/m with a variable delay between them, shown, for example, by 10-microsecond pulses (Figure 5A). The induced permeability was evaluated at the beginning of the falling edge of the second pulse for td ∈ [10−6 s, 10−1 s], and it was found that td within this range does not appreciably affect membrane permeability for 1-, 10-, 100-, and 1000-microsecond pulses (Figure 5B). These results corroborate experiment reports of nanosecond pulses that show a relatively small difference between pulses delivered at intervals from 2 to 1000 milliseconds 62 and that the impedance change in cells is relatively small yet similar between consecutive pulses for interpulse delays less than 100 milliseconds. 59

Interpulse delays of less than 1 millisecond negligibly impact membrane permeability, while increasing pulse number n and duration (
The impact of the number of consecutive pulses n has been reported as an important factor in membrane conductance changes resulting from EP.
4,29,63
We refer to the measurement of the effect of the number of pulses on the cell’s permeability, as the permeabilization efficiency

where

where

Permeabilization efficiency decreases for each consecutive pulse delivered in a given series. A, Alternating polarity pulses increase the normalized transmembrane potential (U) and generate increasing membrane permeabilities

where na and nb are the numbers of alternating polarity pulses in treatment a and b, respectively, Pa and Pb are the permeabilities after the first pulse of each treatment using constant duration pulses (Figure 6B). This equation takes a similar form to previous models describing equivalent pulse parameters. 33,64 Although more quantitative measurements of membrane permeability are needed to validate this result, it could provide a guide to designing future in vitro EP protocols.
Discussion
In the proposed model, normalization of the governing equations results in only 6 parameters:
While the impact of HEPES buffers on EP appears to be negligible, there is evidence that the inclusion of sucrose affects cells as they are permeabilized. Sucrose is excluded from electroporated membranes 65 and has been shown to result in the formation of blebs. 71 Within the context of these results, the large δ our model predicts for the sucrose-containing HEPES buffer may assist in expanding or stabilizing membrane defects. The membrane fraction in the low-conductivity N stage could widen into the M stage to more rapidly shunt the flow of water along the osmotic pressure gradient and into the cell. In addition to the expansion and stabilization of defects, the osmotic pressure gradient could also deliver solutes, such as propidium, into the cell more rapidly. Both of these effects may explain the increased δ for cells in HEPES. More investigation is required to further characterize this mechanism, although explaining the specific effects of the HEPES buffer on cellular permeabilization is beyond the scope of the present work. This is an important consideration for future studies and would be valuable to the field of EP in general, but the focus of this work is developing a phenomenological model that can be directly fit using experimental data.
The flow of propidium and other small-molecule solutes into the cell through the cell membrane following EP is the result of both electrophoretic drift and diffusion along concentration gradients. However, the flow of propidium into an electroporated cell following the removal of the applied electric field is largely due to diffusion through defects in the cell membrane. 72,73 Here, the defect population is divided into 2 subpopulations, N and M, which are treated in aggregate based upon whether the defects permit propidium transport. Previous reports have suggested subdividing the induced membrane porosity into diffusive and electrically conductive portions, 16,23,74,75 but these models have typically relied on the incorporation of interface conditions in continuum models. In our model, the dimensionality of the problem is collapsed to yield average porosities for the whole membrane, rather than addressing the generation, relaxation, and interconversion of individual defects (Figure 1). Furthermore, removing this spatial dependence allows our model to be solved using standard ordinary differential equation solvers, enabling the simplified spatial system to be readily incorporated as a material property into larger systems. 32 In the present model, this reduced dimensionality was achieved through the use of dynamic porosities N and M 16,23,75,76 rather than more conventional defect numbers. 77 –80 The transport through the M stage then facilitates hindered diffusion of propidium into the cell and is represented as an average over the whole cell, rather than at each individual defect, giving rise to a dual-porosity model of the cell membrane. 25
While our 2-stage model is fit using single-pulse propidium uptake data, further data sets should be considered in future work, although our model is qualitatively consistent with previous reports. The electrical waveforms used to generate our experimental data set comprised a single pulse with significant ringing on the initiation and termination of each pulse. Due to the ringing, the cells in the microdevice were exposed to a much larger electric field strength during the first 100 nanoseconds than during the remainder of the pulse. Furthermore, in many experimental investigations, a voltage overshoot may exist on the rising edge of each pulse, depending on the generator topology and experimental apparatus, 55 which differs from the idealized square pulses simulated in the present model. Experimental investigations of pulse modulation have found that a square pulse with 10% sinusoidal modulation varied only slightly from an idealized square pulse, 81 although a 90%-modulated pulse increased the permeabilized cell fraction. By analogy, we expect that for the 10-, 100-, and 1000-microsecond pulses, our experimental data would closely approximate a square pulse. Experimental data from the 1-microsecond pulses could overpredict the EP threshold, as the ringing in the applied pulse is of the order of the pulse duration. Ultimately, little permeabilization occurred for pulses <10 microseconds, and our model is able to phenomenologically reflect this observation.
Our 2-stage model can also be easily extended from a single pulse to a series of alternating polarity pulses (Figure 6). Due to the slow relaxation rate (η) of the M stage (Figure 4), 2 consecutive pulses separated by
At the removal of each consecutive pulse,
The repetition rate (
Our 2-stage lumped parameter model is presently limited in scope by the data with which it has been validated, namely, adherent cells cultured in vitro in a dispersed fashion using the methods described in part I. For cells cultured in a 3-dimensional environment, we expect the parameter values in our model would necessarily reflect changes in cell morphology and physiology. For example, if a solute with a larger molecular radius or charge was used, the parameters in our model would necessarily change to reflect the ability of each solute to travel through the membrane; the transport of differently sized molecules with different charges will inherently be different. Especially, with regard to the M to N porosity stages, we expect that the parameters describing these kinetics would vary greatly. 83 Our present model is only validated in vitro using propidium for cells that exist far from the electrodes, which is consistent with the experimental setup in the accompanying article. For cells near the electrode contacts, other mechanisms of cell membrane damage may dominate, and our model may not recapitulate experimental observations.
Conclusion
Here, we present the second part of a 2-part report on in vitro EP. In part I, we developed a method of quantitatively determining molecular uptake and measuring membrane permeability for cells in a microdevice using fluorescence microscopy. Here, in part II, we develop and fit a computational model of small-molecule transport into cells using only 6 parameters. We fit our model using experimental data of propidium uptake following EP gathered in part I. When extended to multiple bipolar pulses, our model corroborates previous experimental reports and suggests a relationship that defines the pulse number required to obtain equivalent molecular uptake between disparate EP schemes.
Footnotes
Appendix A
Appendix B
Declaration of Conflicting Interests
The author(s) declared the following potential conflicts of interest with respect to the research, authorship, and/or publication of this article: Daniel C. Sweeney and Rafael V. Davalos have patents pending related to cellular electroporation.
Funding
The author(s) disclosed receipt of the following financial support for the research, authorship, and/or publication of this article: Funding for this work was graciously provided by the NSF CAREER Award CBET-1055913, the NSF IGERT DGE-09661, and the NIH R01-CA213423.