
Abstract
This paper studies how spatial proximity to pre-election police killings affects voter turnout. I argue that incidents of police violence have neighborhood-level effects. Nearby voters are more likely to learn about proximal killings than those further away. If perceived as unjust, police killings teach political lessons that reduce voters’ trust in government and political efficacy. In turn, this impacts voter turnout. Observing the 2016 presidential election, I test this theory using geolocated voter data and a difference-in-differences design with matched groups. I find that pre-election police killings reduce voter turnout by 3 percentage points in the killings’ one-mile radius. Space and race matter. Police killings reduce Black voter turnout by 5.9 percentage points in the killings’ one-mile radius, but Black voters one to two miles away from the killings are unaffected. However, police killings do not affect White and Latino voter turnout regardless of the distance.
Many civil rights activists believed that the police killing of Michael Brown, an unarmed Black teenager, and the subsequent protests in Ferguson, Missouri, would propel a new civil rights movement targeted against a discriminatory and punitive criminal justice system (Martino-Taylor et al., 2016). In some ways, it did; the police killing of Michael Brown changed local politics in Ferguson, Missouri. Voter turnout increased in the subsequent local election, and the city council became more representative of the city’s demographics. After the killing of Michael Brown, police killings of unarmed Black and brown men continued to fuel local protests, and some local policy victories like police-worn body cameras were achieved (Williamson et al., 2018; Levitz, 2016). However, the political consequences of police violence remain poorly understood (Soss & Weaver, 2017).
This paper argues that living near a pre-election police killing reduces people’s likelihood of voting. Most police killings are hyperlocal events; they receive little media coverage, and local residents are more likely to know about and be psychologically impacted by nearby killings (Bor et al., 2018; Ang, 2020; Branton et al., 2021). Seemingly unjust and aggressive policing practices, like police violence, may mobilize or demobilize depending on the context (Weaver & Lerman, 2010; Walker, 2014; White, 2019A). However, research studying the neighborhood and contextual effects of policing generally suggest that aggressive and violent policing demobilizes entire communities (Burch, 2013; Kang & Dawes, 2017; Branton et al., 2021; for exceptional cases, see Laniyonu, 2019). Specifically, proximity to police violence is linked to lower trust in government and diminished external political efficacy (Silva et al., 2020; Branton et al., 2021). In turn, less trust in government and external efficacy represses turnout (Hooghe, 2017; Finkel, 1985). I further argue that police killings will be particularly demobilizing for Black voters because local police killings dampen Black Americans’ political efficacy more than other racial groups’ (Branton et al., 2021).
This paper leverages state voter files and comprehensive data from Mapping Police Violence to study how police killings affect voter participation rates. Of particular interest are the spatial relationship between police killings and voters and the contextual circumstances that may mediate voters’ reactions to the killings, such as voters’ race and ethnicity and the victim’s armed status. This paper tests whether voters living in places with a history of protests against police violence behave differently than those living in places without a history of protests against police violence. Police killings sometimes lead to local protests against police violence and these protests are linked to increased voter mobilization, potentially reversing police killings’ demobilizing effects (Williamson et al., 2018; Enos et al., 2019).
Synthesizing research designs employed by Burch (2013), White (2019A), and Ang (2020), this paper studies how pre-election police killings in California, Florida, and Ohio affected the participation rates of spatially proximal voters in the 2016 general election. It does so by comparing the participation rates of active registered voters living within a mile of a police killing occurring before the 2016 general election to the participation rates of active registered voters living within a mile of a police killing occurring after the 2016 general election using a difference-in-differences (DiD) design. This research design controls for time-invariant and national time-variant confounds, jointly leveraging the high causal inference of a quasi-experiment and a DiD, while providing individual-level data within spatially defined neighborhoods.
I find that voters living within a mile of a pre-election police killings were 3 percentage points less likely to vote than those in the control group. Police killings were particularly demobilizing when voters lived in closer proximity to a killing, but generally had no effect on voters living more than a mile away from the events. The effect of spatial distance between one’s home and a killing appears to be continuous and robust. Furthermore, the findings suggest that race matters. Police killings particularly demobilize Black voters, and police killings of Black victims are more demobilizing than police killings of White and Latino victims. Victims’ armed status does not appear to matter, and voters in cities with more Black Lives Matter protests prior to the killings were equally impacted.
This paper contributes to the literature on policing and contextual factors shaping voting behavior by studying the effects of proximal police violence on voter turnout, a plausible but untested source of variation in voter participation rates. While the effects found in this study are small on aggregate because police killings are relatively rare and the effects are localized, the findings help inform our understanding of the impact of police violence on voter behavior. Lethal police violence demobilized communities and increased racial inequities in the 2016 presidential election. While police killings are relatively rare, other forms of police violence are far more common. This research may help us think about the consequences of non-lethal violence. Furthermore, while this study focuses on spatial proximity as a source of exposure, other forms of exposure may produce similar effects on populations at further distances.
Contextual Effects and Local Focusing Events
Political scientists are increasingly attuned to the fact that salient and spatially proximal events cause changes in mass political behavior (Cho & Gimpel, 2012; Velez & Martin, 2013; Bishop, 2014; Enos, 2016). Spatial proximity to violent events appears to be politically transformative. For example, Newman and Hartman (2019) find that spatial proximity to mass shootings increases support for restrictive gun control policies, while Garcia-Montoya, Arjona, and Lacomb (2022) find that school shootings increase local support for Democratic candidates but do not impact voter turnout. 1
Persistent violence is associated with lower levels of political participation. While early research on criminal violence suggests that personal victimization is associated with a higher propensity to vote (Bateson, 2012), scholars have recently linked neighborhood criminal violence to voter disenfranchisement (Trelles & Carreras, 2012). Using longitudinal data from Mexico, Trelles and Carreras (2012) find that an increase in the local homicide rate is associated with a decrease in voter participation rates. They argue that voters who experience greater levels of criminal violence in their proximity have lower satisfaction with local political institutions and democratic practices (Fernandez & Kuenzi, 2010; Carreras, 2013), which in turn leads to lower levels of electoral participation. Similarly, various scholars find that fear of political violence in developing countries demobilizes voters (Bratton, 2008). In general, research on the effects of local violent events suggests that they have important spatial components, though the effects appear to be localized to smaller geographic units.
Police violence may have different repercussions on political behavior than criminal violence, however. Yet, a broad array of scholarship suggests that residential proximity to police violence causes various detrimental psychological effects. Scholars find that proximal police shootings affect mental health, school performance, and crime reporting (Bor et al., 2018; Ang, 2020; Desmond et al., 2016). Far from causing small behavior changes, their substantive effects have important implications for many outcomes we care about as social scientists. For example, Ang (2020) finds that students living within half a mile of a police shooting during 9th grade were 3.5 percent less likely to graduate from high school and 2.5 percent less likely to attend college. Related scholarship also finds that police violence and perceived injustice aggravate attitudes towards law enforcement. Desmond, Papachristos, and Kirk (2016) find that following the police beating of Frank Jude, an African American male in Milwaukee, Wisconsin, city residents, particularly Black residents, were less likely to report crimes relative to the pre-treatment control group. 2
Police and Anti-Democratic Political Socialization
Research on police violence further suggests that negative interactions with law enforcement, particularly those perceived as violent or unjust reduce trust in policing (Weitzer & Tuch, 2005; Nadal et al., 2017; Brunson & Miller, 2005; Mullinix et al., 2020). For example, Weitzer and Tuch (2005) find that “personal and vicarious experiences with police misconduct” were correlated with negative perceptions of law enforcement (p. 319). Negative perceptions of law enforcement may translate to negative perceptions of government generally. Lipsky (1980) argues that street-level bureaucrats function as policymakers. Their policy-making power stems from the discretion their respective institutions allow them (Lipsky, 1980, pp. 13–16). Law enforcement officials have wide discretion in whom they stop, detain, arrest, and how much force they use to do so (Goldstein, 1963). The use of force can be understood as a ‘policy decision.’ Policies can teach citizens political lessons about the function of government, citizens’ relationship to the state, political efficacy, and de-facto civil rights (Mettler & Soss, 2004). Citizens perceive police behavior, judge their decisions, and learn political lessons conditional on their judgment.
In a seminal paper on political learning through policy feedback effects, Soss (1999) finds that welfare recipients’ negative experiences with welfare agents dampen recipients’ political efficacy and trust in government. Lower political efficacy and trust in government lead to lower political participation. Much like poor experiences with welfare offices teach clients political lessons that are antagonistic to democratic ideals, police officers’ treatment of citizens can potentially teach political lessons that influence civic participation. Lerman and Weaver (2014) find that all levels of criminal justice contact attenuate civic participation. They argue that “citizens who have adversarial interactions with law enforcement become less likely to seek out government of any kind,” believing it is something to be avoided (Weaver & Lerman, 2010). Both trust in government and political efficacy are central to Weaver and Lerman’s (2010) theoretical mechanism. Mediation analysis by Davis (2020) supports their theory.
Lerman and Weaver’s (2010; 2014) research focuses on individuals who experience direct contact with law enforcement and carceral agents. However, some research suggests that proximal experiences with the carceral state may actually increase political participation (Walker, 2014; White, 2019A; White, 2019B). 3 Walker (2014) argues that individuals whom only experience “proximal contact” with the criminal justice system do not suffer the same consequences as people with personal contact. For example, personal contact potentially leads to a conviction record that can increase social stigma and lower earning capacity. Since these factors are relevant to participation, they may decrease voter turnout through a mechanism possibly irrelevant in proximal contact. Instead, she argues that “when moments of personal contact are seen as unjust, this can lead to increased participation in politics around criminal justice issues.”
However, spatially proximal police killings do not constitute the same relationship as the “proximal contact” studied by Walker (2014). Studies investigating contextual and neighborhood effects generally suggest that aggressive policing practices demobilize the communities in which they take place (Burch, 2013; Kang & Dawes, 2017; Laniyonu, 2019). 4 Branton, Carey, and Martinez-Ebers (2021) find that people living in zip codes with more police killings have lower political efficacy even when including a broad series of individual and contextual controls. Silva et al.(2020) find that police killings also reduce local residents’ trust in government. Lower political efficacy and trust in government are likely to demobilize voters (Davis, 2020; Hooghe, 2017; Finkel, 1985).
In summary, this research suggests that those living closer to a police killing are more likely to be psychologically affected by the event. If voters perceive the killing as unjust, they may learn political lessons antagonistic to democratic participation, trusting government less and feeling less politically efficacious. In turn, less trust in government and less political efficacy lead to lower voter participation rates. Jointly, this research suggests that proximity to pre-election police killings will demobilize voters, promoting the following hypothesis: • Hypothesis 1: Police killings reduce proximal voters’ likelihood to vote.
Heterogeneous Effects: Race, Armed status, and Protests
Much of the research cited above points to potential heterogeneity. Voters’ pre-existing perceptions of police and a police killing’s contextual factors may mediate whether voters perceive lethal force as justified, shaping its impact on voters’ trust in government and political efficacy.
Black citizens are significantly more likely to be victims of police violence than Whites, even after controlling for criminality (Dunn, 2019; Scott et al., 2017; Morin & Stepler, 2016). In turn, Black citizens are less likely to trust law enforcement (Miller et al., 2004; Morin & Stepler, 2016). Brunson and Miller (2005) find that young Black men in poor urban communities viewed the police as harassing and ineffective at reducing crime, regardless of whether the respondent was engaged in delinquent activity or contacted by police. Therefore, Black Americans are more likely than White Americans to view a police killing as unjustified.
These racialized reactions to police killings are empirically visible. For example, Ang (2020) finds that police shootings are correlated with worse school performance only for students of color, particularly when a co-racial and co-ethnic victim is killed. Similarly, Bor et al. (2018) find that police shootings of Black victims dampen mental health for proximal Black residents. However, police shootings do not affect White state residents’ mental health irrespective of the victim’s race. Branton, Carey, and Martinez-Ebers (2021) find that only Black survey respondents’ political efficacy was affected by local police killings. White and Latino respondents’ political efficacy was unaffected by the number of neighborhood police killings. This research suggests that Black voters are more likely to see a police killing as unjustified and be psychologically impacted by them, motivating the following hypothesis: • Hypothesis 2: A police killing will have a stronger demobilizing effect on Black voters than on White voters.
Victims’ armed status may also shape perceptions of police killings as justified or not.
5
Williamson, Trump, and Einstein (2018) find that Black Lives Matter protests occurred in 24% of cities with at least one police shooting during the period of observation. However, protests occurred in 40% of cities with at least one unarmed death. While in that case, less justified police shootings were mobilizing, that may not always be the case. Ang (2020) finds that shootings of unarmed victims had stronger negative consequences on school performance for students living in proximity than police killings of armed victims. Police killings of unarmed suspects are more likely to be seen as unjustified than police killings of armed suspects. In turn, voters are less likely to trust government after a police killing of an unarmed victim, suggesting an additional hypothesis: • Hypothesis 3: A police killing of an unarmed suspect will have a stronger demobilizing effect on voter turnout than a police killing of an armed suspect.
Williamson, Trump, and Einstein (2018) find that police killings of Black victims predict the location of Black Lives Matter protests and locations with one Black Lives Matter protest were more likely to have subsequent protests. Research suggests that protests against police violence increase local voter participation (Enos et al., 2019). This may be because protests spill over into political mobilization through other means. If this is the case, police killings may actually increase voter turnout if followed by protests. Institutions that organize protests against police use of force might also organize local residents to vote after a police killing. These organizations are more likely to cement themselves as local mobilizing institutions through consistent collective action. Furthermore, participating in protests may directly lead to higher turnout for attendees. Evidence suggests that participating in Tea Party protests increased attendees’ likelihood to vote (Madestam et al., 2013). If local residents participate in protests aimed at reforming policing, they may feel more politically efficacious after a local police killing. Jointly, this research offers one additional hypothesis: • Hypothesis 4: A police killing in a community with more protests against police violence will be less demobilizing than a police killing in a community with fewer protests against police violence.
Data and Methods
The primary research design uses a linear probability difference-in-differences (DiD) model with matched groups. 6 This paper adapts a research design used by Burch (2013; also, see White 2019A) to match a treatment and control group. Assuming short-term temporal consistency in the determinants of police killings, this design helps control for endogeneity by only comparing individuals living in similar neighborhoods. I set up a quasi-experiment leveraging the variation in the timing of police killings. I compare individuals who experienced a police killing in their neighborhoods within the six months before the 2016 election (treatment group) to those who experienced an police killing in their neighborhoods in the six months following the 2016 election (control group). This method controls for the type of neighborhood that police killings occur in by only comparing individuals who live in places where they happened. This method assumes that the timing of an election is exogenous to the timing of police killings. Whether an police killing occurs before or after an election is essentially random. By comparing only individuals in neighborhoods where an police killing occurred, I compare neighborhoods that should be similar on observable and unobservable characteristics. Therefore, possible confounding variables like crime, poverty, and police-community relations are ruled out by design. The assumption of equivalency across groups is supported by comparison tables included in the supplemental material (See Supplementary Appendix B, Supplementary Appendix C, and Supplementary Appendix D).
Further steps are taken to rule out confounds by exploiting the longitudinal nature of the data, comparing changes in turnout rates between 2012 and 2016. This research design eliminates time-invariant and national time-variant confounds. Therefore, factors specific to the 2016 election should not affect the results. 7 Given the difference-in-differences design of matched groups, we should only see turnout effects related to the use of lethal force in voters that experienced a police killing in their proximity before the 2016 election. By analyzing changes at the individual level, we overcome complex methodological issues related to aggregation and ecological fallacies, linking neighborhood effects to individual-level outcomes.
Our primary independent variable is the location and timing of a police killing; more specifically, if someone experienced a police killing within a mile of their home in the six months before the 2016 general election. Robust data collection efforts on police killings began in 2015, making 2016 the first general election where this test is possible. I use data from Mapping Police Violence, a non-profit crowd-sourced dataset that aggregates data from media outlets and other non-profits like The Washington Post, Fatal Encounters, and Killed by Police. 8
My dependent variable is individual voter turnout during the 2016 election. I use individual-level voter files from California, Florida, and Ohio to measure voter turnout.9,10 While the case selection is primarily based on data accessibility, the sample includes states representing different geographic regions (West, Midwest, and South) and political cultures, which helps improve the study’s generalizability.
The coordinates of police killings and voters within these three states are geocoded.11,12 Geospatial measurement techniques are used to subset the data to voters living within a two-mile radius of a police killing. 13
I primarily study voters in a one-mile radius partially to align measurement strategies with past geo-spatial research on police killings (Ang, 2020 uses a half-mile radius). 14 However, a mile radius makes sense for other reasons as well. Police killings are often very localized events, as the vast majority are not mentioned in local newspapers (Ang, 2020, p.3). Years of segregation and sorting have made small geographic areas racially and economically homogeneous. Therefore, individuals within these communities are more likely to be directly affected by a nearby police killing. This is important because adding treated units into the control group is unlikely to bias estimates. However, including many untreated units in the treatment group may quickly dilute the treatment effect. Extending the spatial distance may also threaten the design. For example, it is impossible to implement the same design at the city or county level as many cities have police killings both before and after an election. A similar design at the city or county level would place all voters in those cities in both the treatment and control groups. The same would happen if we used much larger spatial distances. However, I compare voters living one to two miles away from a police killing and find that the effects are entirely diluted at that distance. The same is likely true at even further distances, so I do not investigate effects at the city or county level as the observed effects are no longer present at the one to two-mile range.
According to Mapping Police Violence, police killed 1134 people between May 8th, 2016 and May 8th, 2017 (six months before and after the 2016 election). One thousand eighty-nine of those deaths can be attributed to the use of lethal force. This does not include deaths by “vehicle,” which may result from unintentional automobile accidents. However, this does include deaths caused by tasers, strangulation, beatings, and other types of excessive force. The data suggests incidents of lethal force have been stable since 2014, showing temporal consistency in police killings. Two hundred eighty-five deaths occurred in the subset of states observed in this study. Two hundred seventy-seven are attributed to the use of lethal force. 15 One hundred thirty-one incidents occurred on or before the 2016 election. Individuals living by those incidents constitute the treatment group. One hundred forty-six incidents occurred after the 2016 election. Individuals living by those incidents constitute the control group. One hundred nine victims were White, 64 Black, 78 Latino, nine Asian, two Native American, three Pacific Islander, and the ethnorace of the remaining 12 is unknown.16,17 Comparing victims’ demographic characteristics and armed status suggests that they are mostly equivalent across the treatment and control groups.
Three police killings cannot be geocoded with enough statistical certainty to include in the study, leaving 274 police killings. 18 I use census tract information to compare the gender, age, and racial make-up of the pre-election and post-election killing census tracts. 19 The demographic characteristics roughly compare across the neighborhoods in the treatment and control groups.
Across California and Florida, the states where I was able to acquire limited data on the timing of municipal elections, 73 pre-election killings were in cities or towns with municipal elections during the 2016 general election and 79 post-election killings were in cities or towns with municipal elections during the 2016 general election suggesting that pre-election police killings are not more or less likely to occur in cities with a local candidate on the ballot.
I merge data tracking Black Lives Matter (BLM) protests at the city level from 2014 to 2015 collected by Williamson, Trump, and Einstein (2018). This data does not track protests in response to killings in the dataset because the killings included in this study happened after the protests. However, using protest data ex-ante police killings as a proxy for post-killing protests is essential for causal inference as including protests post-killings introduce biases associated with post-treatment controls (Montgomery et al., 2018). Furthermore, previous BLM protests predict future BLM protests in that city as relevant organizing and civic society institutions cement themselves in the community (Williamson et al., 2018).20,21 There were 82 BLM protests between 2014 to 2015 in cities in the pre-election killing group and 93 in cities in the post-election killing group.
Finally, the geocoded police killings data is merged with the geocoded voter files. The WRU package in R is used to predict the race of voters. Florida collects information on the race and ethnicity of voters in their voter registration forms. This information is available on their voter files allowing me to verify the validity of the measurement. 22
Voters at the cluster level in the treatment and control groups are compared based on the information available in their respective voter files and their predicted ethnorace.23,24 Groups are similar across demographic and partisan characteristics.
Findings
Here, I compare changes in voter turnout between the 2012 general presidential election and the 2016 general presidential election for the pre-election killing (treatment) group and the post-election killing (control) group.
First, I provide support for the parallel trends assumption crucial to standard DiD designs. Figure 1.1 models the average voter turnout rates of the pre-election killing group and the post-election killing group between 2008 and 2016.25,26 The parallel trends assumption is well supported in all cases by pre-treatment trends. Voter turnout rates increase for both the pre-election killing group and the post-election killing group between 2008 and 2012. While voter turnout rates increase slightly more for the post-election killing group (by 0.4 percentage points), the difference is minimal, not statistically significant, and the parallel trends assumption is well supported. Figure 1.2 through Figure 1.4 model the same trends disaggregated by voters’ race. In all cases, the pre-election killing group and the post-election killing group trends between 2008 and 2012 are nearly symmetrical and support the parallel trends assumption. Parallel Trends by Voter’s Race and Ethnicity.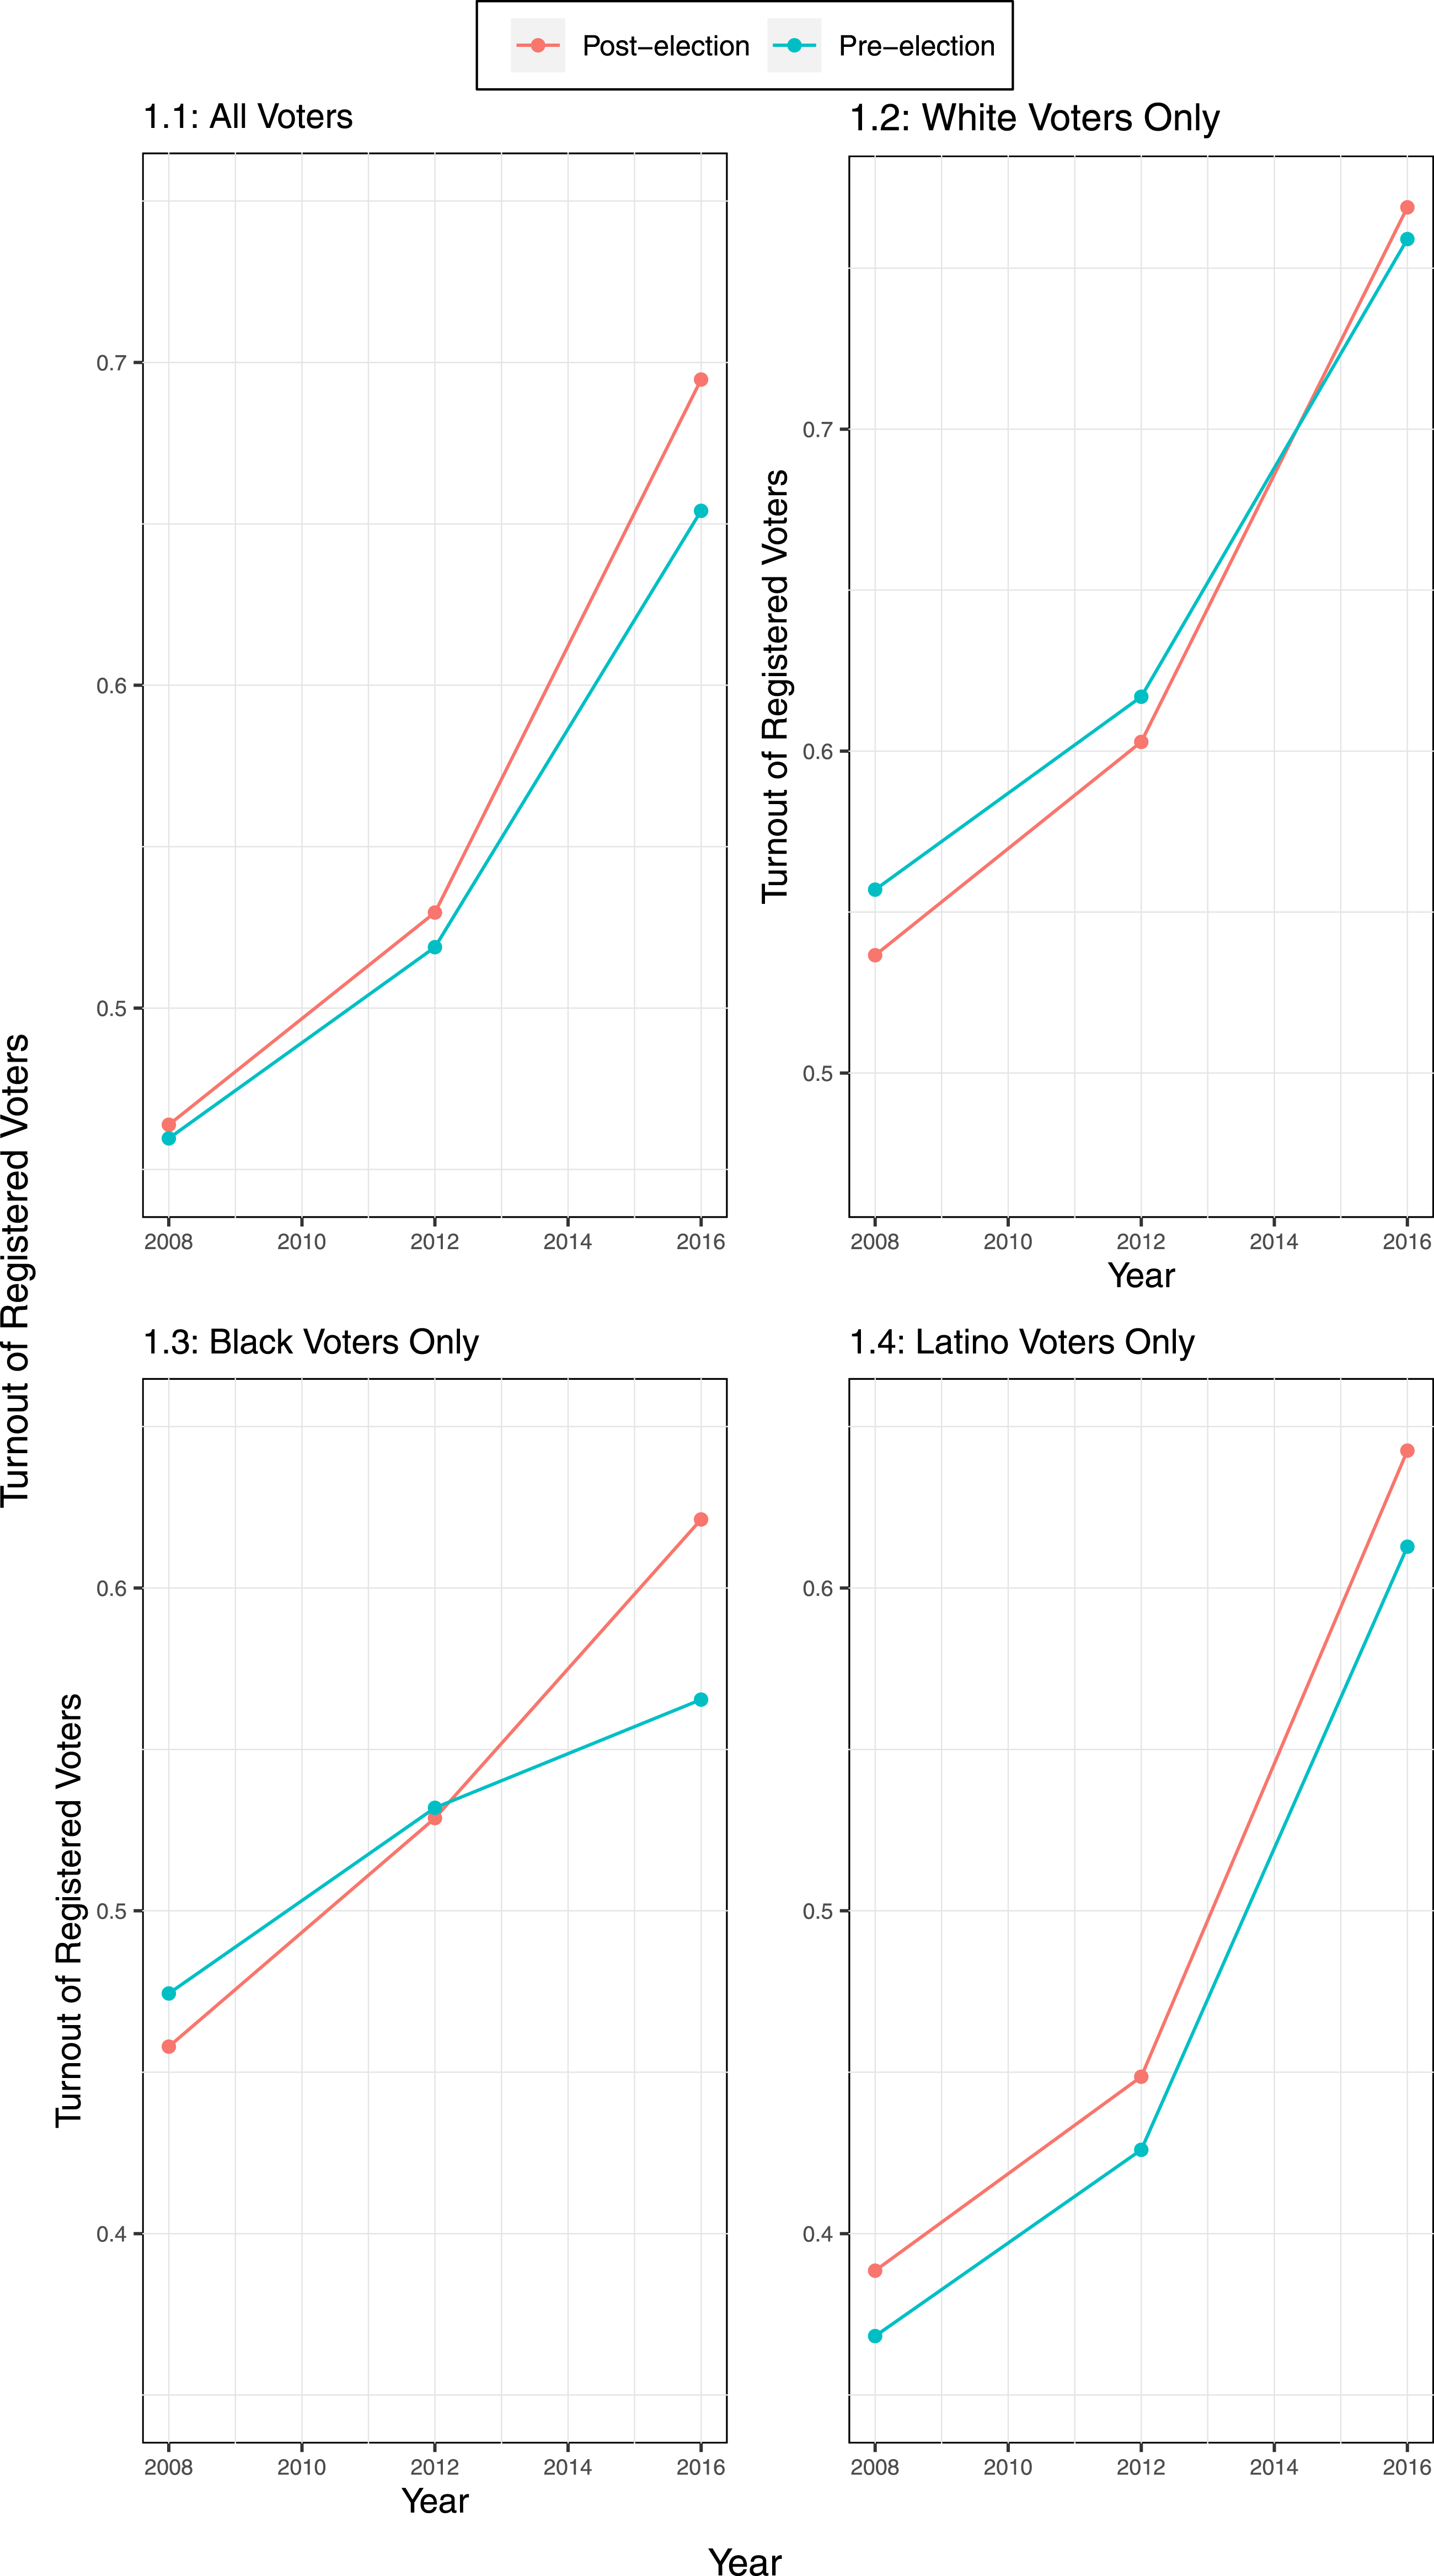
Figure 2 presents the results for the difference-in-differences analysis using a linear probability model, with the data disaggregated by voters’ race and ethnicity using cluster-robust standard errors.27,28 The analysis supports The Effect of A Pre−election Police Killing Within 1 Mile of Voters on Voter Turnout.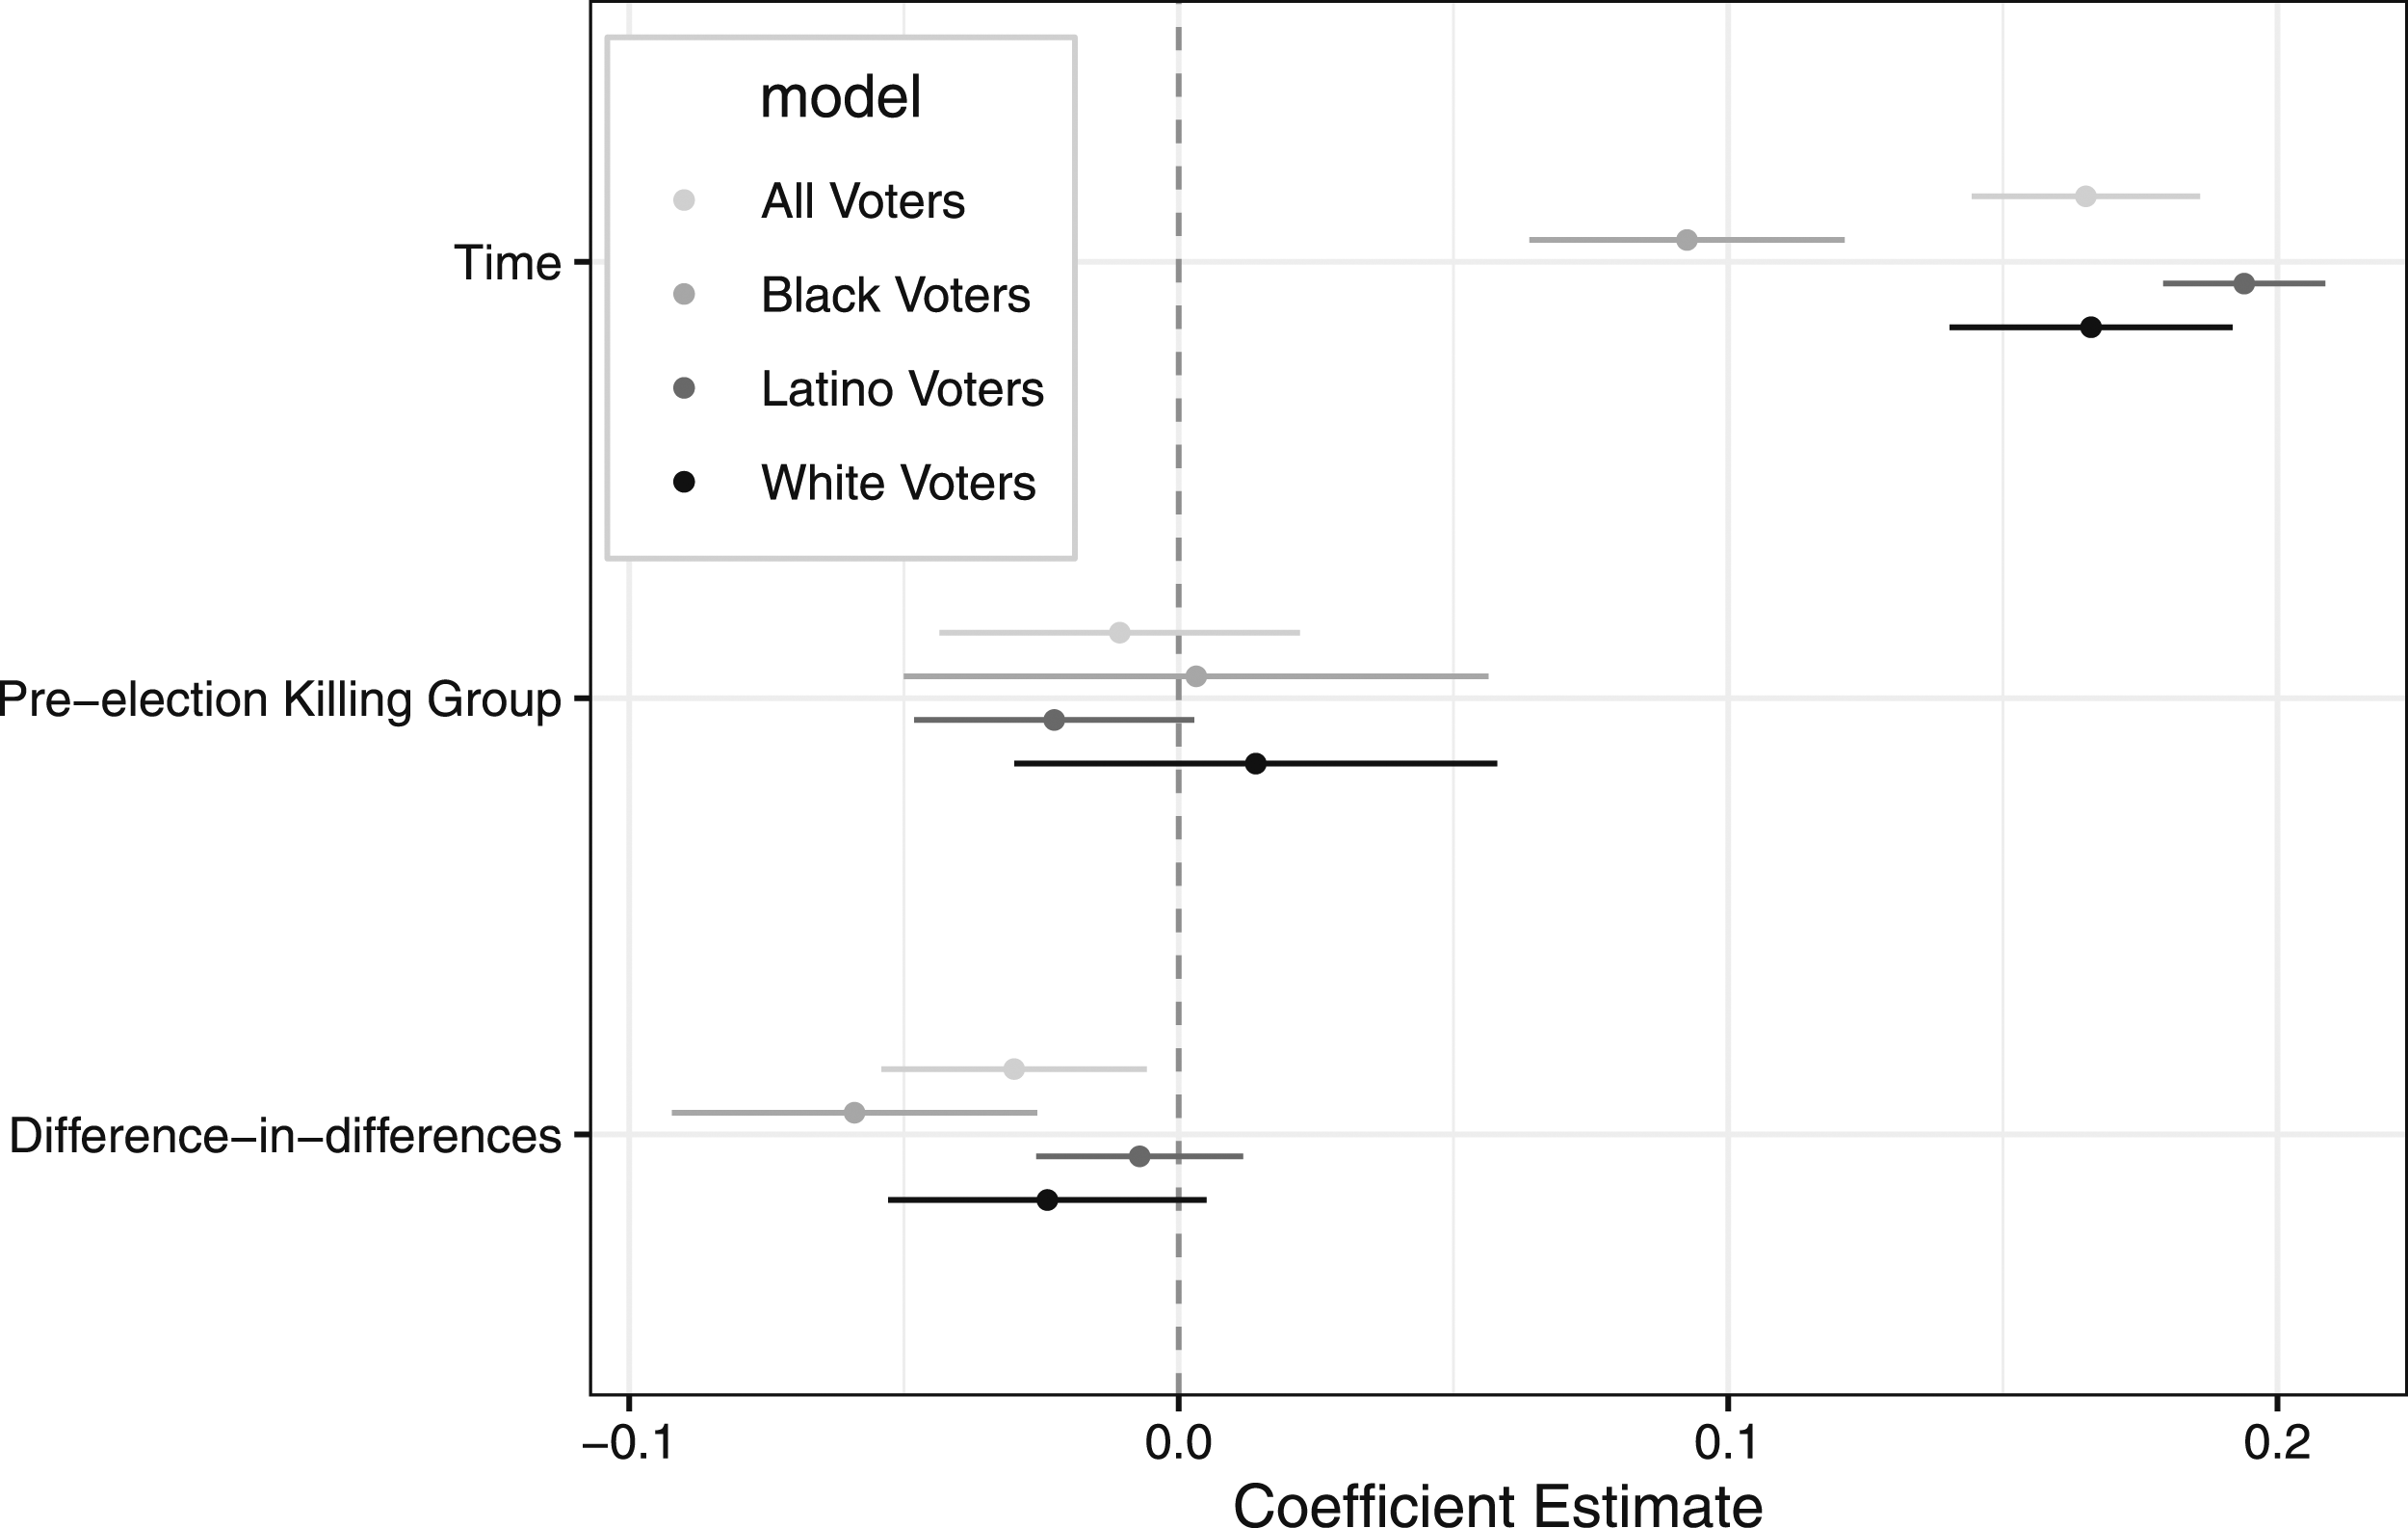
These findings have important implications for political equity and compound the already disenfranchising effects of race. Robustness checks suggest that police killings of Black victims are particularly demobilizing, reducing voter turnout by over 6.7 percentage points in their one-mile radius. Police killings of White and Latino victims do not have a statistically significant effect on proximal voter turnout. 30 It is unclear whether Black voters are more demobilized by police killings because they are more likely to live near a police killing of a Black victim or because Black voters interpret police killings differently, irrespective of the victims’ race and ethnicity. Black voters do not appear to react differently to police killings of co-ethnics compared to killings of non-co-ethnics. 31
The Role of Space
The distance between voters and pre-election police killings is a crucial part of the causal mechanism proposed in this study. If the distance between voters and police killings truly mediates the effect of police killings on voter turnout, one might expect that voters living closer to pre-election police killings are more affected by them than those living further away.
Aggregated data suggest that spatial proximity to police killings matters. Figure 3 compares the average turnout for the pre-election killing (treatment) and post-election killing (control) groups by race at 0.1-mile intervals from their associated police killing. Demographic and contextual covariates associated with the location of a police killing, like poverty and crime, are likely negatively correlated with voter turnout. However, it is important to remember that those factors are controlled for by the quasi-experimental design, which only compares neighborhoods with a police killing to each other. If the null hypothesis is correct and spatial proximity to a pre-election police killing is not associated with voter participation rates, we should expect equal levels of participation within distance intervals for the pre-election and post-election killing groups. In other words, if pre-election police killings have an independent effect on voter turnout, then the slopes of the lines should be different. Yet, Figure 3.1 suggests that voters who experienced a police killing within 0.1 miles of their home before the 2016 presidential election were about 4-percentage points less likely to vote on average compared to their counterparts who experienced a police killing at the same distance after the election. Voters living further away appear less affected by pre-election killings when compared to their control counterparts. Turnout rates for the pre-election killing (treatment) and post-election killing (control) groups begin to overlap around the 1.8-mile interval. Average Turnout by Distance From Police Killing.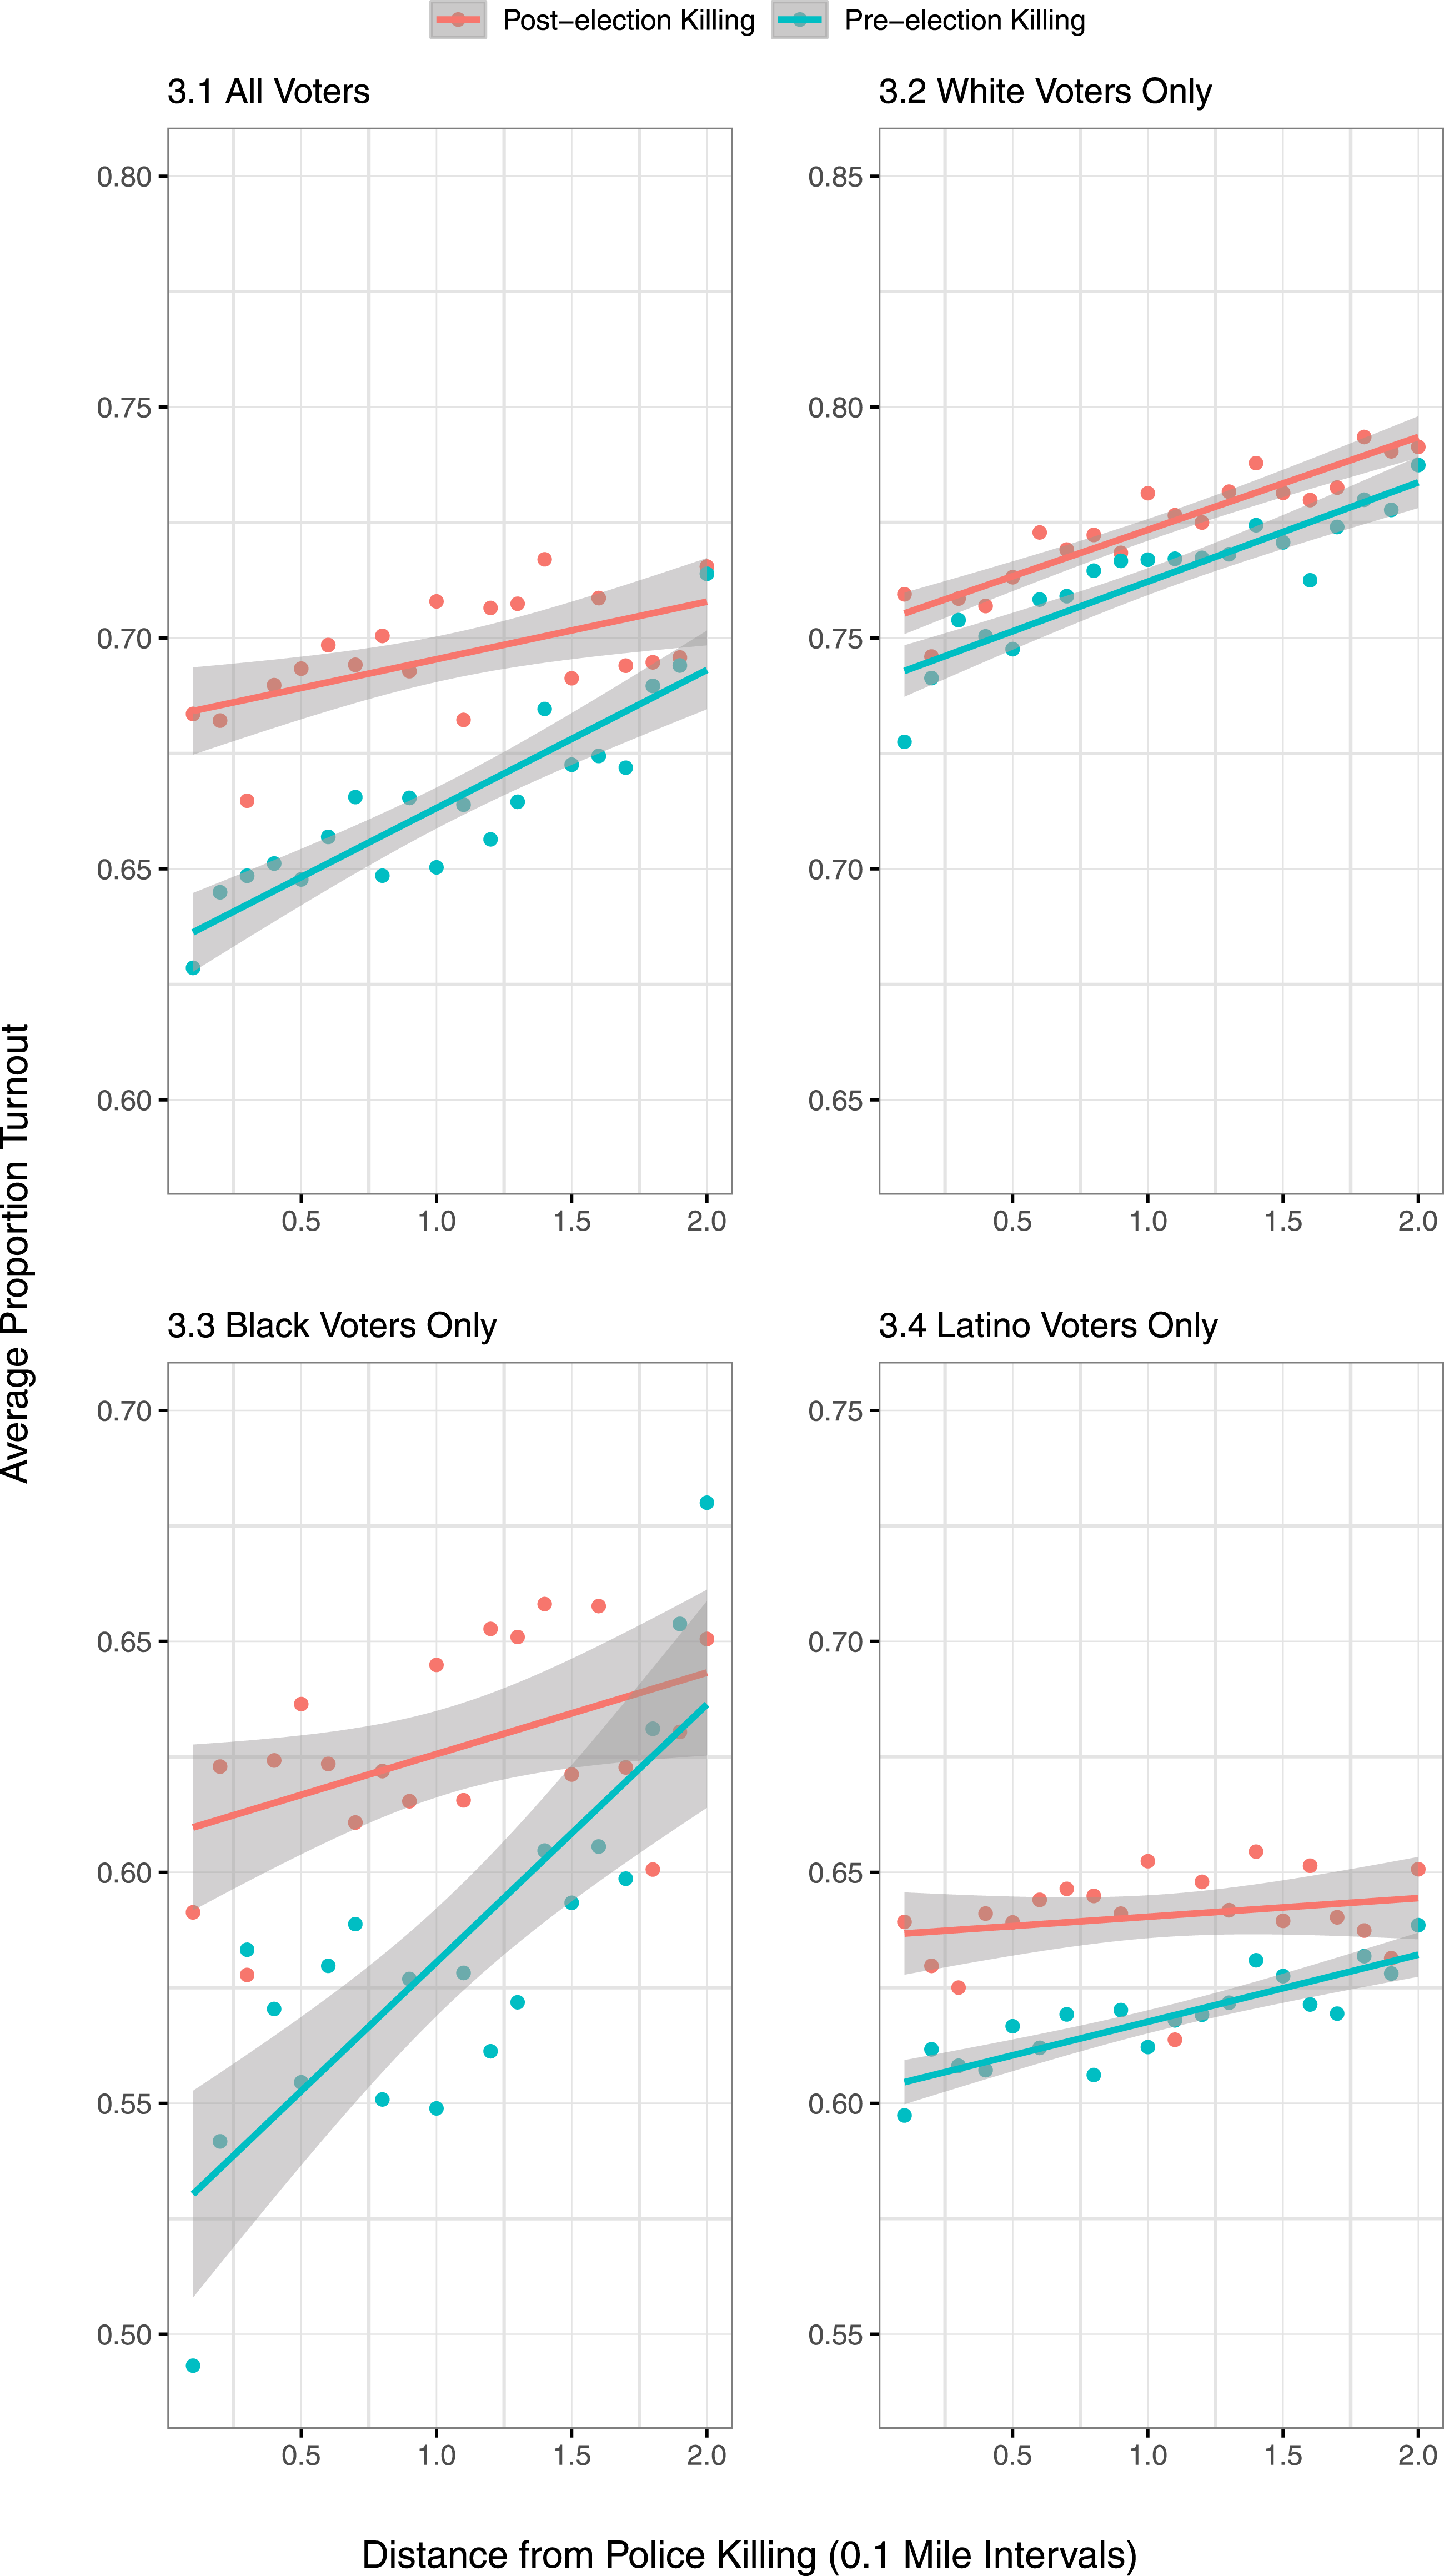
Voters’ race and ethnicity continues to matter. For example, we see different patterns if we compare Figure 3.2, which models White voter turnout, to Figure 3.3, which models Black voter turnout. Figure 3.2 suggests that White voters living within 0.1 miles of a pre-election police killing are about 1 percentage points less likely to vote than their control counterparts. The difference is small and about the same when we observe White voters living two miles away from police killings, suggesting that proximity to pre-election police killings has no impact on White voters. On the other hand, Figure 3.3 suggests that Black voters living 0.1 miles away from a pre-election police killing are about 8 percentage points less likely to vote than their control counterparts. We see similar though weaker patterns for Latino voters. Latino voters living within 0.1 miles of a pre-election police killing are about 3 percentage points less likely to vote compared to their respective control group. For both Black and Latino voters, distance from a post-election police killing is not associated with differences in voter turnout even through the influence of covariates. However, proximity to a pre-election police killing is negatively associated with voter turnout. While Black voters living 0.1 miles or less away from a police killing were 8 percentage points less likely to vote than their control counterparts, distance depreciates the effects until turnout among the pre- and post-election killing groups are statistically indistinguishable at about the 1.5-mile range. Similarly, Latino voters living further away from pre-election police killings appear less demobilized, behaving more like their control counterparts.
In this section, I test the spatial robustness of results using the same modeling strategy previously employed. First, the participation rates of voters living one to two miles away from a pre-election police killing are compared to those of voters living one to two miles away from a post-election police killing using a difference-in-differences design. Likewise, the spatial range is also adjusted downward, comparing the participation rates of voters living half a mile or less away from a pre-election police killing to the participation rates for voters living half a mile or less away from a post-election police killing using a difference-in-differences design. We should expect that voters living half a mile or less away from a police killing will be more demobilized than voters living one to two miles away from the killing if spatial proximity matters. 32
Figure 4 presents the difference-in-differences analysis for the varied spatial ranges. Again, the Difference-in-differences coefficient is the outcome of interest in this set of models. It represents the relative effect of a pre-election police killing on voter participation rates. When observing all voters in Model 1 in Figure 4, we see that pre-election police killings have no statistically significant effect on voter turnout for voters living one to two miles away from the killing (p = 0.7). We fail to see effects even if we disaggregate by voters’ race and ethnicity. Model 2 and Model 3 show that Black and Latino voters living one to two miles away from a pre-election police killing are not less likely to vote than Black and Latino voters living one to two miles away from a post-election killing (p = 0.7; p = 1). The Effect of a Pre−election Police Killing On Voter Turnout at Varied Spatial Distances.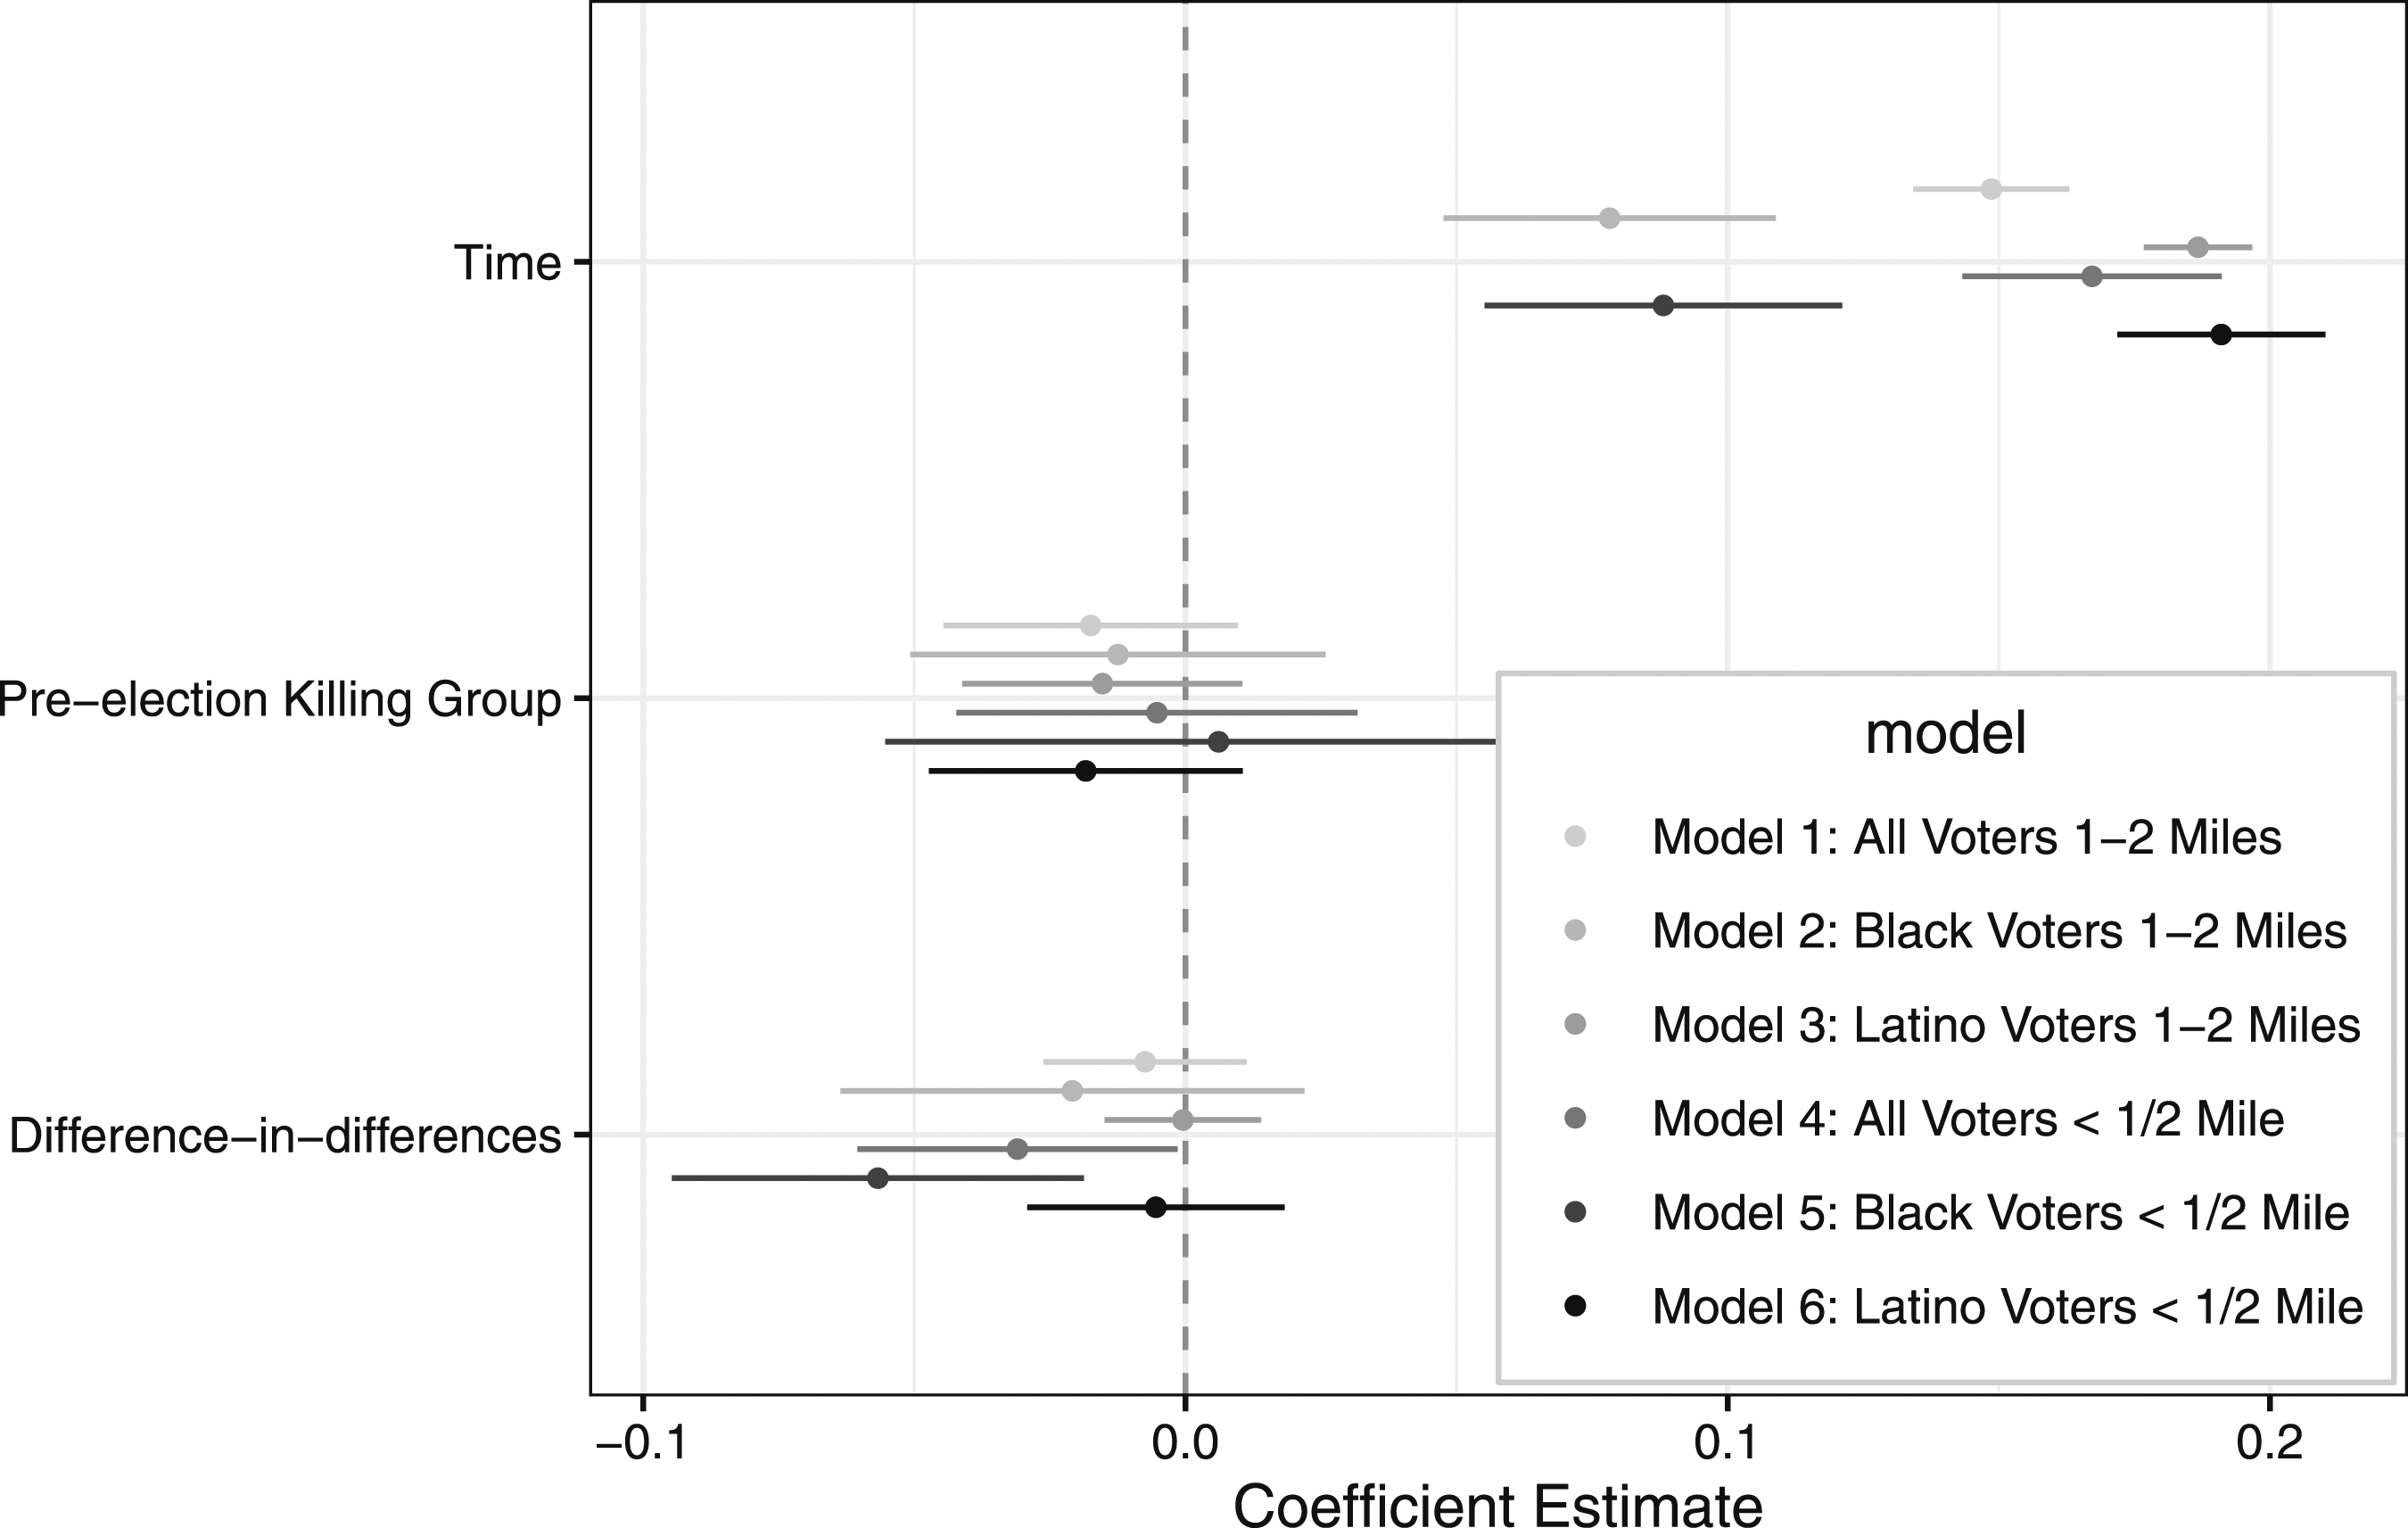
However, we observe very different results when analyzing the participation rates of voters living less than a half mile away from the same set of police killings. Model 4 in Figure 4 suggests that pre-election police killings reduce voter turnout rates by 3.1 percentage points in their half-mile radius (p = 0.04). The effects are similar to those observed in the one-mile radius previously (3 percentage points). Similarly, Model 5 in Figure 4 implies that pre-election police killings reduce Black voter turnout rates in their half-mile radius by about 5.7 percentage points (p < 0.01). The estimated effects of police killings on Black voters living less than a half-mile away from a pre-election police killing is about the same as the estimated effects of police killing on Black voters living less than one mile away (5.7 percentage points versus 5.9 percentage points). On the other hand, Model 6 in Figure 4 suggests that even at smaller distances, pre-election police killings do not affect Latino voters’ political participation rates.
These findings further support the proposition that the distance between voters and pre-election police killings plays an important mediating role. It does not appear to be the case that simply living in a city or media market area where a pre-election police killing occurs is driving the results. Instead, spatial proximity between voters and these locally salient events appears to shape participation patterns in significant ways. Furthermore, the analysis further suggests that Black voters’ responses to pre-election police killings are driving most of the effect we observed when looking at all voters.
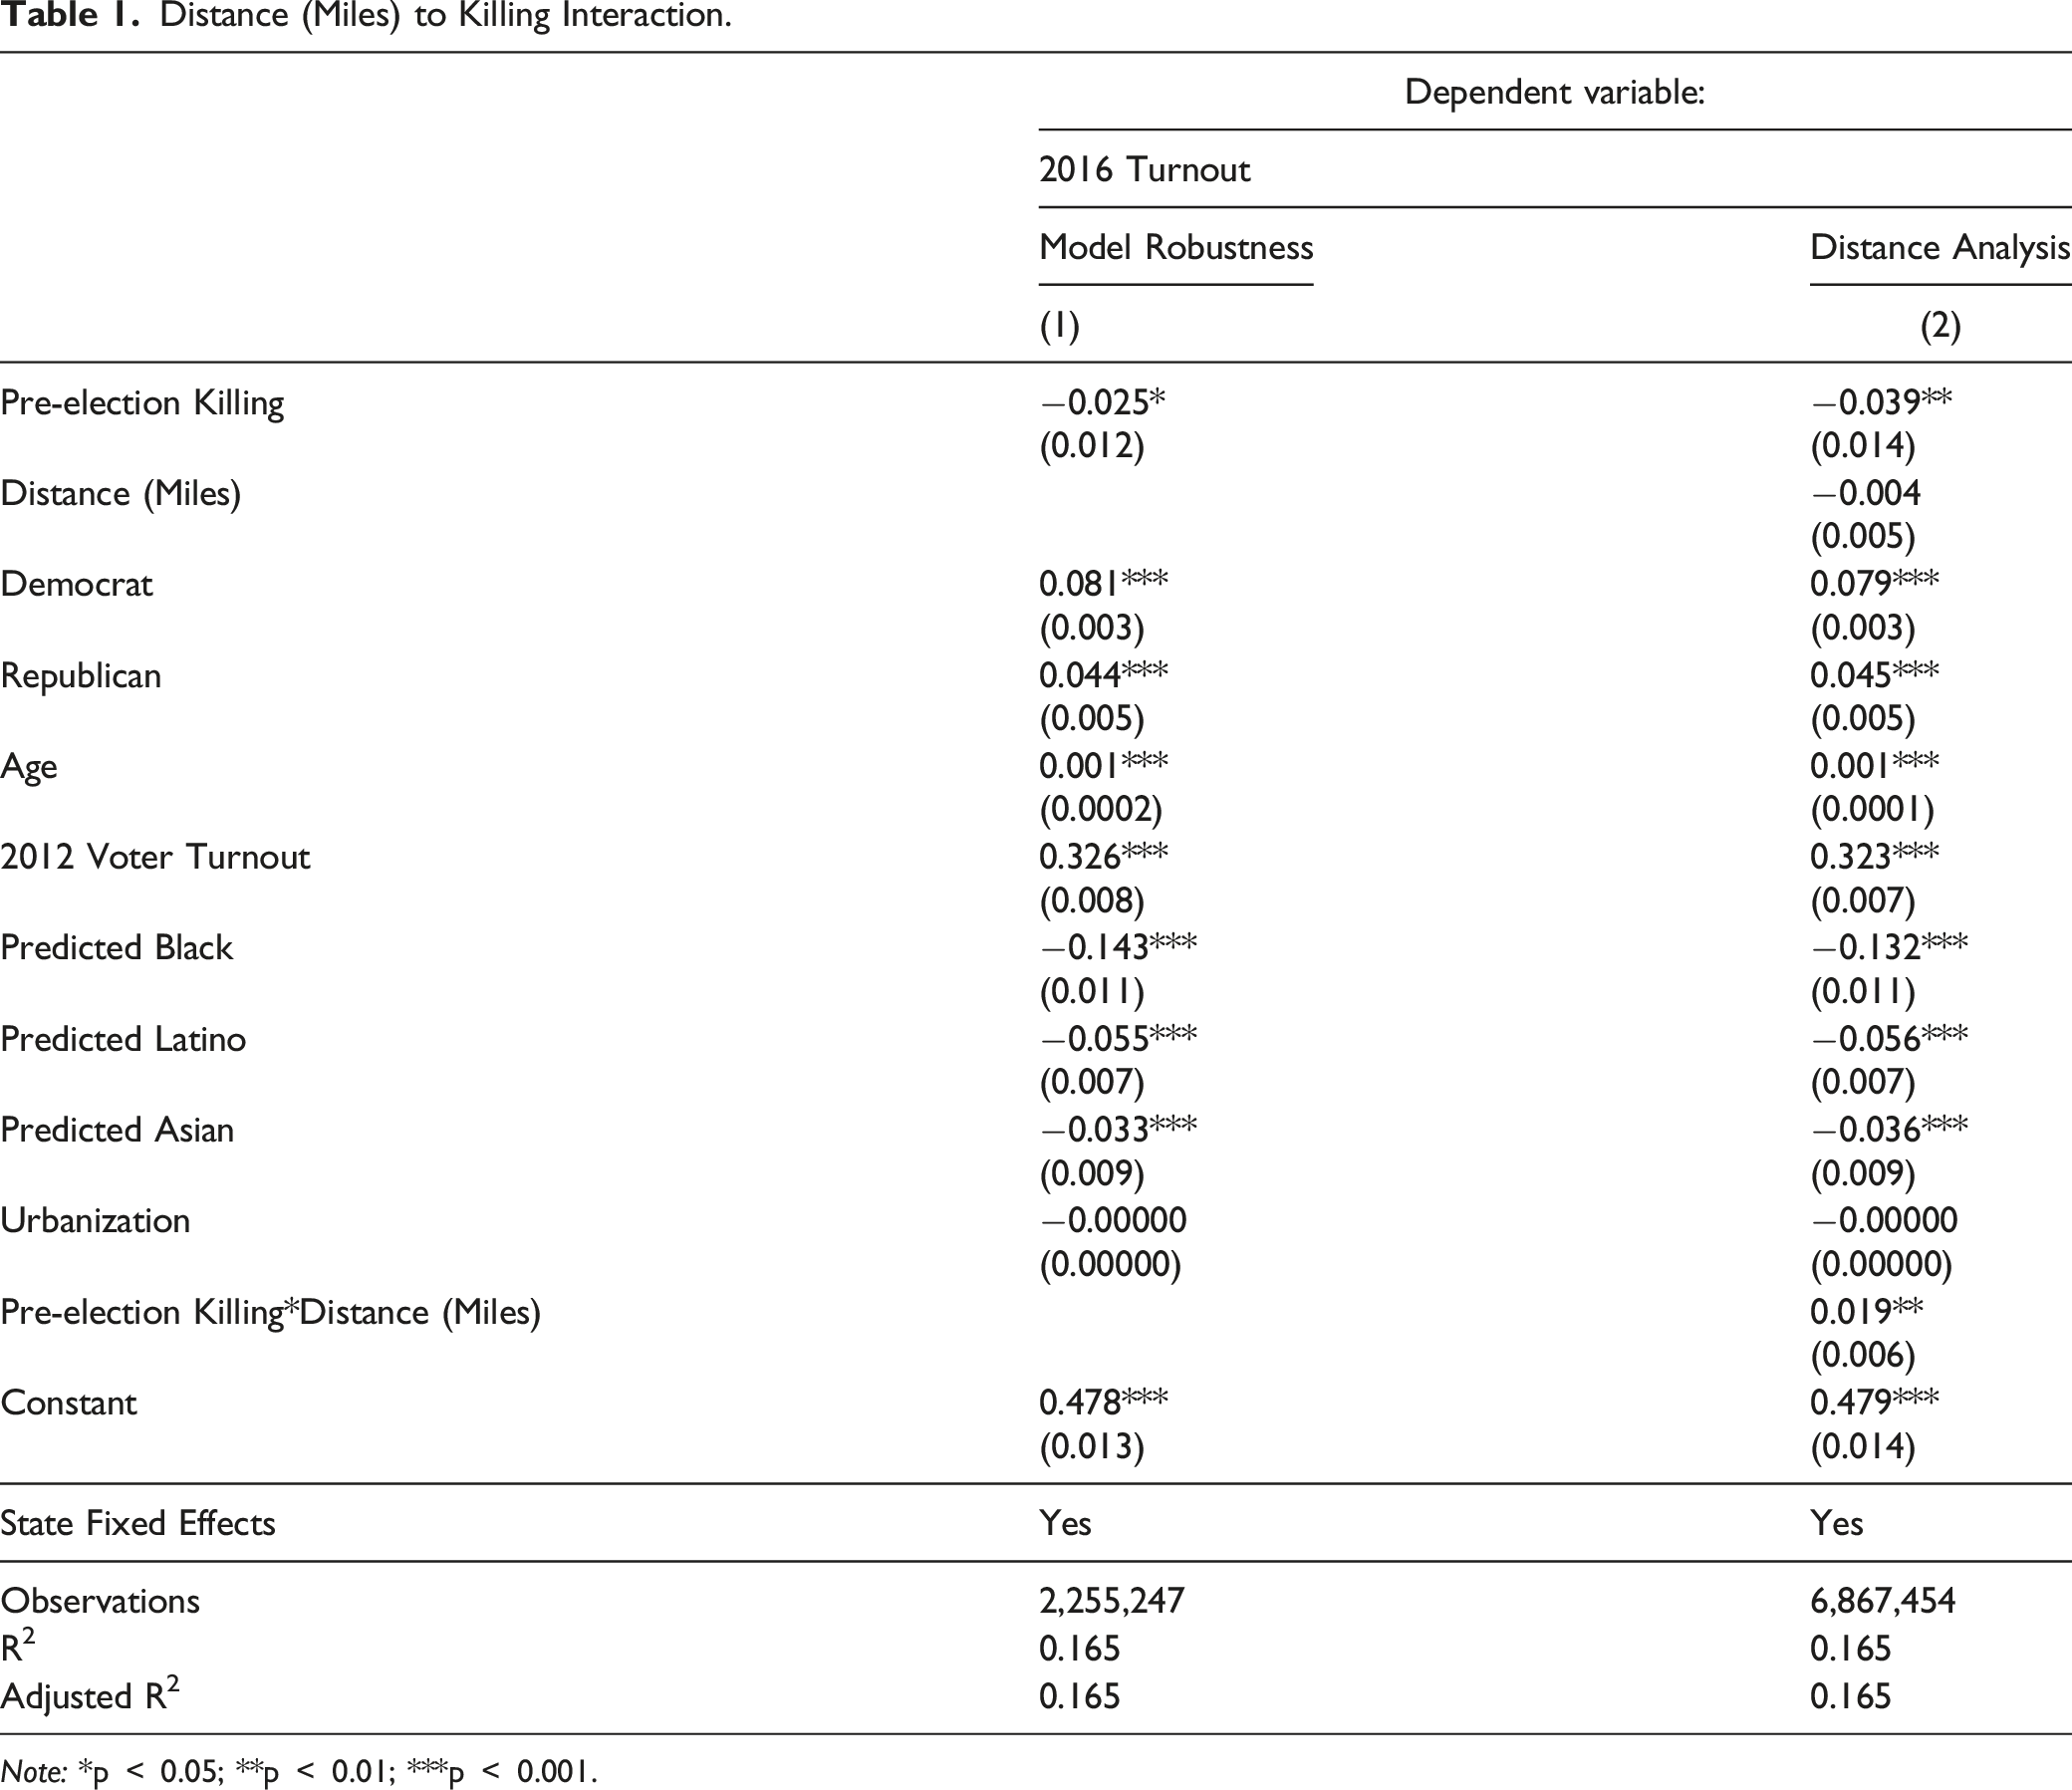
As an additional test of the spatial component, I conduct a cross-sectional analysis using a linear probability model to test for a continuous relationship between proximity to a police killing and voter turnout, leveraging the quasi-experimental design to account for neighborhood-level covariates. 33 Using multivariate cross-sectional regressions makes results more easily interpretable than using a three-way interaction model (a triple difference-in-differences) to account for the effect of distance. Since groups are matched, both observable and unobservable sources of variation are controlled for. However, controls for voters’ demographic characteristics, past voting behavior, and the urbanization rates of the community are included. 34 All models include state-fixed effects and robust standard errors clustered at each killing.
Distance (Miles) to Killing Interaction.
Note: *p
Next, in Model 2 in Table 1, I interact a dummy variable representing whether a voter experienced a police killing within two miles of their home before the 2016 election with the distance between voters’ home addresses and the police killing (measured in miles) to test for spatial proximity’s effect. The Distance coefficient represents the effect of distance between voters and post-election police killings. The coefficient is very small and negative but not statistically significant, implying that distance between voters and a post-election police killing does not impact voter turnout when controlling for other factors. This is expected because the killing occurs after the election. On the other hand, the Pre-election Police Killing coefficient is negative and statistically significant (p < 0.01). The coefficient indicates that living immediately next to a pre-election police killing makes voters about 3.9-percentage points less likely to vote on average. The interaction term Pre-election Police Killing*Distance is positive and statistically significant indicating that voters living further away from a pre-election police killing are more likely to vote on average than voters living immediately next to a pre-election killing (p < 0.01). Each one-mile distance between a voter’s home and a pre-election police killing reduces the negative impact of a police killing on voter turnout by 1.9 percentage points. This implies that the effects of a pre-election police killing completely taper off after slightly more than two miles, though the confidence intervals overlap at a shorter distance (near the 0.5-mile range). These findings further support the theory that the spatial distance to a police killing moderates its impact on nearby voters. In summary, the effects of police killings on proximal voter turnout appear to be negative and substantive but very localized.
Cross-sectional Analysis: The Role of Armed Status and Protests
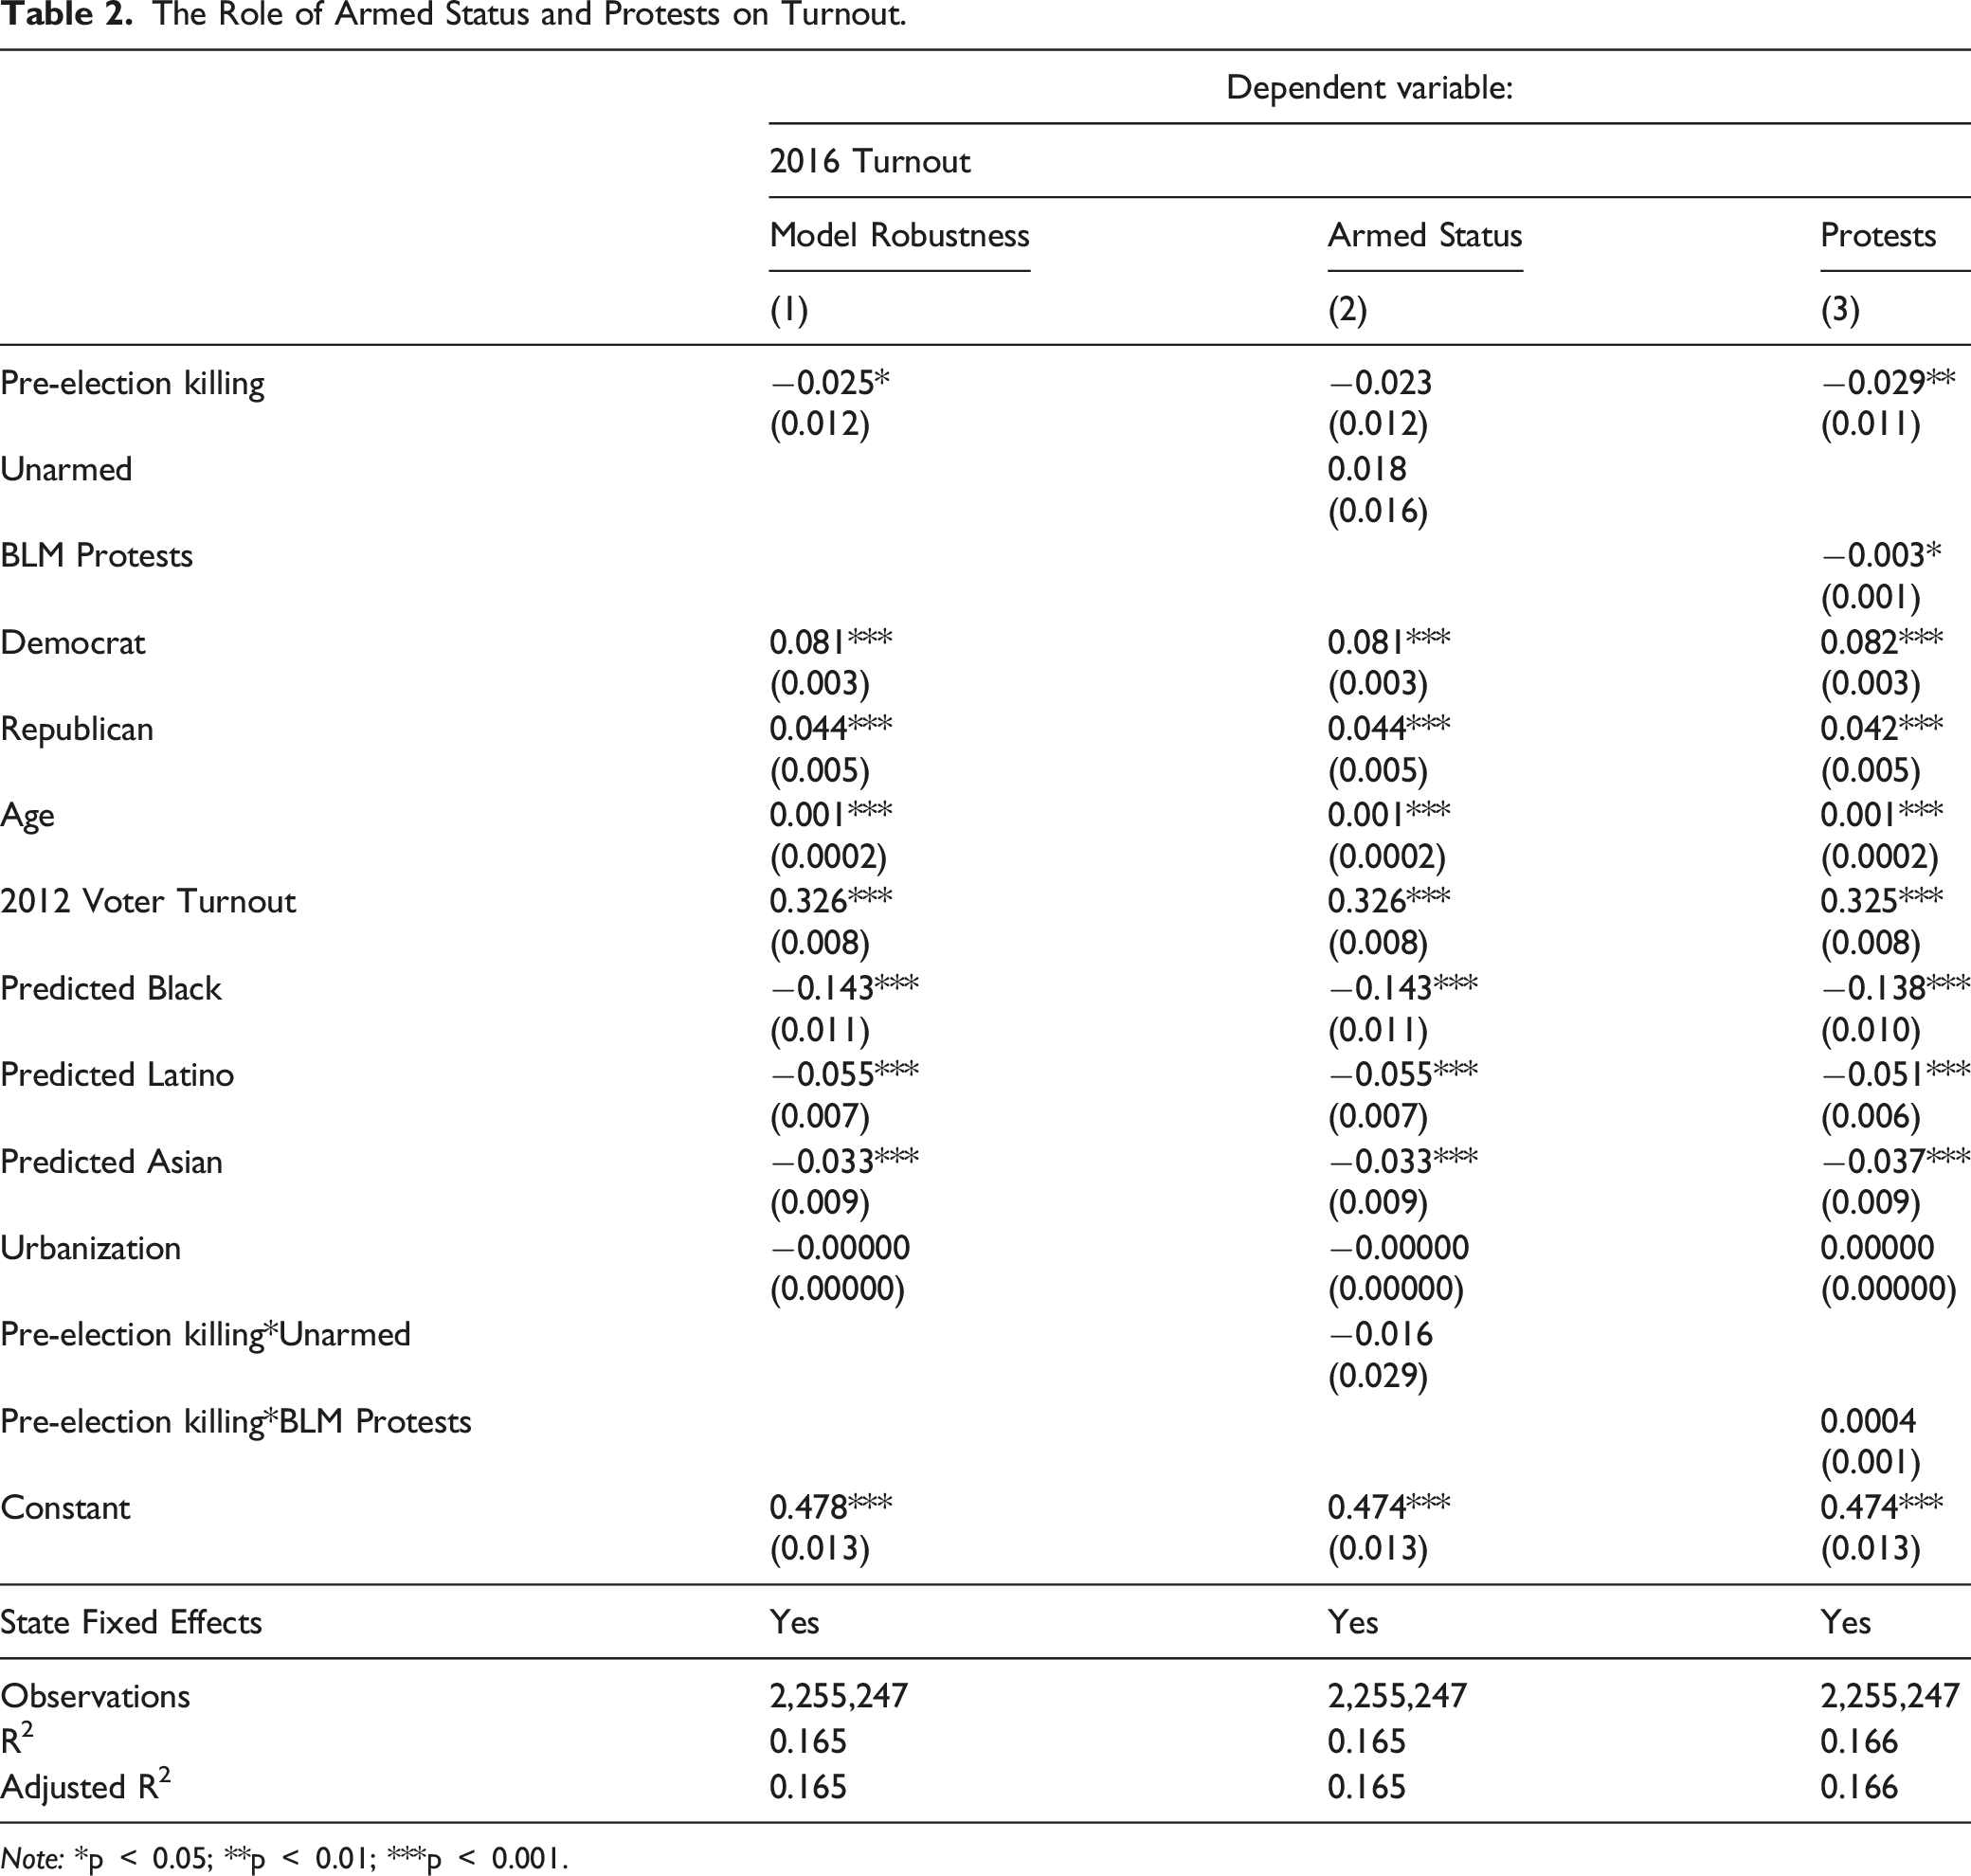
The Role of Armed Status and Protests on Turnout.
Note: *p
Model 2 in Table 2 tests
Model 3 in Table 2 presents the analysis that tests
Discussion
Police killings are not only a tragedy in their own right; they disrupt communities’ social, economic, and political structures. In line with much of the research studying the carceral state’s impact on political behavior, police killings reduce voter turnout rates of residents living within a mile by 3 percentage points. To give these rates some perspective, about 35,000 voters living within a mile of a pre-election police killing were demobilized in just these three states.
These effects appear substantial if we consider how difficult it is for targeted interventions to shift voting behavior. While these are very different sources of (de)mobilization, it may help contextualize effect sizes. Commercial phone banking only increases voter turnout by about 0.5 percentage points (Gerber & Green, 2015, p. 76). In order to combat these effects, a ‘Get Out the Vote’ campaign using commercial phone banking would have to contact nearly 7 million voters. Door-to-door canvassing, the most effective ‘Get Out the Vote’ strategy, can directly increase voter turnout by about 6.5 percentage points at most when appropriately targeted, not including indirect effects of diffusion into other household members (Gerber & Green, 2015, p. 32). Considering only direct effects, a door-to-door canvassing campaign would have to contact about 533,000 households to counteract these effects. With first-time contact rates lower than 25% (Gerber & Green, 2015, p. 32), the campaign would have to knock on over 2 million doors in just these three states. Even small shifts in voter participation rates are important given the cost of marginally increasing turnout and that efforts to organize and advocate against police use of force through protests may not mitigate the negative impact of police killings on proximal voter turnout. Moreover, while this study only observes patterns in three states, these states have geographic and cultural variation and represent about 25% of police killings during this time, suggesting that these patterns may generalize elsewhere in the United States.
However, these findings may not generalize to other types of elections. Laniyonu (2019) finds that Stop-and-Frisk enforcement had different effects on New York City residents depending on the importance of policing in the election. Particularly, voters seemed to behave differently when faced with a local election where stop-and-frisk policies were salient and amenable to change. While admittedly a limited test of this potential moderator, I do not find that pre-election police killings had a different effect in California cities with mayoral or law enforcement-related elections compared to California cities without these elections. 40 Pre-election police killings may have different effects for strictly local elections or in local elections where policing policy is an important campaign issue, however. The effects may also be different in the 2020 general election, where the police killing of George Floyd and other unarmed Black Americans in the months leading up to the election became an important campaign issue.
A core finding in this study is that police killings demobilize proximal Black voters more than White and Latino voters and police killings of Black victims are particularly demobilizing. Robustness checks indicate that voters living within one mile of a police killing of a Black victim are about 6.7 percentage points less likely to vote. 41 On the other hand, police killings of White and Latino victims have limited or no effect on voter turnout. 42 One possible explanation for these findings is that Black Americans have stronger feelings of linked fate than other racial and ethnic groups, believing that what happens to other Black Americans impacts them (Dawson, 1994). Therefore, Black voters may be responding differently to police killings largely based on the killing of a co-ethnic, seeing that as a threat to their livelihood. However, robustness checks fail to provide direct evidence for this mechanism. 43 While this test would be more rigorous and precise with better data on voters’ ethnic and racial identities, there is no evidence in this data to indicate that voters are responding differently to co-ethnic killings. Black voters appear to be demobilized by pre-election police killings irrespective of the victim’s race or ethnicity and Latino and White voters are not demobilized irrespective of the victim’s race and ethnicity.
Black voters living immediately next to a pre-election police killing are 8.1 percentage points less likely to vote. On the other hand, White and Latino voters living immediately next to a pre-election police killing are unaffected. 44 The null effect of pre-election police killings on White and Latino voters does not appear to be caused by an information deficit if we assume that voters will likely know about a police killing within a block or two of their home. Instead, knowledge of proximal police killings appear to impact White and Latino voters’ participation rates less than Black voters. This finding is in line with previous research which finds that police killings reduce Black Americans’ political efficacy more than they reduce White voters’ and Latino voters’ political efficacy (Branton et al., 2021). White and Latino voters are more likely to trust police than Black voters in general (Krogstad, 2014). This may be because of the historically complex relationship between Black Americans and law enforcement, which makes Black Americans more suspicious of police behavior (Alexander, 2020; Brunson & Miller, 2005). If voters see a police killing as justified, it is less likely to diminish their trust in government or political efficacy.
The evidence suggests that police killings may exacerbate patterns of unequal political participation in American democracy. While the spatial analysis indicates that the effects are very localized, spatial proximity may simply be a proxy for event exposure. Future research may choose to investigate whether other types of exposure produce similar demobilizing effects or if these findings are specifically neighborhood-level effects.
One question that remains unclear given the scope and design is the exact temporal component. 45 It is almost certain that these effects taper off at some temporal distance. Determining how far the effects extend is important in understanding how many people are demobilized by fatal police violence. 46
While the effects of police killings on proximal voter turnout are unlikely to change election outcomes, the findings from this study help shed light on the role that policing practices play in shaping political behavior by focusing on an increasingly important researched topic in political science: police violence. It expands on seminal theories by studying how close spatial proximity to police violence affects political behavior, looking beyond just direct personal experiences with criminal justice agents. This research also speaks to broader topics in comparative politics, intersecting issues of race and ethnic politics, political violence, crime, and policy feedback effects. This paper suggests that single events in our spatial proximity can significantly affect our public opinion and political behavior. More specifically, proximal experiences with violence, particularly state-sanctioned violence, can significantly affect one’s relationship with the state, interactions with it, and one’s sense of political efficacy.
Supplemental Material
Supplemental Material - The Impact of Police Killings on Proximal Voter Turnout
Supplemental Material for The Impact of Police Killings on Proximal Voter Turnout by G. Agustin Markarian in American Politics Research.
Footnotes
Declaration of Conflicting Interests
The author(s) declared no potential conflicts of interest with respect to the research, authorship, and/or publication of this article.
Funding
The author(s) received no financial support for the research, authorship, and/or publication of this article.
Supplemental Material
Supplemental material for this article is available online.
Notes
Author Biographies
References
Supplementary Material
Please find the following supplemental material available below.
For Open Access articles published under a Creative Commons License, all supplemental material carries the same license as the article it is associated with.
For non-Open Access articles published, all supplemental material carries a non-exclusive license, and permission requests for re-use of supplemental material or any part of supplemental material shall be sent directly to the copyright owner as specified in the copyright notice associated with the article.