
Abstract
Interest in voting by mail has increased during the coronavirus as a way to avoid in person contact. In this study, we conducted a survey in February 2020 in the United States to examine citizen preferences to cast their ballot at a polling station, over the internet, or by mail. By including simultaneously internet and mail as alternative voting options to the polling station we aim to disentangle convenience (both alternative options are presumably more convenient) from novelty (internet is more novel than mail and polling station voting). We find that the person who likes voting by mail the most is an older White-American with little interest in politics; and the person who likes voting by mail the least is a younger African-American or Latino with high interest in politics. All in all, the biggest cleavage in citizens’ preferences about how to vote is generational, not ideological.
Introduction
Faced with the COVID-19 pandemic, some countries have adapted their electoral rules to allow voting by mail (e.g., France and Bavaria in March 2020). For the 2020 Presidential elections, many states in the United States modified their electoral rules to facilitate voting by mail. The only states where voters needed an absentee reason to vote by mail were Indiana, Louisiana, Missouri, South Carolina, Tennessee, and Texas. 1
Much of the existing research has focused on whether or not voting by mail reforms (as well as other convenience voting reforms, such as automatic registration, advanced voting, or internet voting) help increase turnout. In their extensive review, Gronke et al. (2008) report that earlier studies found no increase in turnout due to postal voting. This is mainly because postal voting does not appear to draw in new citizens or appeal to disempowered segments of the population (Berinsky et al., 2001; Karp & Banducci, 2000). This conclusion however, remains contested (see Barreto et al., 2006; Neeley & Richardson, 2001). A recent study on the subject found that universal vote-by-mail does not increase turnout (Thompson, 2020). However, still focused exclusively on aggregate-level data, Bonica et al. (2020) find that implementation of all-mail voting may result in a boost in turnout especially among lower-propensity voting groups such as younger voters. A parallel line of research has studied public support for voting reforms, including vote-by-mail (e.g., Alvarez et al., 2011; Burden et al., 2011), also during COVID-19 (Clinton et al., 2020).
The aim of this paper is not to study the impact of mail (or internet) voting on turnout or support for voting reforms. We deal with a simple though basic question, which is whether people would like to vote by mail or not. In a democracy, we should pay attention to people’s views about various policy issues but also about how elections should be conducted and how citizens should cast their ballot. Knowing how much voting by mail is liked may give us insights about its potential impact on turnout overall and among subgroups of the population.
This is the gap we intend to fill with this short paper. In particular, we examine four contending hypotheses about who likes to vote by mail: the first concerns age while the remaining ones are related to political interest, race, and ideology, respectively. We do so using original data we collected in February 2020 in the United States. Hence, our data collection took place before postal voting became a partisan issue and as such we are able to study what did people think before the topic became controversial and highly polarized (Montellaro, 2020; Wise & Corse, 2020). The survey question we rely on asks respondents if they prefer to cast a ballot at a polling station, over the internet or by mail. By including both internet and mail as alternative voting options to the polling station we aim to disentangle convenience (both alternatives are presumably more convenient than polling station voting) from novelty (internet is more novel than mail and polling station voting). 2
First, in line with existing research on attitudes toward electoral reform (e.g. Alvarez et al., 2011; Bowler & Donovan, 2018), mail voters should be younger since older people hold more firm attachments to traditional polling-place voting (Dalton, 2008). Yet, evidence on absentee voters shows that these are usually older (Barreto et al., 2006), in line with the claim that voting by mail is more convenient for those who find it harder to go to the polling station. Younger voters instead are generally expected to be more receptive to new opportunities offered by internet since these have been part of their political socialization (Jennings & Zeitner, 2003). Hence, we expect that age is positively related to preference to vote by mail, but it is negatively related to preferences to vote via internet.
In terms of political interest, individuals with low levels of political interest generally derive less utility from casting a ballot and therefore tend to abstain (Verba et al., 2000). Since interest and motivation play an important role in explaining turnout (Blais & Daoust, 2020), mail and internet voting decrease the costs of casting a ballot, which should compensate for the lower utility individuals with less interest in politics derive from participating in a political activity they do not care much about (Hodler et al., 2015). Hence, political interest should be positively related to voting at the polling station and negatively related to preference to vote by mail or internet.
Another hypothesis concerns race. We may predict that Latinos and African-Americans, because of their economic status (Kam et al., 2008), will find it easier to vote by mail, a method that allows them to avoid the need of getting time off work (see Southwell, 2010). Yet, it is also true that African Americans tend to be more inclined to cast their in-person ballots early, with many driven by the “getting your souls to the polls” mobilization efforts sponsored by religious organizations, and nonpartisan advocacy groups (Herron & Smith, 2012, 2014). The same hypothesis might not apply to internet voting though, since rates of internet penetration are usually slightly lower among non-White Americans households (Garcia-Castañon et al., 2011; Pew Research Center, 2019; Yoon et al., 2020). Hence, we expect that non- White Americans prefer to vote by mail rather than voting at the polling station; yet the same hypothesis does not apply to voting by internet. The last hypothesis concerns ideology. Conservatives generally oppose change and are more supportive of existing institutional arrangements (Jost et al., 2003). We thus expect conservative ideology to be associated with an attachment to traditional polling-place voting and opposition to novel voting options (i.e., mail and internet).
Data and Variables
We conducted two separate surveys in the United States between February 14 and February 23, 2020. The questionnaire and design are exactly the same for both studies. The two surveys were administered online, at the same time though independently, on quota samples representative of the US population by gender, age, level of education, and State. 3 For study 1, only voters in the 14 states that held a primary during Super Tuesday were able to participate. The sample size was 2,540 for study 1 and 2,664 for study 2. Given that the two surveys provide similar results we show aggregate patterns; the Supplemental Appendix shows the results of the two studies separately.
Respondents were asked “If you had the choice to cast your ballot at a polling station, over the internet, or by mail, which would you prefer?” Respondents had three answer options to choose from “voting at a polling station,” “voting on the internet,” and “voting by mail” (the order of these options was randomized). This constitutes the dependent variable of our study. Just slightly over 51% of the respondents in our survey said that they prefer to vote at a polling station, 29.3% on the internet and 19.5% by mail. The support that the internet voting option receives is remarkable given that no state currently allows to vote through the internet. 4
Age is measured in years; political interest is captured via a survey question asking respondents how interested they are in politics using a scale from 0 “not interested at all” to 10 “extremely interested.” Race is measured combining two survey questions. First, we asked respondents to choose one or more races among the following ones: White, Black or African American, American Indian or Alaska Native, Asian, Native Hawaiian or other Pacific Islander, or a residual “Other” category. The follow up question asked respondents whether they are Spanish, Hispanic or Latino. Out of these two questions we created a variable for race which takes on a value of 1 for White-Americans (70.8% in our sample), 2 for Asian (4.2%), 3 for Black or African-American (10.6%), 4 for Latinos (10.9%) and 5 a residual category (3.5%) including all those who chose other in the first question or identify with more than one race. To measure ideology we ask respondents to place themselves on a scale from 0 “extremely liberal” to 10 “extremely conservative.”
While we are primarily interested in the effect of age, political interest, race and ideology, we control for partisanship, education and gender since we know these are related to preferences to vote by mail. We measure partisanship using two survey questions asking respondents first whether they are Republican, Democrat or Independent and then to specify whether they feel very strong or not very strong Republican or Democrat. Hence, the partisanship variable ranges from 0 “strong Democrat” to 1 “strong Republican” with intermediate values being in order “not very strong Democrat,” “closer to Democratic party,” “Independent/not close to any party,” “closer to Republican party,” “not very strong Republican,” and “strong Republican.” Education is also a continuous variable from “less than 1st grade” to “doctorate” while gender is a dummy variable with a value of 1 for female respondents.
All our independent variables are rescaled to range from 0 to 1 (see Supplemental Appendix for descriptive statistics). We also add a dummy variable for whether our respondents were part of study 1 or study 2 and a dummy variable taking a value of 1 for respondents from Colorado, Oregon and Washington where elections are entirely by mail (albeit dropping these variables has no effects on our results—see Supplemental Appendix).
Results
Since our dependent variable has three unordered categories, we run multinomial logit models. While the full models are presented in the Supplemental Appendix, here we show the estimated probability of choosing each one of these types of voting to ease the interpretation of the results (see Figure 1). The first plot in Figure 1 shows that age is positively related to preference to vote by mail but negatively related to vote via internet. It is interesting to notice that very young respondents have an equally high probability of choosing to vote at the polling station or via internet but a very low probability of choosing to vote by mail. Strikingly differently, very old people have an almost equal probability of opting for voting by mail or at the polling station. Across all other ages, however, voting at the polling station remains the favorite option.
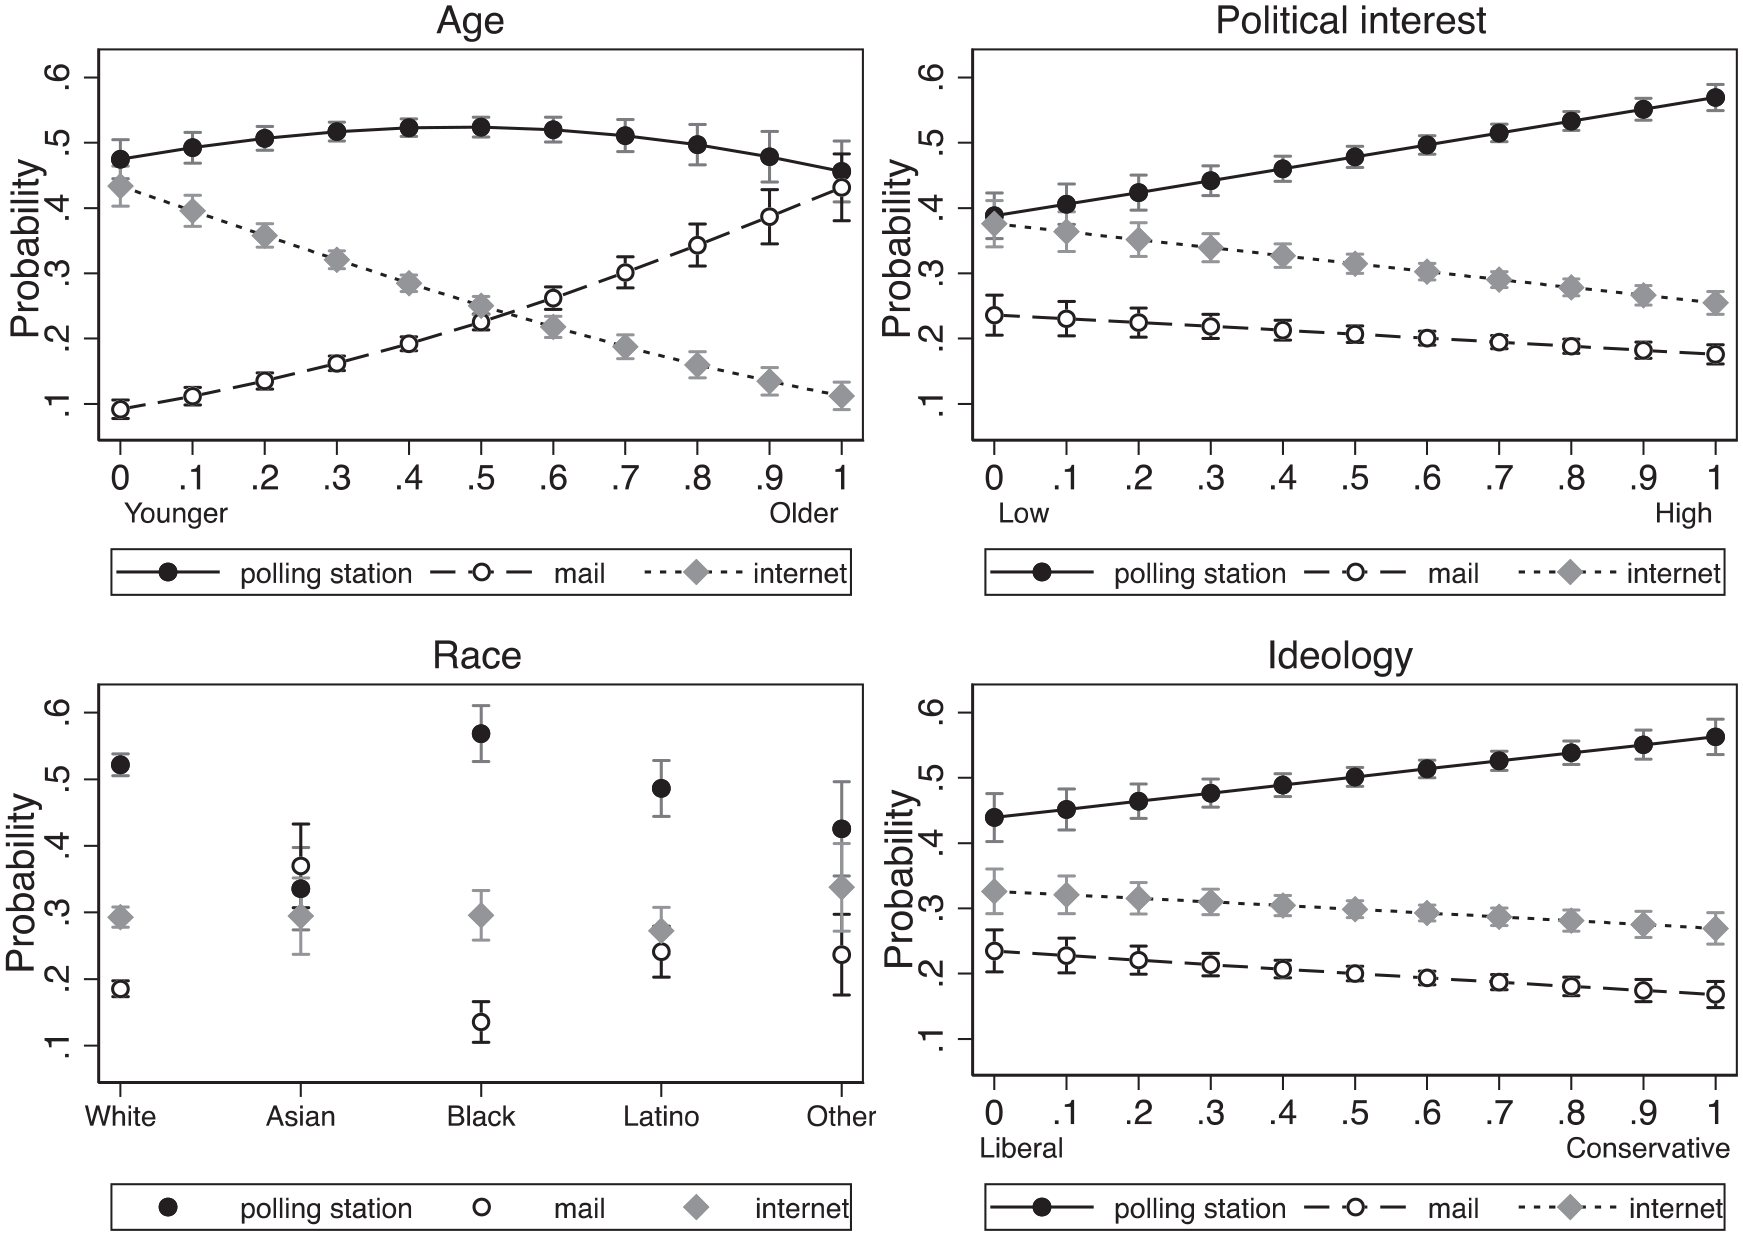
The effect of age, political interest, race and ideology on the probability of choosing voting methods.
Moving to political interest, we see from Figure 1 that interest is positively related to choosing voting at the polling station and negatively related to preference to vote by mail or internet. In terms of race, we find Black Americans to favor the polling station even more than White Americans compared to mail voting while Latinos but especially Asians are more likely to favor voting by mail and internet compared to White Americans. The finding for Black Americans suggest that they are attached to traditions such as the “Souls to the Polls” movement (Herron & Smith, 2012, 2014).
Lastly, when it comes to ideology, conservatives are more likely to prefer to vote at the polling station, but they dislike voting by mail even more than voting via the internet. The effect of ideology is slightly weaker when controlling also for party identification but it remains significant. Our results indicate that party identification matters, with Republicans more in favor of voting at the polling station than Democrats. Taken together, our data show that the person who likes mail voting the most is an older White-American with little interest in politics; and the person who likes voting by mail the least is a younger Black or Latino with high interest in politics (see Table 1). These results also indicate that the strongest cleavage is age, not ideology; while younger and older respondents equally like voting at the polling station, the former are not interested in the mail while the latter strongly dislike internet voting.
Predicted Probabilities of Choosing Each Voting Alternative.
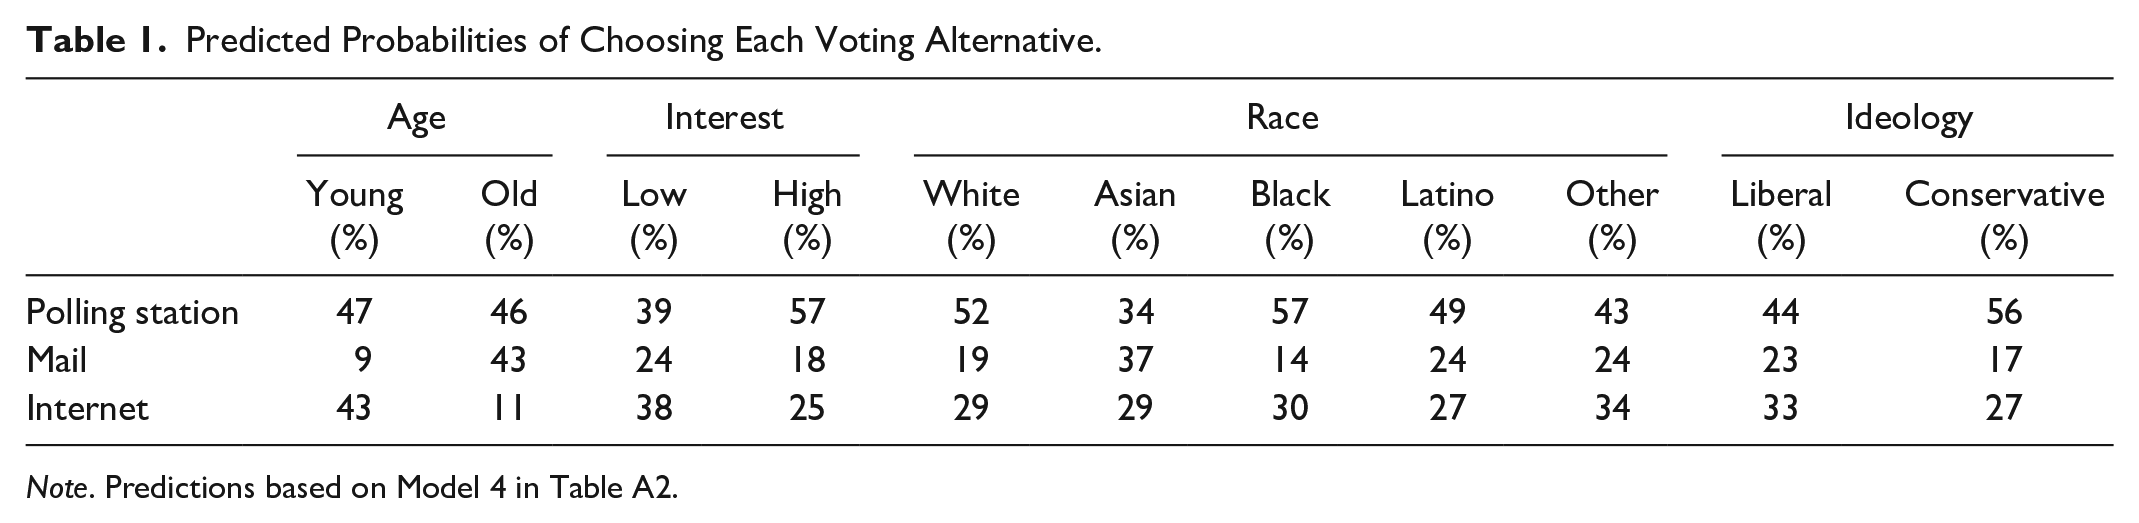
Note. Predictions based on Model 4 in Table A2.
We find a much higher support for voting by mail in the three states where elections are held entirely by mail. This suggests that individuals that vote by mail tend to like it more (albeit we cannot rule out reverse causation). Respondents in these states also show a slightly higher preference to vote via internet compared to the polling station.
Discussion
The aim of this paper was to examine how citizens prefer to cast their ballot. To disentangle convenience from novelty, we studied simultaneously whether people prefer voting by mail or via internet as alternatives to the more traditional voting at the polling station. We find age to matter the most in explaining preference for voting by mail with older voters being disproportionally more likely to prefer to vote by mail compared to younger voters, which in turn are much more likely to prefer to vote via internet and less likely to prefer voting by mail compared to their older counterparts. It is the most interested in politics who favor voting at the polling station while African Americans are even more likely than White Americans to favor the polling station over other alternatives. While a conservative ideology makes people more likely to favor voting at the polling station, ideology appears not to matter that much in distinguishing between those who prefer voting by mail over voting by internet.
As long as preference over voting alternatives gives us insights about the impact that voting alternatives may have on turnout, the story from this paper is that giving people the possibility to vote by mail may make voting easier for certain subgroups of the population like older citizens and those less interested in politics.
We expected African Americans to be more likely to choose to vote by mail but, if anything, they seem to prefer voting at the polling station at least as much as White Americans. Quite surprising is that the dislike for mail voting is generalized across ideology groups with every single age group being more likely to favor internet voting over voting by mail, albeit in line with existing studies conservatives and Republicans favor voting at the polling station more than liberals and Democrats (Bowler & Donovan, 2018). This is perhaps the kind of ideological division that elite cues could engage with in terms of alleged electoral fraud. The results of this study suggest, however, that the biggest cleavage about how people should/could vote is not ideological, it is generational.
Supplemental Material
sj-pdf-1-apr-10.1177_1532673X211005684 – Supplemental material for Who Likes to Vote by Mail?
Supplemental material, sj-pdf-1-apr-10.1177_1532673X211005684 for Who Likes to Vote by Mail? by Carolina Plescia, Semra Sevi and André Blais in American Politics Research
Footnotes
Acknowledgements
The authors would like to thank Shaun Bowler and Shane Singh for useful comments on previous versions of this paper.
Declaration of Conflicting Interests
The author(s) declared no potential conflicts of interest with respect to the research, authorship, and/or publication of this article.
Funding
The author(s) disclosed receipt of the following financial support for the research, authorship, and/or publication of this article: Data collection for this project was funded by New America through their ERRG initiative, with support from Arnold Ventures. The data themselves are available on request from the authors.
Supplemental Material
Supplemental material for this article is available online.
Notes
Author Biographies
References
Supplementary Material
Please find the following supplemental material available below.
For Open Access articles published under a Creative Commons License, all supplemental material carries the same license as the article it is associated with.
For non-Open Access articles published, all supplemental material carries a non-exclusive license, and permission requests for re-use of supplemental material or any part of supplemental material shall be sent directly to the copyright owner as specified in the copyright notice associated with the article.