
Abstract
Objective:
To explore the spatial distribution characteristics of the peak density of rodents and mosquitoes in the main urban area of Hefei, and analyze the spatial clustering.
Methods:
The survey data of the peak density of rodents and mosquitoes in the main urban area of Hefei in 2024 (May–June) was collected, and a thematic map of point pattern was drawn to analyze the spatial distribution characteristics using Ordinary Kriging interpolation and spatial autocorrelation.
Results:
The average density of rodents and mosquitoes in the main urban area during the peak density was 0.91% and 3.50 per/(light·night), respectively. The interpolation ranges of rodent and mosquito densities were 0.03–3.22% and 0.04–13.80 per/(light·night), respectively, which made the fluctuation range smaller and the density range narrower compared with the actual density range, but the distribution of the two were basically the same. The Moran’s I values of rodent and mosquito densities were 0.508 and 0.347, respectively (all Z > 0, all P < 0.010).
Conclusions:
The density of rodents and mosquitoes in the main urban area was generally at a low level, with obvious differences in spatial distribution characteristics, but presented a spatial pattern of high in the east and low in the west, high in the north and low in the south, with positive correlation clustering. More attention should be paid to the risk of hemorrhagic fever with renal syndrome, and other related infectious diseases in key areas and streets. Vector control measures with key points, key linkages and differentiation should be adopted.
Rodents and mosquitoes are common vector organisms that are closely related to humans, and also important vectors that can transmit a variety of infectious diseases, such as hemorrhagic fever with renal syndrome (HFRS), malaria, and dengue fever (Luo et al., 2022; Zhao et al., 2020). Changes in natural factors such as climate, ecological environment, and land use affect the population size and spatiotemporal distribution of vector organisms such as rodents and mosquitoes, which in turn affect the occurrence and prevalence of rodent and mosquito-borne infectious diseases (Liu, 2022; Luo et al., 2022; Sun et al., 2021). Therefore, vector surveillance is the core of risk assessment, early warning, prevention, and control of vector-borne diseases (Wang et al., 2022).
Traditional statistical methods (e.g., descriptive statistics, simple linear regression) often ignore the spatial autocorrelation of vector density data, leading to biased estimates of distribution patterns and potential misguidance for control strategies (Beale et al., 2010). In contrast, spatial statistical methods including Ordinary Kriging interpolation and spatial autocorrelation analysis offer unique advantages: Kriging interpolation converts discrete point data into continuous spatial surfaces independent of administrative boundaries, enabling intuitive visualization of high-risk zones (Zhou et al., 2021); spatial autocorrelation analysis quantifies the spatial dependence of vector densities, clarifying clustering patterns that traditional methods fail to detect (Luo et al., 2022). At present, spatial analysis has been gradually applied to the spatial distribution, hot spot detection, and aggregation analysis of disease vectors (Luo et al., 2022; Zhou et al., 2021; Jiang et al., 2018). This study utilized survey data from all streets in the main urban area of Hefei in 2024 during the peak density of rodents and mosquitoes (May–June), and used Ordinary Kriging interpolation and spatial autocorrelation to analyze the spatial distribution characteristics of rodent and mosquito densities and their spatial clustering on a street scale, so as to provide a reference for the timely adjustment and optimization of preventive and control measures as well as for the risk assessment, prediction and early warning, prevention and control of the related infectious diseases.
Materials and Methods
Study area characterization
The study was conducted in the main urban area of Hefei, the capital city of Anhui Province, China, covering 4 administrative districts (Yaohai District, Luyang District, Baohe District, Shushan District) and 65 streets. Hefei is located in the Yangtze River Delta region, with a subtropical monsoon climate (average annual temperature 15.7°C, annual precipitation 1000–1100 mm), providing suitable ecological conditions for rodents and mosquitoes. The main urban area is characterized by diverse land uses: old industrial zones (concentrated in the northeastern Yaohai District), dense residential areas, commercial districts, green spaces, and waterfront areas adjacent to Chaohu Lake (southeastern Baohe District). This regional diversity leads to heterogeneous vector habitats, making it a representative case for studying urban vector spatial distribution.
Sources of information
The data were derived from a field survey of rodents and mosquitoes covering 65 streets in 4 districts in the main urban area of Hefei. The survey was conducted in accordance with the requirements of the 2016 version of the “National Vector Surveillance Implementation Plan” and the “Hefei Vector Surveillance Plan” with habitats selected in each street, and surveillance points for the survey were selected and supplemented in accordance with the principle of randomness on the basis of the surveillance points at the national and provincial levels, to ensure that at least one survey point was selected for each habitat.
Survey and statistical methods
Rodent investigation
Each street selected two types of habitats, such as urban residential areas and specialized industrial zones. These habitats were selected because they typically provide abundant resources, sustain stable rodent populations, and are closely association with human activities, making them the main focus of urban rodent infestations. Specialized industrial zones were required to include at least two environmental types (catering, food production and sales, construction sites, farmers’ markets, supermarkets, grain depots, etc.). At each surveillance point, rodent traps (boards) were placed using the night snap-trap and the rat-sticking board method, and the traps were placed in the evening and collected in the morning. Traps were active only during the overnight period and were not continuously deployed throughout the study. The entire study site was surveyed over a 2-month period, with trap placement conducted sequentially across different streets and habitats to ensure consistent sampling effort. Indoors, 1 trap was placed per 15 m2 and for rooms exceeding 100 m2, traps were placed along the walls at 5- meter intervals. Residential areas focus mainly on the outside environment, while specialized industrial zones focus on primarily in the indoor environment, while taking into account to kitchens, warehouses, and other rooms. A minimum of 200 effective traps (boards) were placed in each habitat. Approximately 50 traps (boards) were deployed per block.
Rodent density was calculated at two spatial scales:
Habitat scale: total number of rodents captured in each habitat type divided by the total number of effective traps (boards) deployed in that habitat type.
Street scale: total number of rodents captured in each street divided by the total number of effective traps (boards) deployed in that street.
Rodent density (%) = 100% × total number of rodents caught/total number of effective traps (boards). Spatial autocorrelation analyses were conducted using rodent density at the street scale.
A total of 28,395 rodent traps were deployed across all surveillance points, with 26,784 effective traps recorded. A total of 244 rodents were captured, including 118 Rattus norvegicus, 107 Mus musculus, and 19 Rattus tanezumi.
Adult mosquito investigation
Each street selected three types of habitats, such as residential areas, parks, and hospitals. The habitats selected for mosquitoe surveillance differed from those for rodent surveillance as mosquitoes rely on stagnant water for breeding, and parks (with greenery and water bodies) and hospitals (with frequent human activity and potential water accumulation) are key breeding and foraging sites. At each surveillance point, one mosquito light trap was deployed using the light trap method, with the light source positioned 1.5 m above the ground, and the operating time was from 1 h before sunset to 1 h after sunrise the next day.
Mosquito density was calculated as: Mosquito density [per/(light·night)] = the number of female mosquitoes captured (per)/[the number of lights placed (light)·the number of induced mosquito nights (night)].
A total of 203 mosquito light traps were deployed, capturing 710 female mosquitoes. The species composition included 652 Culex pipiens pallens/quinquefasciatus, 19 Aedes albopictus, and 39 Anopheles sinensis.
Analysis methods
Construct a spatial vector database
Establish the geographic data of street-level administrative boundaries in the main urban area of Hefei, import the coordinate information of rodent and mosquito surveillance points obtained on site through QGIS 3.34.8 software, and establish a GIS database of rodent and mosquito densities at the survey points. Then survey data will be aggregated to the street level, matched, and associated with the above street-level administrative boundary geographic data through the common field (street code) to establish the GIS database of rodent and mosquito density at the street scale. Map review number: Anhui He S(2023)21. All the layers used “EPSG: 4326-WGS 84” geographical coordinate system and “EPSG: 3857-WGS 84/Pseudo-Mercator” projection coordinate system.
Spatial autocorrelation analysis
Spatial autocorrelation analysis includes global spatial autocorrelation (GSA) and local spatial autocorrelation (LSA). Spatial neighbors were defined using the Queen contiguity criterion, in which spatial units were regarded as neighbors if they shared a common edge or vertex. The GSA statistic Moran’s I was used to measure whether rodent and mosquito densities were clustered in the whole space of the main urban area and the size of clustering, with the value ranging from −1 to 1. When the value of Moran’s I > 0, it means that there was a positive spatial correlation, and the larger the value, the stronger the correlation; when the value of Moran’s I <0, it means that there was a negative spatial correlation, and the smaller the value, the larger the spatial variability; when Moran’s I = 0, it means that there was no spatial clustering, and the distribution was random. The significance test of Moran’s I value was performed using the standardized statistic Z-test and P-value. LSA was visualized using LSA cluster maps to clarify the spatial clustering patterns and clustered areas of rodent and mosquito densities at the street scale. Specifically, LSA provided information on block-level clusters, where the four spatial correlation patterns refer to: (1) “high–high”: a street with high vector density surrounded by streets with high density; (2) “low–low”: a street with low vector density surrounded by streets with low density; (3) “low–high”: a street with low density surrounded by streets with high density; (4) “high–low”: a street with high density surrounded by streets with low density (Luo et al., 2022; Peng et al., 2022).
Ordinary kriging interpolation
Ordinary Kriging Interpolation is the most common Kriging interpolation technique. It makes use of the structural characteristics of the original data and semivariogram functions, and conducts optimal linear unbiased estimation of the unknown points in the region by studying the attribute values of the regionalized variables of the known sample points in the region, and converts the “point” data into the “surface” data with continuous spatial distribution, so as to achieve the description and prediction of the spatial distribution characteristics of the regionalized variables (Liu et al., 2020; Wang et al., 2024). Before interpolation, the outliers in the original data, the normality test, and the spatial correlation analysis were removed successively. During the interpolation, four semivariogram function models such as “exponential model,” “spherical model,” “Gaussian model,” and “linear model” were used to fit the rodent and mosquito densities, and the function model with the highest accuracy was screened out by continuously adjusting the parameters and cross-validatiion, and the raster image of the planar spatial distribution was finally generated. Root mean square error (RMSE) and mean error (ME) were used as the accuracy evaluation indexes, and RMSE was mainly compared during the evaluation, with the smaller the value, the higher the accuracy; when RMSE was equal, the smaller the ME, the higher the accuracy (Wang and Wang, 2021).
Statistical analysis
Data were collated and analyzed using Excel 2019 and SPSS 16.0. Differences in rates or composition ratios between groups were tested using the chi-square test or Fisher’s test. Spatial vector maps and raster images were visualized, and ordinary Kriging interpolation was conducted using the “Smart-Map” plugin in QGIS 3.34.8 (Pereira et al., 2022). Spatial autocorrelation analyses of street-scale rodent and mosquito densities were performed using GeoDa 1.18.0. Significance level (α) = 0.05.
Results
Point spatial patterns analysis
Density distribution of surveillance points. The rodent density of 262 rodent surveillance points in 65 streets ranged from 0 to 11.43%, with an average of 0.91%. The rodent density in three density intervals of “0,” “0 to average density,” and “>average density” constituted 35.50% (93/262), 18.32% (48/262), and 46.18% (121/262) of the survey sites, respectively. The survey points with > 0.91% (average density) were mainly located in the southwest and northeast of the main urban area. The average mosquito density of the 203 mosquito surveillance points established was 3.50 per/(light·night), ranging from 0 to 22.00 per/(light·night). The composition rate of surveillance points with mosquito density located in the three density intervals was 19.21% (39/203), 46.31% (94/203), and 34.48% (70/203) in that order. The surveillance points with >3.50 per/(light·night) were mainly located in the main urban area near the northeast and the southeast. The frequency distribution of rodent density intervals across the three categories in the four main urban districts was statistically significant (χ2 = 44.019, P < 0.010), whereas no significant difference was observed for mosquito density intervals (χ2 = 84.283, P = 0.092). See Figure 1.
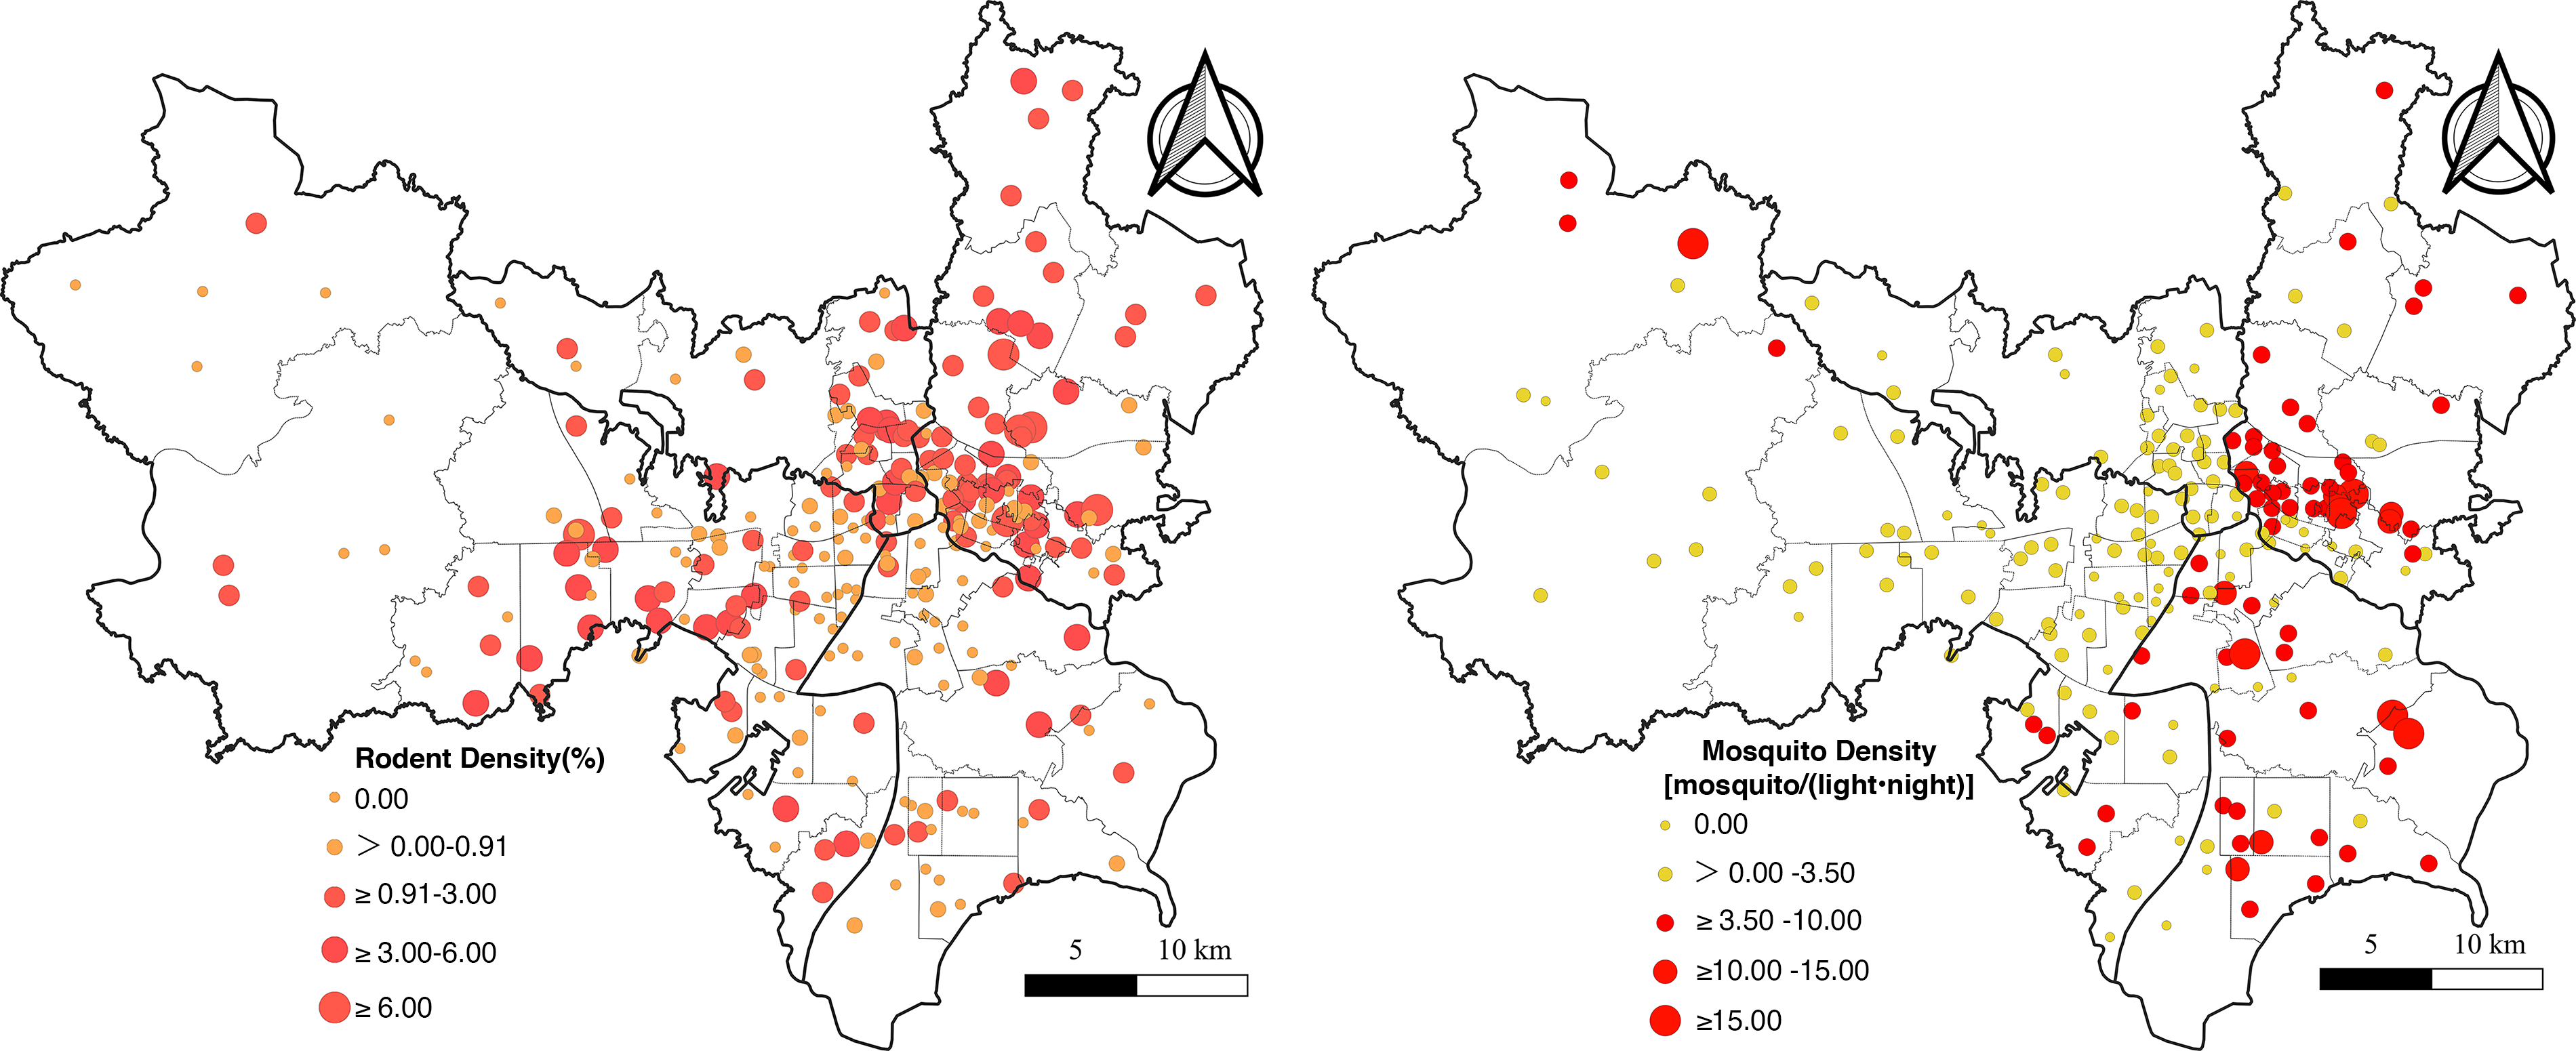
The Spatial Point Distribution Pattern of Rodent and Mosquito Densities in the Main Urban Area of Hefei. In the figure, the origin represents the specific geographical location of each monitoring point and the corresponding density of rodent or mosquito. The larger the origin, the higher the density. The red origins indicated that the density of rodent or mosquito was higher than the average density.
Ordinary kriging interpolation estimation
Ordinary Kriging interpolation was performed separately for rodent and mosquito densities in the point pattern. After cross-validation comparisons, it was finally determined that the optimal semivariogram models for rodent and mosquito densities were both Gaussian models. The determination coefficients (R2) of the models were 0.799 and 0.856, respectively, indicating a good model fit. The RMSE values of the interpolated models of rodent and mosquito densities were 0.237 and 0.279, respectively, indicating a decent fit. The fitted values of rodent density ranged from 0.03% to 3.22%. The area with high rodent density was distributed in the northeast and southwest of the main urban area, including the whole Yaohai District, the adjacent areas of Luyang District and Baohe District, and a small part of Shushan District, with a focus on four streets in Yaohai District. The fitted values of mosquito density ranged from 0.04 per/(light·night) to 13.80 per/(light·night), and the areas with high mosquito density were relatively small, mainly distributed in the border areas between Yaohai District and Baohe District in the eastern part of the main urban area and Baohe District near the surface of the Chaohu Lake area in the southeast of the main urban area, with a focus on four streets in Yaohai District and two streets in Baohe District. See Figure 2.
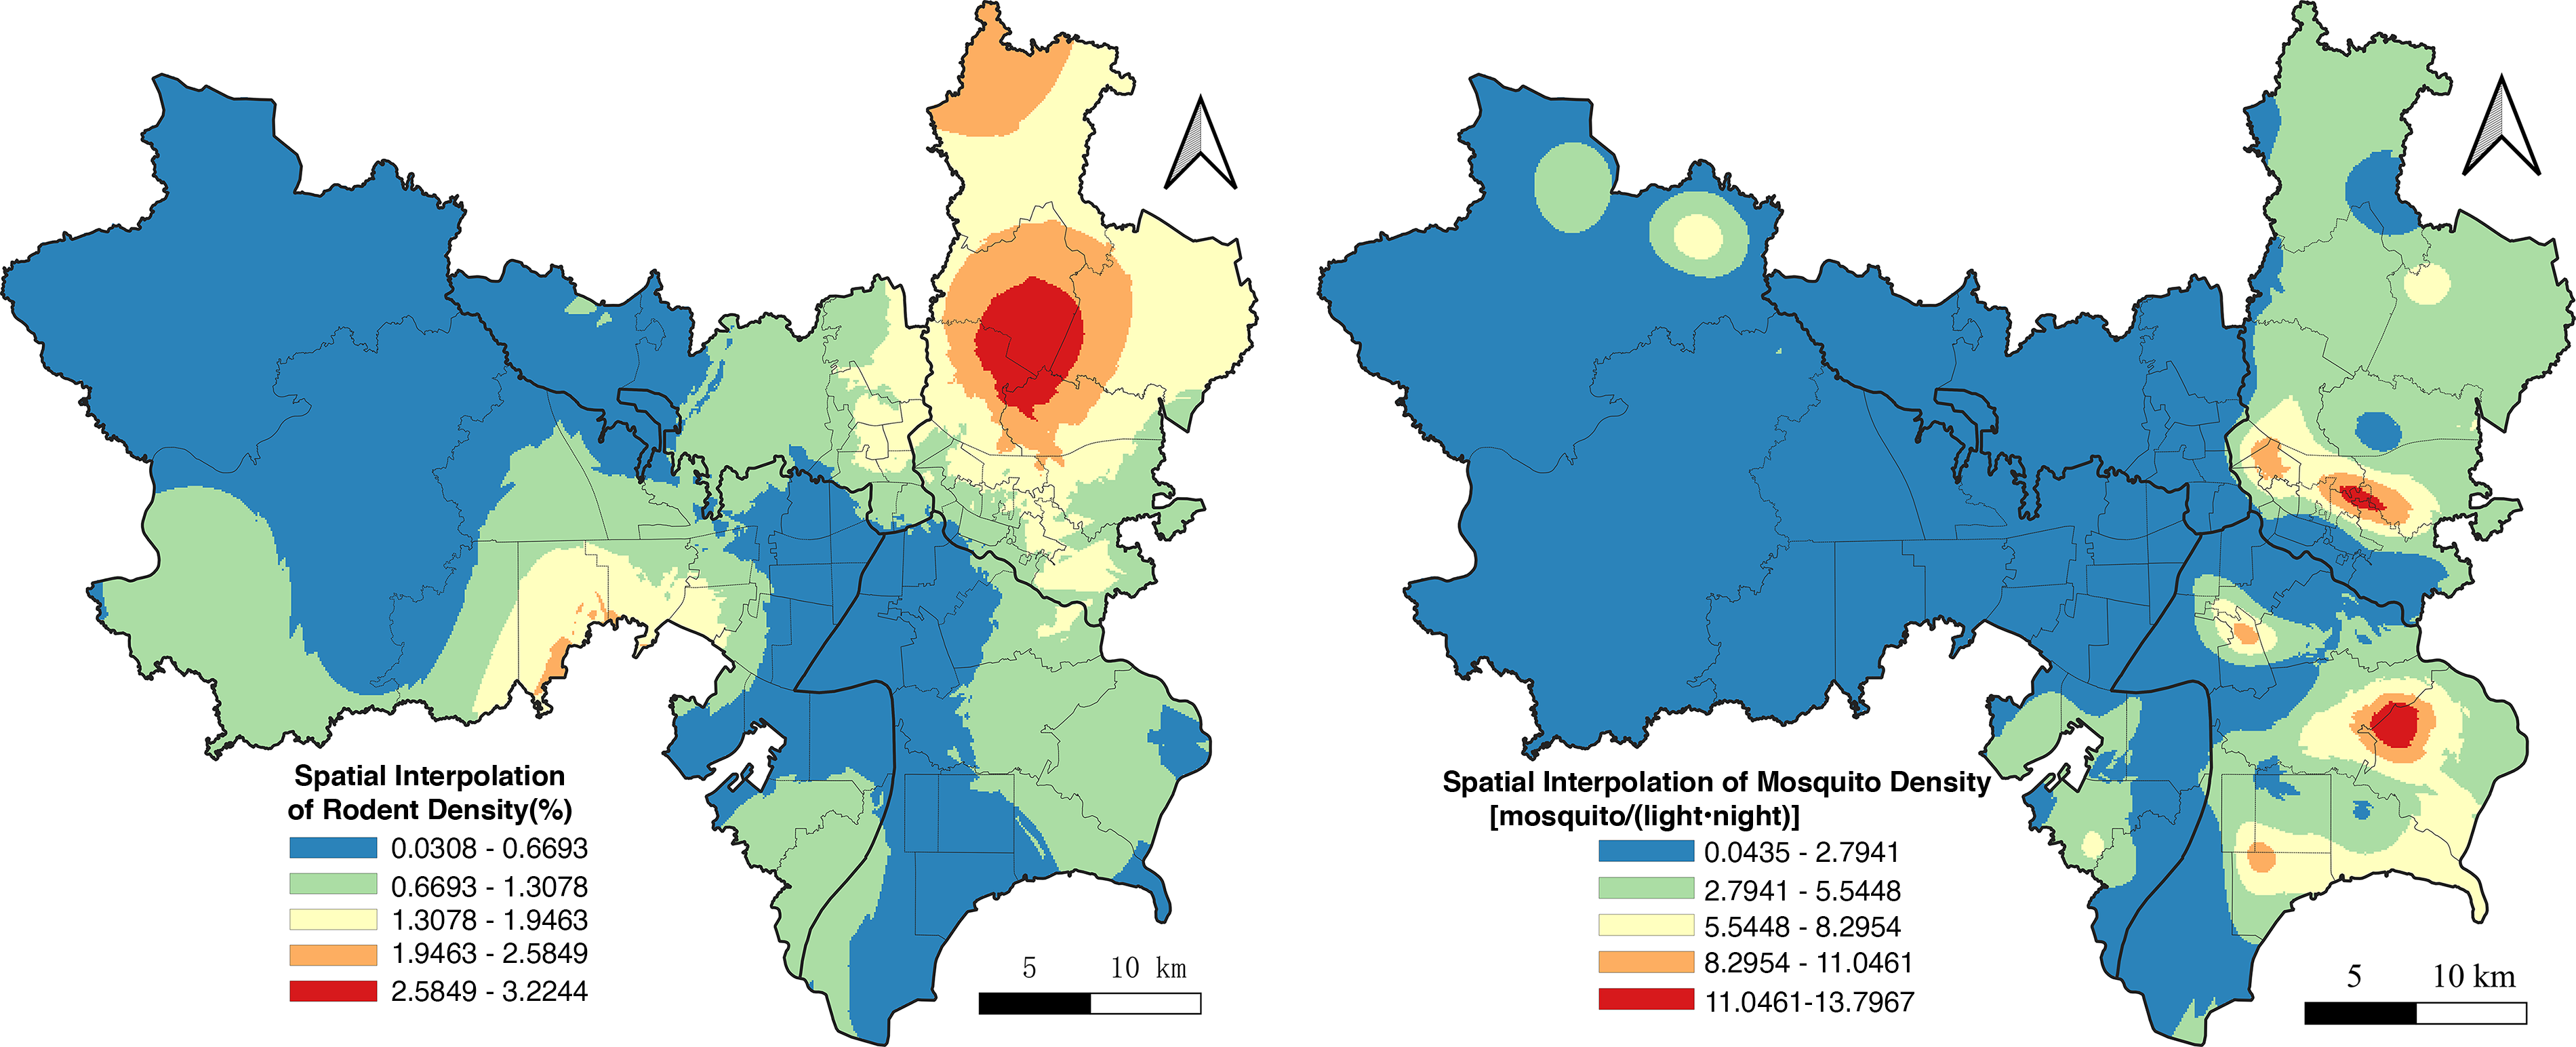
Ordinary Kriging Interpolation Estimation of Rodent and Mosquito Densities in the Main Urban Area of Hefei.
Spatial autocorrelation analysis
Global spatial autocorrelation analysis
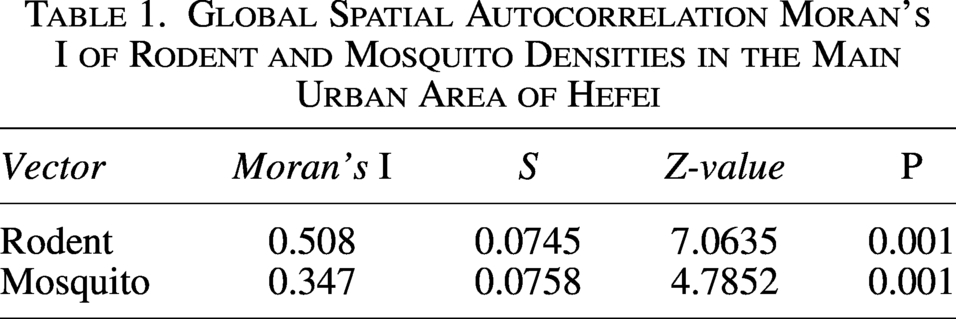
The rodent density of 65 streets in the main urban area ranged from 0% to 2.91%. The composition rate of streets with rodent density in the three density intervals of “0”, “0 to average density”, and “>average density” was 3.08% (2/65), 50.77% (33/65), and 46.15% (30/65), respectively. Mosquito density ranged from 0 to 15.67 per/(light·night), and the composition rate of streets with mosquito density in the three density intervals was 3.08% (2/65), 50.77% (39/65), and 36.92% (24/65), in that order. At the street scale, there were statistically significant differences in the composition of rodent (χ2Fisher’s exact test = 16.490, P = 0.003) and mosquito (χ2Fisher’s exact test = 27.275, P < 0.001) densities in the three density intervals (both P < 0.010). The GSA analysis showed that the clustering of rodent density at the street scale was higher than that of mosquito density. The values of Moran’s I were 0.508 and 0.347, respectively, with both Z > 0, and both were statistically significant (both P < 0.010). Rodent and mosquito densities in the main urban area all showed positive correlation clustering. See Table 1.
Global Spatial Autocorrelation Moran’s I of Rodent and Mosquito Densities in the Main Urban Area of Hefei
Local spatial autocorrelation analysis
LSA analysis showed that there were spatial clustering phenomena in the main urban area, with sporadic existence of “high-low” and “low-high” clustering areas for rodents and mosquitoes, and a total of 24 streets were identified as covered by “low-low” clustering areas (of which 4 were overlapped) and 17 streets were identified as covered by “high-high” clustering areas (of which 3 were overlapped). Among them, rodent “high-high” clustering areas included 9 streets in Yaohai District and 2 streets in Luyang District; “low-low” clustering areas covered 6 streets in Shushan District and 3 streets in Baohe District. Mosquito “high-high” clustering areas covered 5 streets in Yaohai District and 1 street in Baohe District; “low-low” clustering areas covered 10 streets in Shushan District and 5 streets in Luyang District. See Figure 3.
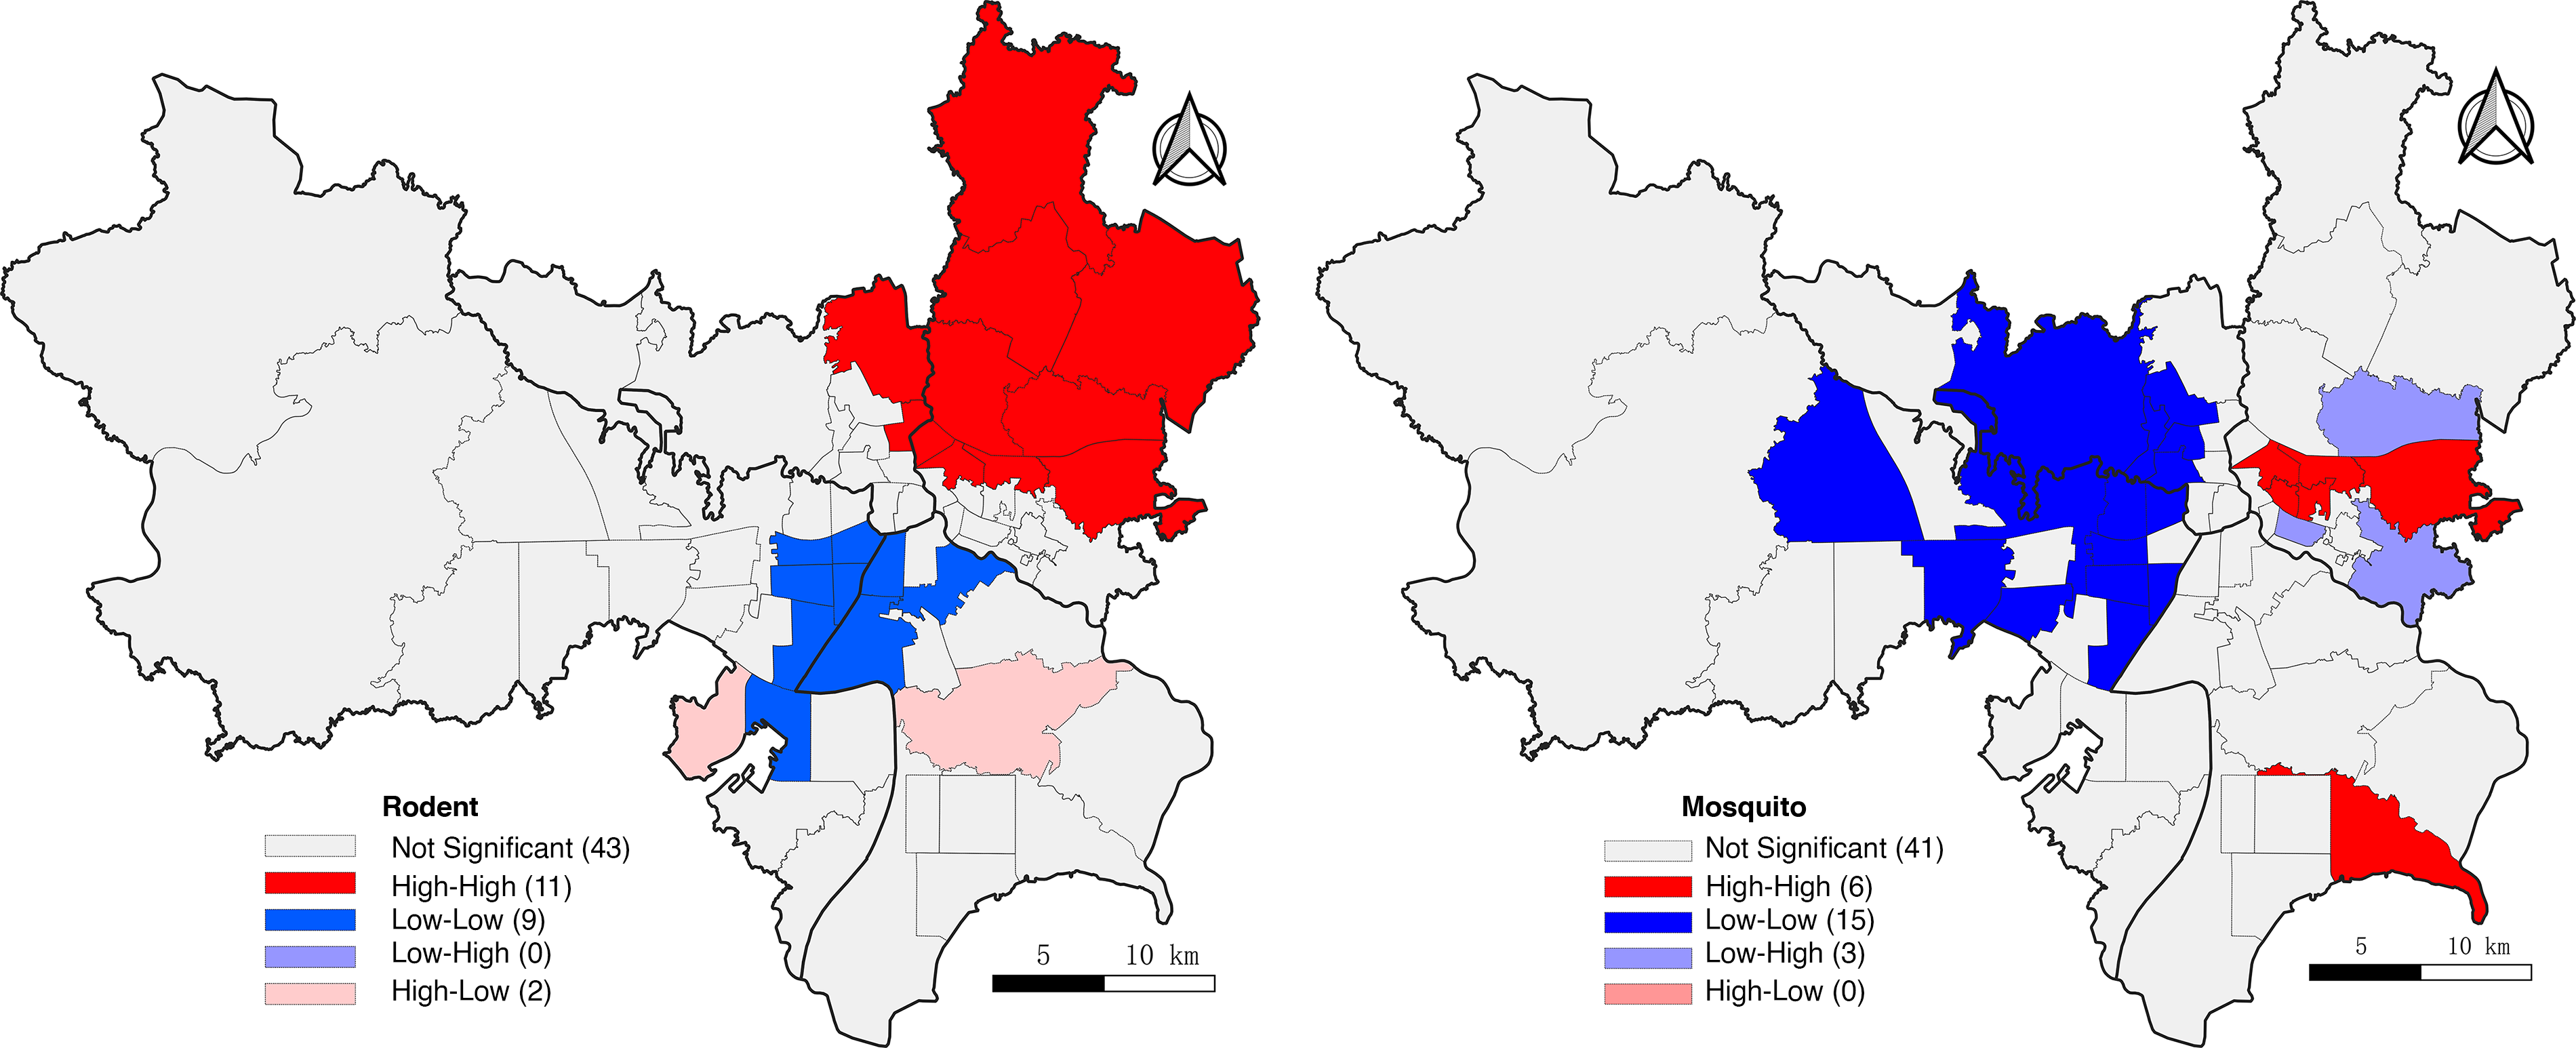
Local Spatial Autocorrelation Analysis of Rodent and Mosquito Densities at the Street Scale in the Main Urban Area of Hefei.
Discussion
The survey was conducted during the peak density periods of rodents and mosquitoes, respectively (Wang et al., 2023), by taking establishing surveillance points and adopting a unified sampling method, avoiding limitations such as the limited number of surveillance points set up in the past and the relatively insufficient coverage (Liu, 2018), so that the survey results were more representative and reflected more accurately the highest density of rodents and mosquitoes in the main urban area. According to the survey results, the density of rodents and mosquitoes at surveillance points exhibited a wide range of fluctuations during the peak density. The average density of rodents and mosquitoes during the peak in the main urban area was 0.91% and 3.50 per/(light·night), respectively. Rodent density was slightly higher than 0.77% recorded in the same period of 2022, and mosquito density was significantly lower than 8.72 per/(light·night) in the same period of 2022 (Wang et al., 2023). The results indicated the unevenness of the spatial distribution of rodents and mosquitoes during the peak density in the main urban area, but overall at a low level, which demonstrated the effectiveness of the long-term vector biological control work in the main urban area and suggested that the focus should be highlighted in the integrated management and vector control.
Ordinary Kriging interpolation converts known sample point data within a study area into a spatially continuous distribution of predicted surface, which has the advantage of being independent of administrative boundaries (Peng et al., 2022; Yin et al., 2020). In this study, Ordinary Kriging interpolation was fitted to rodent and mosquito densities in the main urban area of Hefei; the determination coefficients (R2) of the rodent and mosquito density models were 0.799 and 0.856 in order after cross-validation, and the corresponding RMSE values were 0.237 and 0.279, respectively. Based on a comprehensive judgement, the predictive performance of Ordinary Kriging interpolation for rodent was superior to that of mosquito. The fitted values of rodent and mosquito densities obtained ranged from 0.03% to 3.22% and from 0.04 per/(light·night) to 13.80 per/(light·night) in order, which made the fluctuation range smaller and the density range narrower compared with the actual rodent density (0 − 11.43%) and mosquito density (0–22.00 per/[light·night]) at surveillance points. This was consistent with the findings that the range of fitted values obtained by interpolation is narrower than the original values studied by Peng Zhenren and Yin Zhe (Peng et al., 2022; Yin et al., 2020). It may be due to the uneven distribution of surveillance points or lower density of rodents and mosquitoes in the main urban area, which may lead to large estimation error, while Ordinary Kriging interpolation smoothed out some meaningful anomalous bands in order to reduce the estimation variance and to achieve the smoothing effect when smoothly processing discrete actual survey data (Peng et al., 2022; Yin et al., 2020). It is also suggested that it was necessary to combine the variable range parameter in the semivariogram, and 1/4–1/2 of the variable range was usually chosen as the optimal distance when optimizing the deployment of surveillance points in order to reduce the impacts arising from the low density of surveillance points and/or the uneven distribution of surveillance points (Ge et al., 2016). The interpolated distribution map generated in this study intuitively showed that the density of rodents and mosquitoes in the main urban area had a significant difference in the spatial distribution characteristics, and the overall presentation of the spatial pattern of high in the east and low in the west, high in the north and low in the south. The distribution of the fitted values was basically consistent with the density distribution of actual survey points. This preliminarily demonstrated the key areas of rodent and mosquito control and related infectious diseases and provided a basis for appropriate adjustment and improvement of prevention and control measures. At the same time, considering that the rodent density for effective control of the incidence of HFRS should be controlled at about 1% (threshold) (Luo et al., 2022), the risk of HFRS needs to be concerned in the northeastern and southwestern areas of the main urban area.
This study found that there were statistically significant differences in the composition of rodent (χ2 = 16.490, P = 0.003) and mosquito (χ2 = 27.275, P < 0.001) densities in three density intervals at the street scale (both P < 0.010), suggesting that measures such as zoning and classification guidance should be implemented when implementing sustainable control strategies. Spatial autocorrelation analyses of rodent and mosquito densities at the street scale were conducted to clarify the degree of relevance between a given street and its adjacent streets in clustering patterns (Ge et al., 2016). The GSA results showed that Moran’s I values of rodent and mosquito densities at the street scale in the main urban area were 0.508 and 0.347 in order (all Z > 0, all P < 0.010), indicating that both rodent density and mosquito density at the street scale were positively correlated clustering distributions, while the “high-high” and “low-low” clustering areas detected by the LSA analysis indicate that the density of a street and adjacent streets were both high/low values (Song et al., 2020). The study found that the distribution areas of ‘high-high’ and “low-low” clustering areas for rodent and mosquito densities overlapped in the Ordinary Kriging interpolation distribution. The “high-high” clustering areas of rodents were generally consistent with their spatial distribution characteristics, with 11 streets involved in the “high-high” clustering areas were distributed in the northeastern part of the main urban area. This finding is consistent with similar studies in other industrial cities, where old industrial zones with concentrated population and incomplete infrastructure tend to have high rodent densities (Wang et al., 2025). One part of the “high-high” clustering areas of mosquito density was located within the “high-high” clustering areas of rodent density, covering 5 streets in Yaohai District in the eastern part of the main urban area. The environmental characteristics of this overlap zone include high population density (≈10,000 people/km2), dense catering establishments (average 4.2 per block), inadequate garbage classification, and scattered stagnant water (e.g., unclosed sewers, outdoor water storage)—factors that provide both food/shelter for rodents and breeding sites for mosquitoes. This overlap only occurs in these five streets because they are located in the core of the old industrial zone, where urban renewal has been incomplete and infrastructure (e.g., sewage systems, garbage disposal) is outdated compared to other areas. The other part covered the streets belonging to the Baohe District in the southeastern part of the main urban area, which is consistent with studies in Hangzhou (coastal cities with large water bodies), where lakeside green spaces with abundant vegetation and stagnant water support high mosquito densities (Jin et al., 2023). For the sporadic “low–high” and “high–low” clustering patterns, these areas are likely transitional zones between high- and low-density regions. For example, “low–high” clusters (low vector density surrounded by high-density streets) were mainly distributed at the edge of old industrial zones, where urban renewal has improved infrastructure (e.g., sealed sewers, regular garbage collection), but adjacent areas still retain favorable vector habitats. These transitional zones may act as “buffer areas” that limit the spread of high vector densities, highlighting the importance of targeted control in these regions to prevent further expansion.
Long-term vector control measures implemented in Hefei’s main urban area include annual spring and autumn bromadiolone application, monthly mosquito larvicide treatment in public water bodies, garbage classification promotion, and infrastructure renovation (e.g., sewer sealing, green space management) (Wang et al., 2023). The generally low vector densities observed in this study reflect the effectiveness of these measures; based on the dominant vector species identified, targeted integrated control management recommendations are proposed: for rodents (R. norvegicus and R. tanezumi), priority measures include improving environmental sanitation, sealing building gaps (key shelter sites for R. tanezumi), enhancing garbage disposal to reduce food resources, and regularly cleaning and disinfecting sewer systems (the main habitat for R. norvegicus). Rodenticide application may be used as a supplementary control measure, particularly in special industries, especially catering establishments and farmers’ markets, while for mosquitoes (C. pipiens pallens/quinquefasciatus, A. albopictus, A. sinensis), we recommend community-based source reduction (e.g., removing stagnant water in flower pots, tires) for container-breeding Aedes albopictus, improving sewage treatment for C. pipiens pallens/quinquefasciatus (breeding in sewage), and implement larvicide treatment in Chaohu Lake shoreline areas and use mosquito nets in hospitals for A. sinensis (breeding in lakeside wetlands).
Conclusions
Ordinary Kriging interpolation and spatial autocorrelation may correct to some extent the possible bias of traditional statistical methods in analyzing rodent and mosquito survey data with spatial attributes. In 2024, the density of rodents and mosquitoes in the main urban area of Hefei during the peak was generally at a low level, with obvious differences in spatial distribution characteristics but showing a spatial pattern of high in the east and low in the west, high in the north and low in the south, with positive correlation clustering. By detecting key areas and key streets at risk of HFRS and other related infectious diseases, timely focused, key-linked, and differentiated control measures should be taken to reduce rodent and mosquito densities so as to minimize the risk of related infectious diseases. Although this was a simple combination, it provides technical support for the subsequent research in spatio-temporal trends, etc., so as to more accurately control the risk of the occurrence of related infectious diseases.
Footnotes
Author Disclosure Statement
No competing financial interests exist.
Funding Information
This work was supported by the Hefei Municipal Health Science and Technology Project (2025) (Project No. Hwk2025zd024).