
Abstract
With rising environmental awareness, and financial rewards, recycled fibres are increasingly being employed in non-woven fabrics, composites, and regenerated fibres. This study investigated the use of recycled fibers with virgin cotton in rotor spinning to produce sustainable yarns. Although pre-consumer and spinning process waste have been studied, limited research has been undertaken on the use of statistical methodologies such as one-way ANOVA and Analytic Hierarchy Process (AHP) to identify the optimum blending ratios based on yarn performance. The study presented a novel technique for optimizing these ratios that included ANOVA, AHP, and cost analysis. In this study, five samples of 84 tex rotor yarn were produced by blending virgin cotton (30%) and flat strips (20%) with variable quantities of comber noil, pre-consumer waste, and hard waste in three different combinations for each. Yarn quality characteristics were assessed, including mass variation, imperfection index, hairiness, tenacity, elongation, and Total Quality Index. Samples D (30:15:20: 15:20) and E (30:10:30: 10:20), made of Virgin Cotton, Comber Noil, Hard Waste, Pre-Consumer Waste, and Flat Strips, had better yarn quality than the other blends. ANOVA (p < 0.05) revealed substantial changes in yarn quality among blend ratios, whereas AHP ranked samples by important characteristics. The results showed that Sample E exhibited good yarn qualities, which were consistent with both statistical validation and expert opinion. Furthermore, the study emphasized the economic feasibility of appropriate blending, emphasizing attainable raw material savings, minimizing waste, and encouraging sustainability in spinning mills.
Keywords
Introduction
Rotor spinning presents numerous advantages in terms of personnel efficiency, floor space utilization, and production rate. Specifically regarding spinning waste, rotor spinning provides several notable benefits Rotor spinning aids efficiency, space usage, and productivity, notably for waste management.1–3 Textile waste is defined as abandoned or undesirable materials produced during the manufacture and usage of fibers, textiles, and apparel. It falls into one of three categories: industrial textile waste, post-consumer textile waste, or pre-consumer textile waste. 4 Pre-consumer textile waste, often known as ‘clean waste’, is produced during the manufacturing of fibrous materials. For example, fabric cut clips. 6 Household textiles and abandoned clothing that have outlived their useful lives are considered post-consumer waste. Used clothes, towels, bed linens, and other textiles are typical examples. Industrial waste, also known as ‘dirty waste’, comes from commercial textile uses.5,6 On the other hand, a number of processes are involved in the manufacturing of yarn from the blowroom to the winding section, which leads to the generation of numerous waste types. Hard waste and soft waste are the two categories into which these wastes belong. Waste in the fibrous state, originating from the blowroom to speed frame and some wastage from ring frame section, is referred to as soft waste. The majority of this waste is recycled, and denim is frequently made from it. Hard waste is produced mostly in the winding and, to a lesser extent, in the ring frame sections of spinning. Hard trash is not recyclable in its original form. This kind of waste cannot be utilized directly as an input to make yarn. It needs to be opened up by a mechanical shredding machine before it can be used again. Various phases of the yarn-making process are the source of different kinds of soft and hard waste. Droppings 2 and 1 occur in the blow room and on the carding machine. The processing of materials results in the generation of roving and sliver waste. The ring frame machine generates bonda and pneumatic, while the comber machine produces comber noil. In spinning mills, hard waste is mostly produced in the winding area. 6 Globally, around 75% of textile waste is disposed of in landfills, 25% is reused or recycled, and less than 1% can be turned into clothes. 4 The apparel industry has an environmental impact throughout its lifecycle, from fiber production to disposal. The main issues are human toxicity, resource use, ozone depletion, and climate change. Sustainable production necessitates a holistic approach that prioritizes cost-effectiveness, zero waste, and environmental efficiency over isolated improvements. 7 The textile industry is focusing on waste management in an effort to advance sustainability and the circular economy. This economy promotes waste reduction, material reuse, and resource efficiency, contributing to environmental, social, and economic sustainability. On the other hand, the circular economy also concentrates on reducing waste and optimizing resource efficiency within economic systems, each of which adopts a different strategy to contribute to a sustainable future. 3 There are different types of waste disposal procedure such as landfilling, Incineration, reuse and recycling. Landfilling is a way of disposing of waste that involves burying it underground. However, it results in economic loss and pollution. Synthetic materials are difficult to disintegrate, whereas natural textile waste decomposes into CH4 and CO2. Incineration is another waste disposal technology that reduces the volume of textile waste by burning it at high temperatures. Although it reduces the amount of waste that ends up in landfills, if it is not managed properly, it can release dangerous compounds and damaging emissions like CO2. Textile reuse and recycling can help to reduce the requirement for virgin fibre manufacturing while also decreasing downstream processes. Textiles are reused when they are passed from one owner to another, whereas recycling is the reprocessing of textile waste to create new items. Economic incentives are essential to the viability of recycling and reuse. An inventive technique to reduce the influence on the environment is to use sustainable blended materials made from recycled fibers.4,7 The process of recycling fibre involves three primary steps: mechanical, chemical, and biological. The machinery utilized affects mechanical recycling differently. In chemical processes, leftovers are depolymerized into monomer units to create new materials such as polyester. In biological processes involved in textile recycling, enzymes act as biocatalysts to facilitate the safe and effective breakdown of polymers. 4 Blending virgin cotton with spinning waste and pre-consumer waste in optimal ratios promotes sustainability and circular economy by reducing dependency on virgin fibres, limiting resource use, and reducing environmental effect. This strategy balances yarn quality, cost-effectiveness, and environmental responsibility while diverting waste from landfills, lowering greenhouse gas emissions, and promoting circular economy practices in textile manufacturing. Beyond yarn manufacture, recycled fibers have a wide range of applications, including non-woven fabric manufacturing, regenerated fiber production, carpets (such as felts for carpet underlays), and agricultural applications such as covering webs and seed carrier webs).8,9
Summary of previous research works.
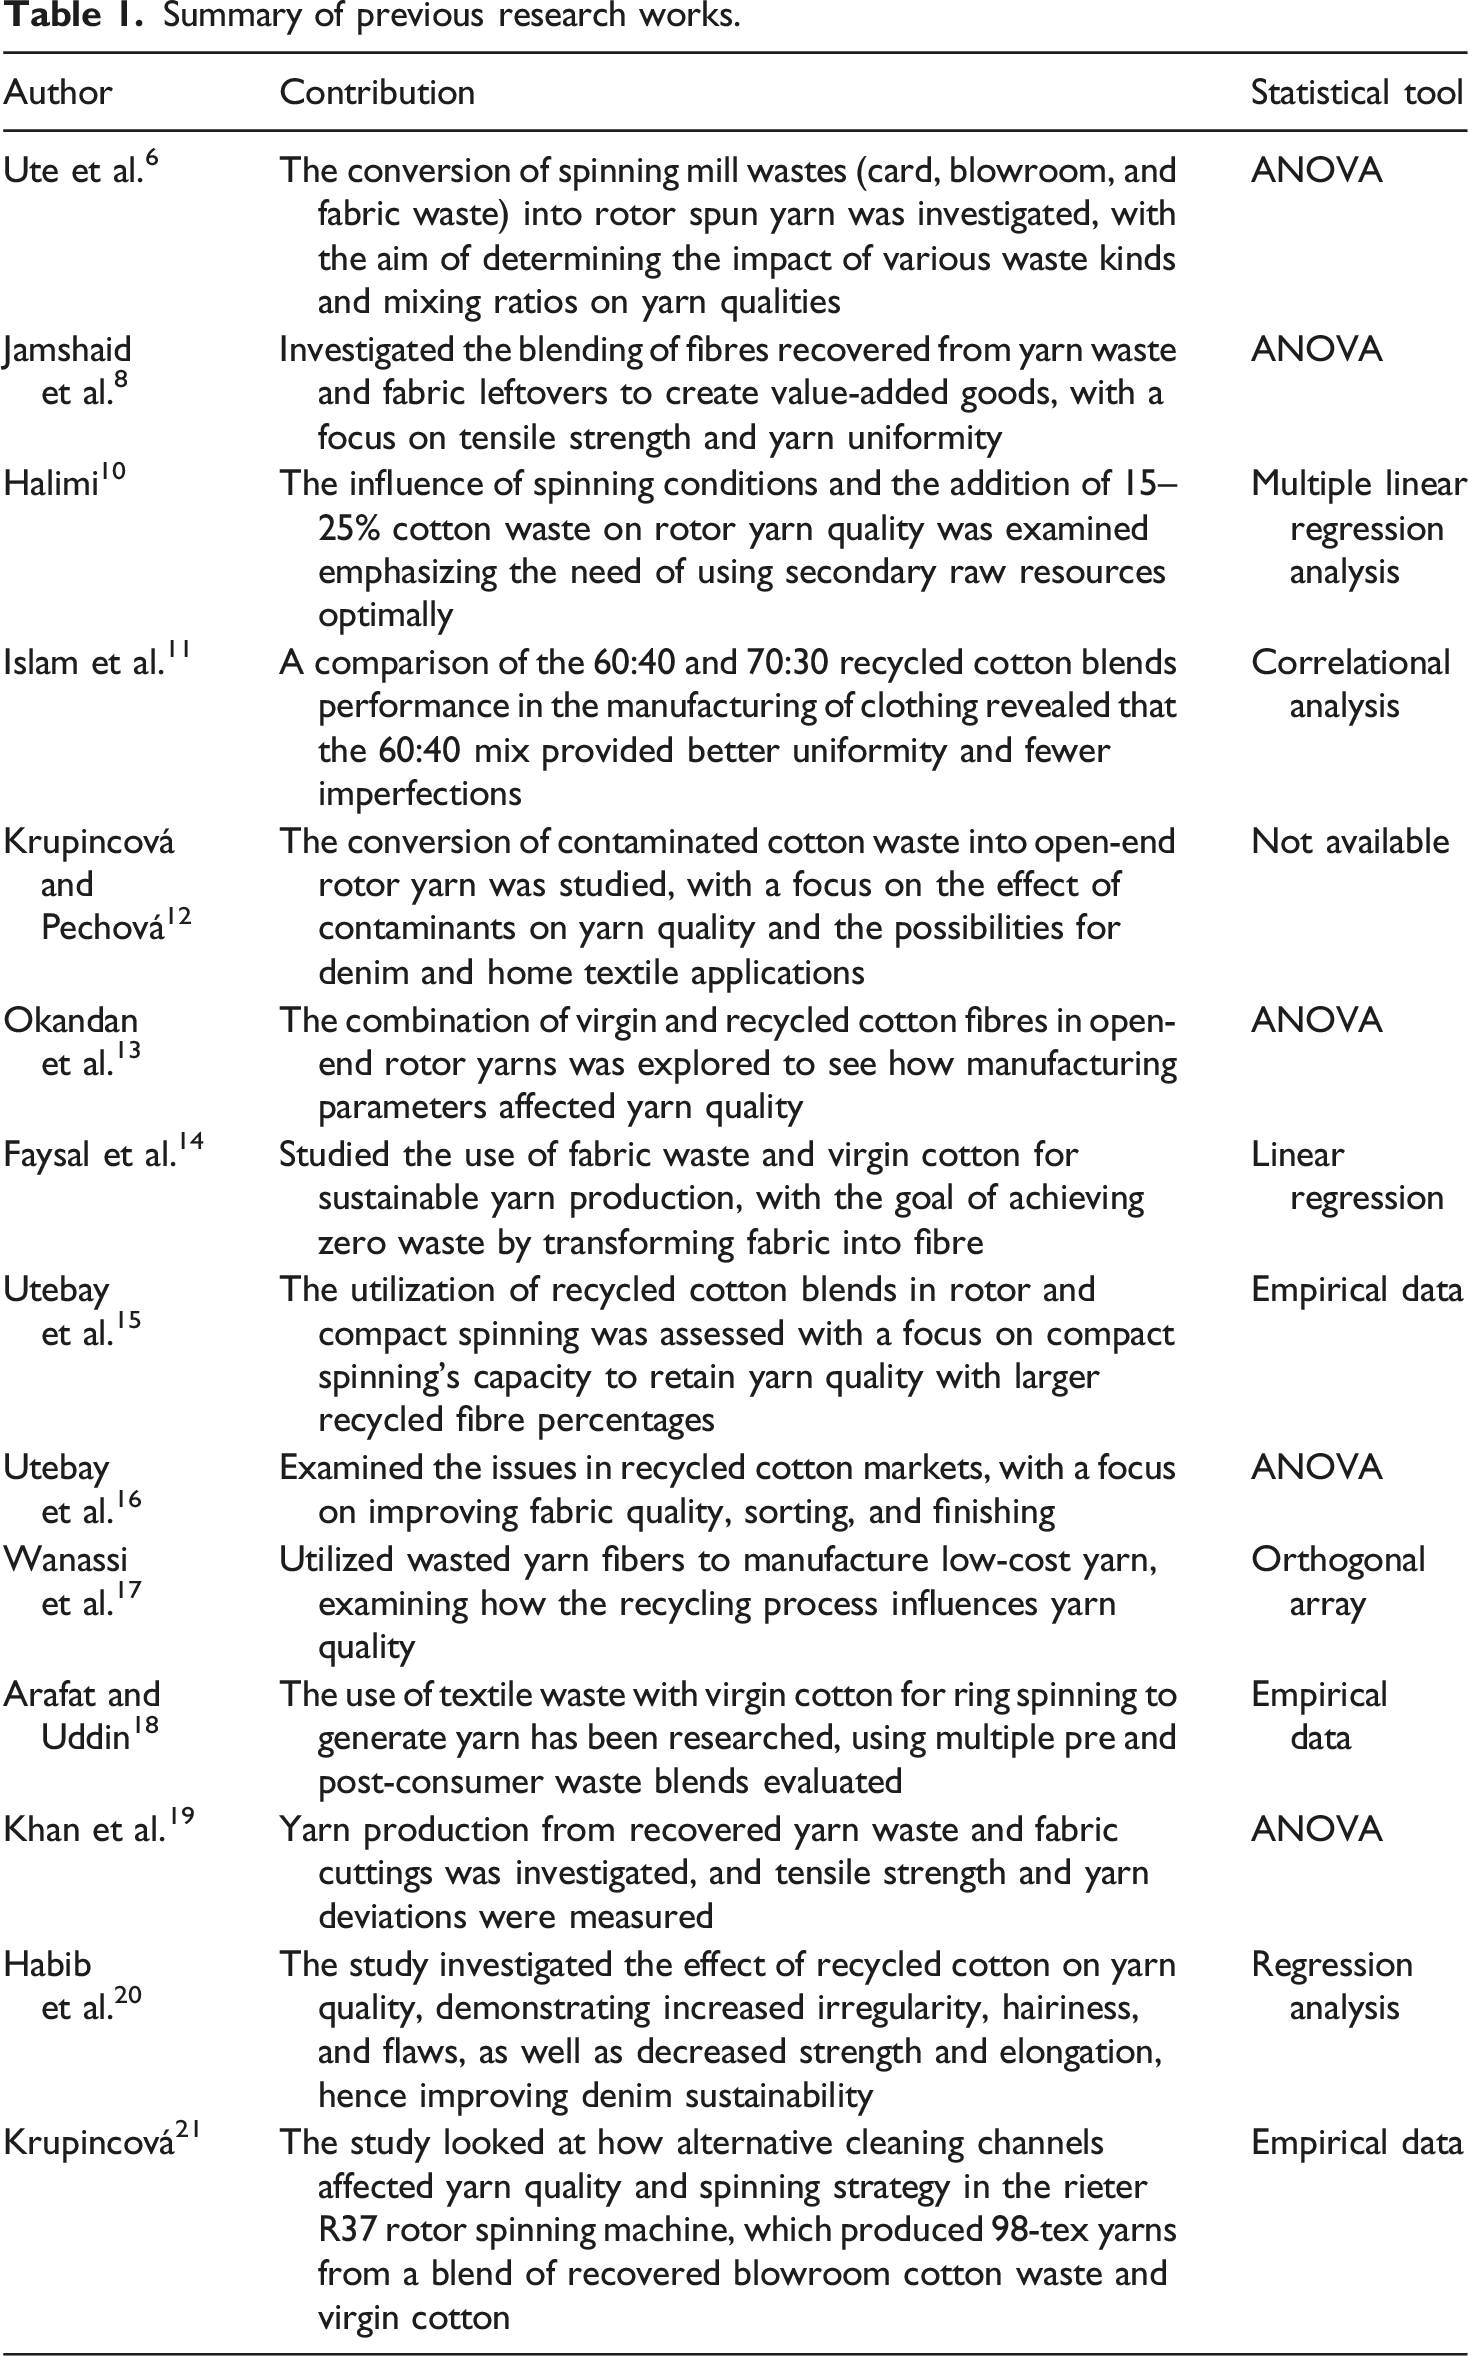
This research fills a large gap in the literature by evaluating yarn quality and the economic viability of textile waste blends using a combination of cost analysis, ANOVA, and AHP statistical analysis. Previous studies frequently overlooked the economic factors and thorough statistical analysis in favor of concentrating on either particular blending techniques or quality optimization. This study offers a comprehensive strategy that not only enhances sustainability in textile production but also offers a workable, affordable solution for large-scale industrial implementation by combining ANOVA for quality comparison and AHP for decision-making with thorough cost analysis. In order to reach its best results, the study intends to address the following research questions: • How do varied quantities of pre-consumer and spinning process waste with virgin cotton affect the quality parameters of 84 tex rotor spun yarn? • What are the ideal ratios for integrating pre-consumer and spinning process waste with virgin cotton in spinning mills, as determined by ANOVA, AHP, and cost analysis, to obtain the best yarn quality, and cost efficiency?
The following goals have been established to solve the state research challenges that were previously mentioned. • Evaluate the quality of yarn samples made from various combinations of pre-consumer and spinning waste with virgin cotton. • Choose suitable blending ratios by integrating cost analysis, factory quality standards, ANOVA, and AHP to evaluate the approach’s quality and viability from an economic standpoint.
Experimental
Materials and methods
Fibre properties
In this experiment, raw materials included Virgin Raw Cotton, Flat Strip (FS), Comber Noil, Card Hard Waste (CWH), and Pre-Consumer Waste. In accordance with ISO 2403 and ASTM standards (1445–1448, 2812, 5866, and 5867), their characteristics such as fibre length, fineness, strength, short fibre content, elongation, and neps were assessed using the Uster High Volume Instrument (HVI) 100 and Advanced Fibre Information System (AFIS) Pro-2.22,23 The Spinning Consistency Index (SCI) uses a multiple regression equation based on HVI measurements to estimate yarn strength and fiber spinnability. A higher SCI suggests more yarn strength and spinnability, making cotton classification easier in warehouses. The equation for the SCI value is:
SCI is calculated obtained from properties of fibre such as strength, micronaire, length, uniformity index, degree of reflectance (Rd) and yellowness (+b) shown in equation (1). 23
The Uniformity Index shows how the fiber length is distributed within the fibrogram by dividing the Mean Length by the Upper Half Mean Length. Based on the Nickerson/Hunter color chart, the Rd value represents the whiteness of the light reflected by cotton fibers. The + b value indicates the yellowness of the reflected light as measured using a yellow filter. The cotton’s color grade is determined by combining the Rd and +b values. 23
Characteristics of raw materials.


Different types of raw materials.
Technology
The research plan followed the structure depicted in Figure 2. According to this plan, five samples were developed using different blending ratios of virgin cotton, spinning process waste and pre-consumer waste. The method of experimentation used in this research.
The chosen proportions were based on fiber blending theory, which states that different fibre combinations affect yarn qualities. The proportions were set based on real-world industrial processes, where textile waste is blended with virgin fibers to improve sustainability. In this experiment, the fibre characteristics and Spinning Consistency Index were taken into consideration while maintaining a constant virgin cotton to flat strip ratio. To prioritize the utilization of other waste fibre, the virgin cotton ratio was not raised. Five samples of 84 tex rotor yarn were made by combining virgin cotton (30%), flat strips (20%), and varied proportions of spinning waste (comber noil, hard waste) and pre-consumer waste in different combinations. The procedures involved in this experiment are described below: At first, the sample matrix displayed in Figure 2 was used to assess the various blending ratios of spinning waste and pre-consumer waste with virgin cotton that were placed beneath the blendomat at the blow room section. First, pre-consumer waste fabric cut clips obtained from weaving and knitting is fed into a fiber shredding machine. The machine breaks the fabric into tiny pieces by applying mechanical force through revolving pointed drums. The machine’s revolving blades or teeth break the cloth apart. The material is subsequently sent through several drums, each of which further shreds the fabric into fibre. Until the fibers are totally separated, this process is repeated. Different feeding mechanisms keep a steady flow of textile waste to each drum for the best fiber recovery in order to guarantee effective processing.
24
The Laydown Plans of five samples were prepared according to the High volume Instrument (HVI) reports shown in Table 2 evaluated by Quality Control Lab. Five cans of 5.9 tex carded slivers were made under five different conditions and subsequently fed into finisher drawframe, resulting in the production of five cans of finisher drawn slivers. Following that, five cans of 5.4 tex finisher drawn sliver were fed into the rotor frame, producing five samples of 84 tex rotor-spun yarn. Quality parameters of yarn such as mass variation, imperfection index, hairiness, and Tenacity were measured using Wrap Reel, Uster Tester 5, and Uster Tensorapid respectively. Equation (2) illustrates how the link between tenacity, elongation, and mass variation can be used to compute the Total Quality Index (TQI):
Production details for sample preparation.

Yarn properties
Standard testing procedures were used to assess yarn count, mass variation, imperfections hairiness, strength, and elongation in accordance with ASTM D1907, ASTM D1425M-14, and ASTM D2256. These evaluations were conducted using instruments such as the Uster Tester 5 and Uster Tensorapid.18,25,26
The three key characteristics that best describe the quality of yarn are tenacity, elongation, and evenness. It’s easier to compare a single descriptive number rather than multiple ones. For this reason, the three attributes are integrated in a total quality index (TQI). The formula of TQI shown in equation (2).
Statistical analysis
ANOVA technique
This study evaluated the impact of various blend ratios on yarn quality metrics, such as mass variation, neps, thick places, IPI, hairiness, elongation, tenacity, and total quality index, using a one-way ANOVA. The technique analyses mean differences between groups to find out the statistical significance. The F-value and p-value is used to test the null hypothesis that all group means are the same. A p-value less than 0.05 indicates statistically significant changes, implying that mix ratios have a visible impact on yarn quality.27,28 Tukey’s Honest Significant Difference (HSD) test is used as a post-hoc study to determine which specific blend ratios differ significantly from one other once significant differences were identified. The null hypothesis of this study was ‘The metrics of yarn quality do not significantly differ among the various blend percentages’. On the other hand, alternative hypothesis was ‘The metrics of yarn quality significantly differ among the various blend percentages’.
Analytic hierarchy process (AHP)
Fundamental scale of AHP.


Approaches to problem analysis.
Pairwise matrix for choosing alternatives.

In this case, n is the number of elements, and λmax is the consistency vector.
Results and discussion
In this experiment, the key parameters assessed include mass variation (CVm%), imperfection index (IPI), Hairiness (H), tenacity (cN/tex), and elongation (%). Total Quality Index was calculated using equation (2) discussed in methods section.
Impact of varied blending ratios on finisher drawn slivers and rotor yarn properties
Finisher drawn sliver mass variation (CVm%)
The mass variation (CVm%) box plot for finisher-drawn sliver is shown in Figure 4 for a range of pre-consumer and spinning process waste blending ratios with virgin cotton. The autoleveller in the finisher draw frame resulted in low mass variation for all samples. Sample A, which was manufactured from 50% pre-consumer waste, had the greatest mass variation due to fibre characteristics like fibre length, spinning consistency index (SCI) etc. Samples B and C, which were composed of 50% noil and hard waste, on the other hand, displayed less mass variation because of their superior fiber qualities and SCI values. Because of their unique fibre characteristics and blending mix, samples D and E also showed less mass variation. The box plot further demonstrates that sample A has the greatest median mass variation, followed by samples B and C. Sample B exhibits a larger interquartile range than sample C, showing more spread in the middle 50% of the data, but with a lower total median mass variation. These findings demonstrate how fiber composition and characteristics affect the variation in sliver mass. Finisher drawn sliver mass variation (CVm%) at different blending ratios.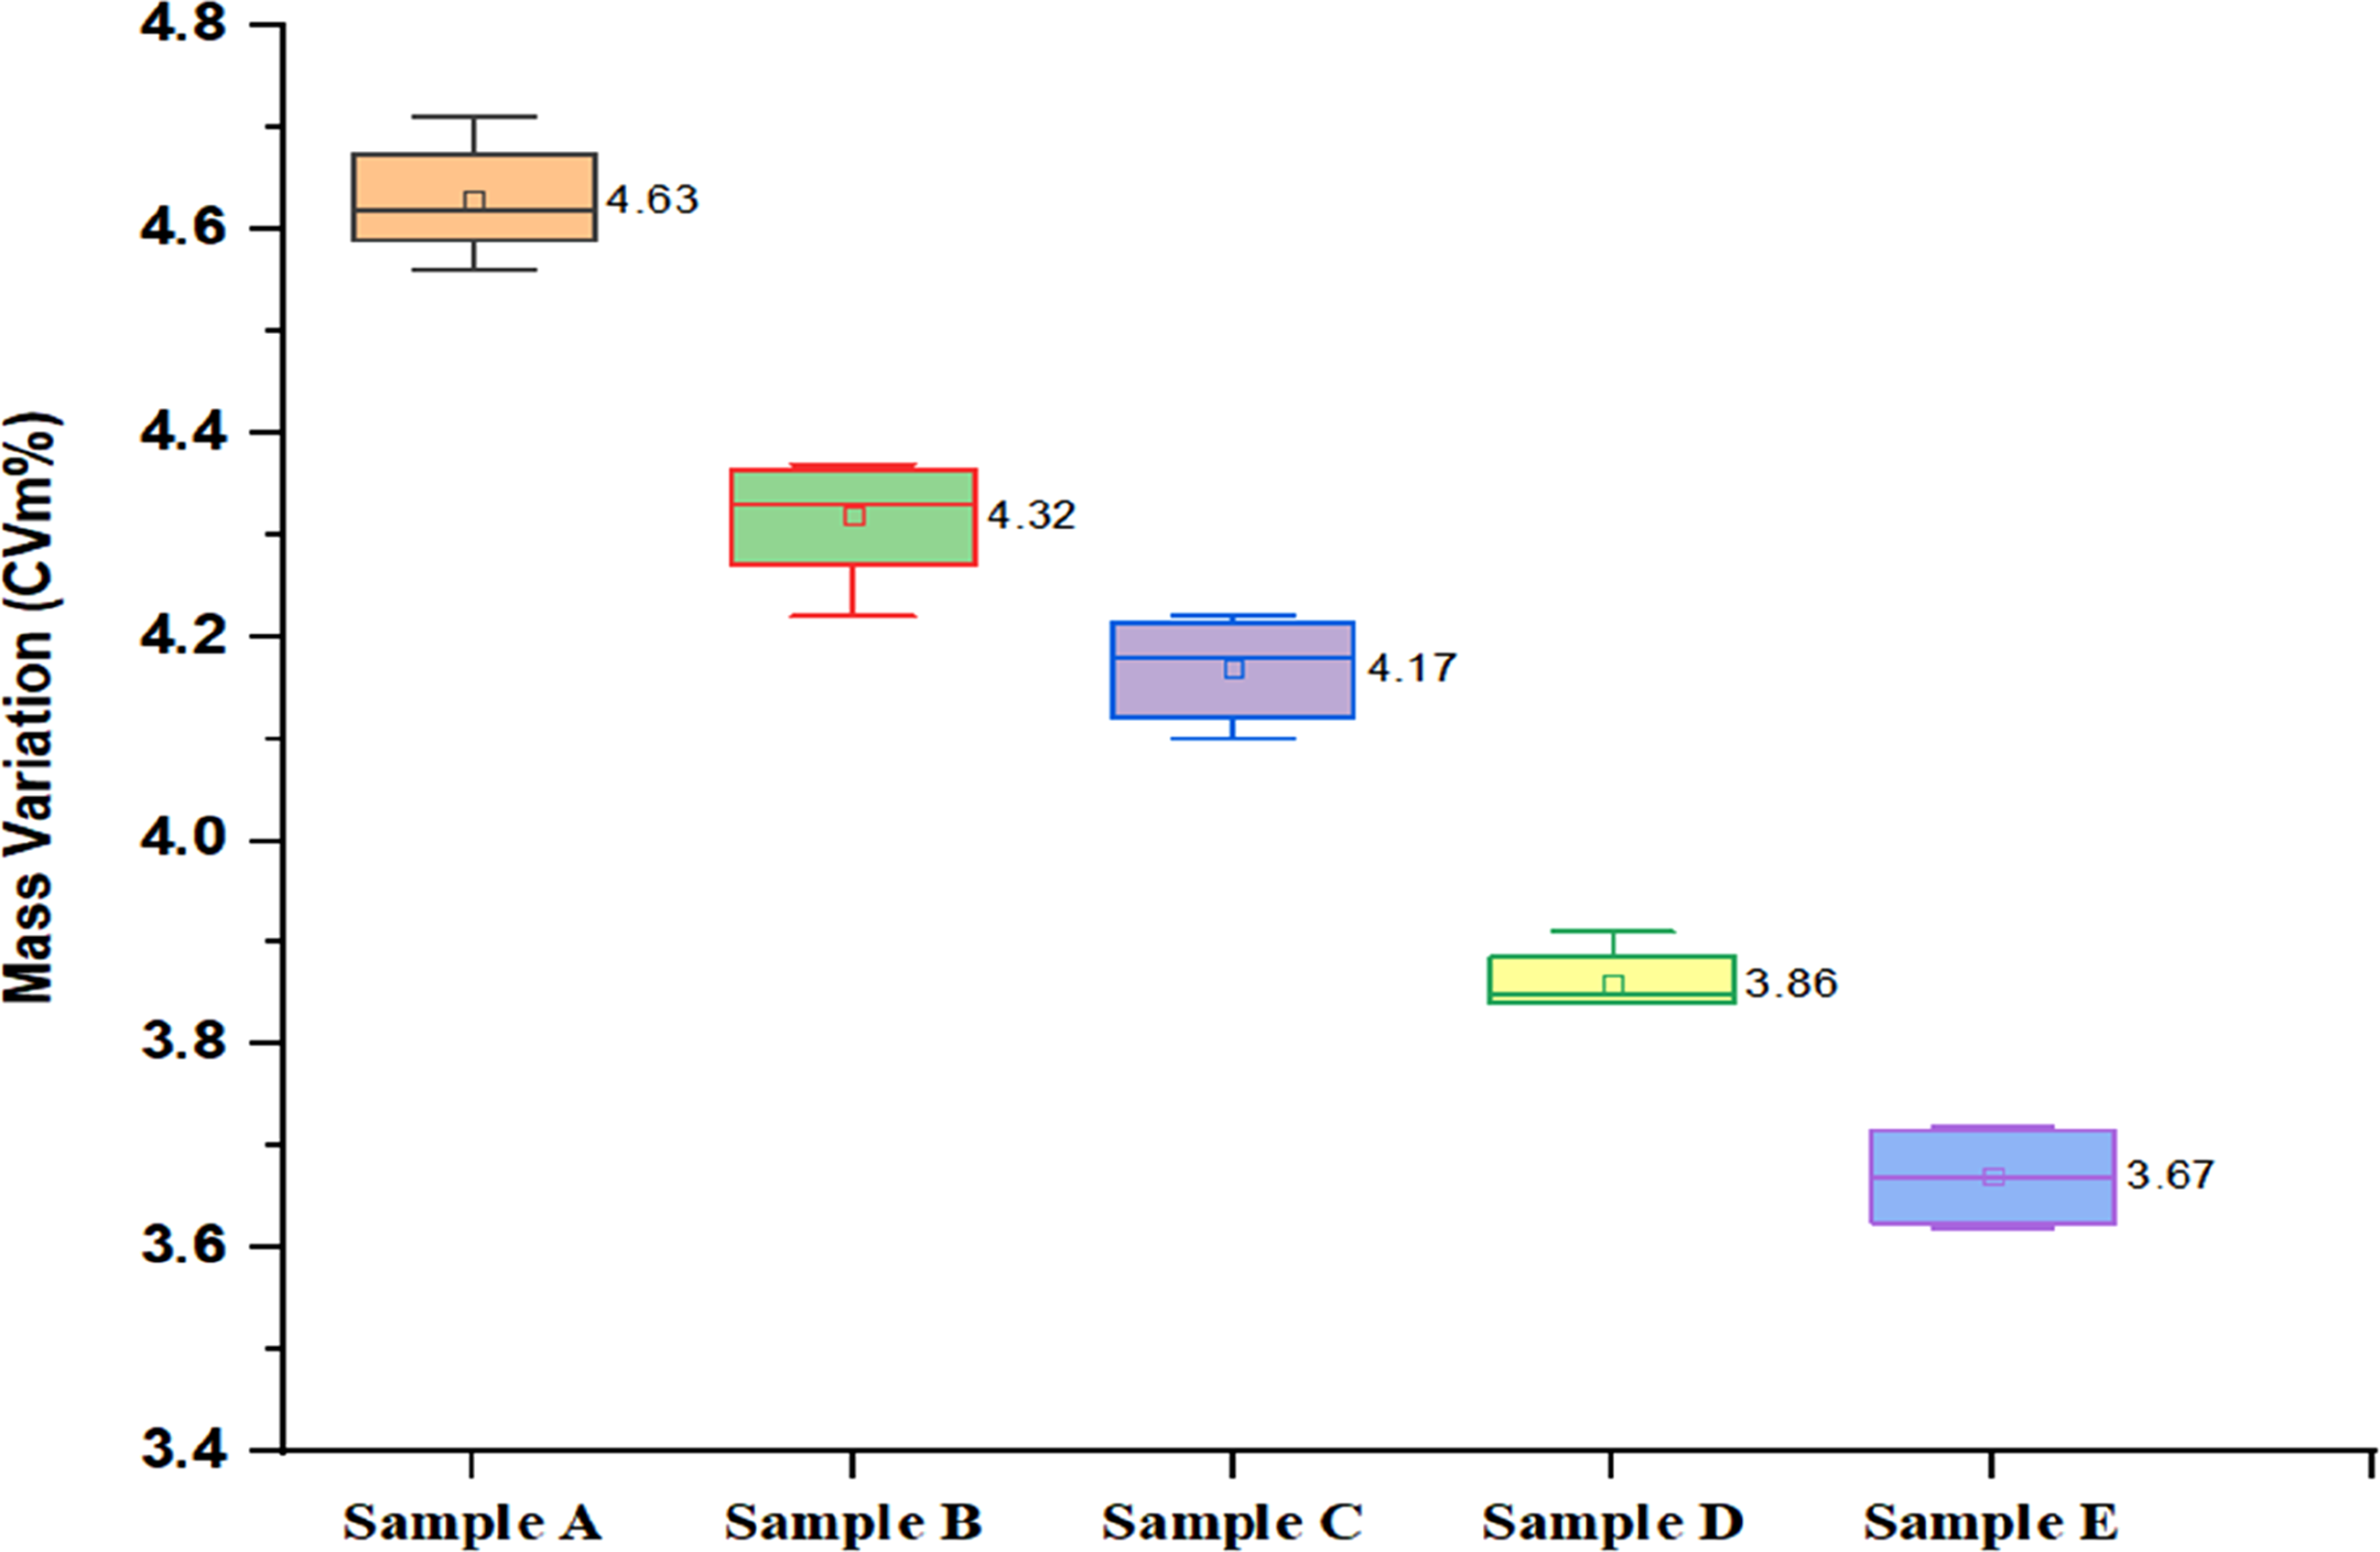
Yarn mass variation (CVm%)
Figure 5 displays the mass variation (CVm%) box plot for yarn samples across various pre-consumer and spinning process waste blending ratios with virgin cotton. Sample A has the broadest box and the longest whiskers, indicating greater mass variation and uneven distribution. Sample A was developed through a blend of virgin cotton, pre-consumer waste, and flat strips, resulting in recycled fibers sourced from pre-consumer waste containing a higher proportion of short fibers and low SCI. This is generated due to the mechanical shredding used for fiber opening, consequently leading to increased mass variation in the yarn samples.18,34 Samples B and C have lower mass variation with greater variation than Samples D and E, indicating a low range of variation. Sample B, which is composed of 50% noil, has significant variability (14.42%), since the mass variation is increased by the noil’s primarily short fibres. However, Sample C, which is composed of 50% hard waste, has longer fibers than noil, which results in a more stable mass variation with less fluctuation. Sample D has less mass fluctuation than other samples, as evidenced by the narrower box in the box plot diagram. As explained in Table 2, this results from the mixing of fibres with various characteristics. Lastly, Sample E had the least fluctuation, owing to its larger proportion of hard waste, which has better fibre characteristics such as SCI value than pre-consumer waste and comber noil. Mass variation (CVm%) at different blending ratios.
Yarn thick place (+50/km)
The box plot illustrates the Thick (+50%) places per kilometer of the yarns for different blending ratios are shown in Figure 6. In the presented figure, a gradual decrease in thick places was observed from sample A to sample E. Sample A exhibits the greatest diversity, with a wide variety of thick areas. Sample B demonstrates modest variation, but Sample C is more uniform. Sample D shows even less fluctuation, indicating more consistency. With a narrow range and the least amount of variance, Sample E exhibits the most consistent distribution of thick places. It was discovered that fibres derived from pre-consumer waste (sample A) at higher ratio contributed to the thick places in the yarn sample due to their shorter fibre length and increased short fibre concentration. This increased proportion of small fibers leads to a higher possibility of thick places due to the rolling of fibers during processing.8,18 Sample E was composed of a blend of different waste types, with a higher ratio of virgin cotton and hard waste, resulting in fewer thick places in the yarn. This trend was consistent with observations made regarding mass variation; the mass variation of the yarn also played a role in thick place occurrence. The combination of different waste ratios from SCI values of fibre assisted in reducing thick places in the yarn depending on the different fibre qualities. Thick place (+50/km) at different blending ratios.
Yarn neps (+280%/km)
Neps, primarily comprising small knots of entangled fibers, are commonly dispersed across the fabric surface if present in the yarn. These clusters are regarded as faults in dyed fabrics.
35
Neps are generated during opening and beating in the ginning and blow room, and they can be minimized by closely observing the carding and combing process. Figure 7 shows the box plot of Neps (+280%/km) against different blending ratios of spinning waste and pre- consumer waste. Sample A showed higher neps content with a wider box, indicating a broader range of neps distribution than the others. The formation of fiber neps is significantly more affected by the shredding operation than by the fiber preparation stage in the staple-fiber spinning process. Table 2 demonstrates that pre-consumer waste has a greater nep content in terms of fiber characteristics. When pre-consumer waste materials are mechanically shredded, the differently colored fibers’ unique frictional characteristics cause the waste fabrics to become short fibres and clusters of fibres resembling neps.
14
Sample B, produced with more comber noil, had a greater short fiber content, which resulted in more neps, despite showing a narrower box and shorter whiskers but less neps than Sample A, which had more pre-consumer waste. This suggests that although the neps count is constantly high, there is little variance within Sample B. With a somewhat bigger box and whiskers, Sample C exhibits considerable instability. Sample D exhibits a narrow box and short whiskers, indicating great consistency. Moreover, Sample E has the narrowest box, indicating the most stable and consistent neps distribution. This was happened due to the combined approach of different SCI values shown in Table 2. Neps (+280/km) at different blending ratios.
Yarn imperfection index (IPI)
Imperfection Index is evaluated by the summation of thick (+50%), thin (−50%) and neps (+280) places per kilometer of the yarns.
36
From this figure, it is evident that the imperfection index (IPI) value is primarily influenced by the presence of thick places, thin places, and neps. Remarkably, in this experiment, no instances of thin places were detected per kilometer of yarn. The key factors linked to imperfections include: (i) ensuring individualization of fibers, (ii) minimizing inter-fiber contact through greater fiber parallelization, and (iii) regulating the movement of short fibers.
18
In Figure 8, box chart is plotted against imperfection index obtained from different blending ratios. A similar trend was seen in IPI as in thick spots and neps, with values constantly falling from Sample A to Sample E. Sample A has the highest mean IPI, with a wide box and long whiskers, indicating significant variation. This is because the mechanical shredding method for opening fibers produced thick places and neps in the yarn by rolling the fibers during processing, which raised the degree of imperfections.
8
Sample B follows with a lower mean but similar box width and whiskers, suggesting moderate variation. Sample C shows a further reduction in mean, accompanied by a narrower box and shorter whiskers, reflecting improved consistency. Sample D has an even lower mean, with tighter box and whiskers, indicating better uniformity. Finally, Sample E exhibits the lowest mean, with the narrowest box and shortest whiskers, signifying minimal variation and optimal yarn quality. IPI at different blending ratios.
Yarn hairiness (H)
Fibre protruding from the yarn surface is the reason of the yarn’s hairiness. Excessive hairiness can significantly affect the visual aspects of products, lowering their texture and appeal, which eventually impacts the overall quality of the finished products. However, hairiness is not considered significant in the case of rotor spun yarns. Hairiness offers a soft feel and improves the wicking property of the fabric.37–39 However, excessive hairiness is undesirable. In Figure 9, various hairiness values are visualized against different blending ratios using box chart. Five samples showed a narrower box and shorter whiskers. Sample A showed higher hairiness than the others samples. This occurred because fibres obtained from pre-consumer waste contained a higher level of short fibre content. As a result, during the twisting of the yarn, short fibres tended to slide apart from the yarn axis. The sample made from higher comber noil and hard waste (B and C) had less hairiness than sample A, but more than samples D and E. Sample D demonstrates better uniformity with a lower median and narrower box, indicating less variability. Sample E has the lowest median, tightest box, and shortest whiskers, indicating minimum fluctuation and the most consistent hairiness scores. This is happened due to the effect of combined blending ratio obtained from different SCI values. Hairiness (H) at different blending ratios.
Yarn tenacity (cN/tex)
Figure 10 displays yarn strength under various blending ratios, showing no distinct pattern in mass variation or imperfection level. However, yarn strength is notably affected by factors like imperfections and short fibre content. Sample A, having a narrower box and reduced variability, has more pre-consumer waste and has a lower strength due to the increased short fiber content. These short fibers fail to join efficiently during manufacture, resulting in slippage under tensile tension and reduced yarn strength.20,40 During the twisting process, short fibres do not enhance yarn strength; instead, they slide away from the yarn axis, leading to increased hairiness in the yarn samples. Sample E exhibited greater strength in comparison to the other samples due to its composition of various pre-consumer and spinning process wastes. The final yarn sample product was affected by mixing due to differences in the characteristics of the fibres. Samples C and D, which had less imperfections had higher yarn strength. Sample B had the highest tenacity variability, as represented by the tallest box, implying a larger range of strength and greater inconsistency. Tenacity (cN/tex) at different blending ratios.
Yarn elongation (%)
When turning yarn into fabric, proper breaking elongation of the strands is essential since it determines the overall extensibility and performance of the finished product. Yarn distributes a load among its constituent fibers, with the breaking elongation of the yarn being influenced by both fiber extension and the arrangement of fibers within its structure.
41
Yarn elongation is associated with the expansion of distinct fibres, as well as their cohesion and alignment within the yarn structure.
42
Figure 11 illustrates various yarn samples elongation across different blending ratios. Sample A exhibited lower elongation at break with greater variability compared to the other samples, primarily due to the increased presence of short fibres within the yarn. This is happened because short fibers in recycled yarn are less likely to properly integrate into the yarn structure when force is applied, which facilitates fiber detachment and lowers the elongation percentage.
20
Sample C demonstrated greater elongation properties with low variability, which can be attributed to the lower presence of short fibers in the yarn. The reduced generation of short fibers during the opening of hard waste contributed to this outcome, enhancing the overall elongation performance of the yarn samples. Samples D and E had low variability through shorter box moderate elongation because they combined distinct waste components in varied amounts. Elongation (%) at different blending ratios.
Total quality index (TQI)
Tenacity, elongation, and evenness are crucial parameters that signify the quality of yarn. Indeed, comparing a single descriptive number is easier than comparing multiple numbers. As a result, the Total Quality Index (TQI) was created to incorporate three qualities into a single, comprehensive measure of yarn quality.
10
Figure 12 displays the total quality index for different yarn samples produced from various mixing ratios using a box chart. Sample E has the greatest total quality index, indicating outstanding performance and consistent results. Sample A has the lowest index, indicating poorer performance as values cluster around a lower median. The intermediate values in samples B, C, and D show varied distribution, indicating moderate variability. Sample B has a narrower range and more consistent, but poorer, performance. Total quality index (TQI) at different blending ratios.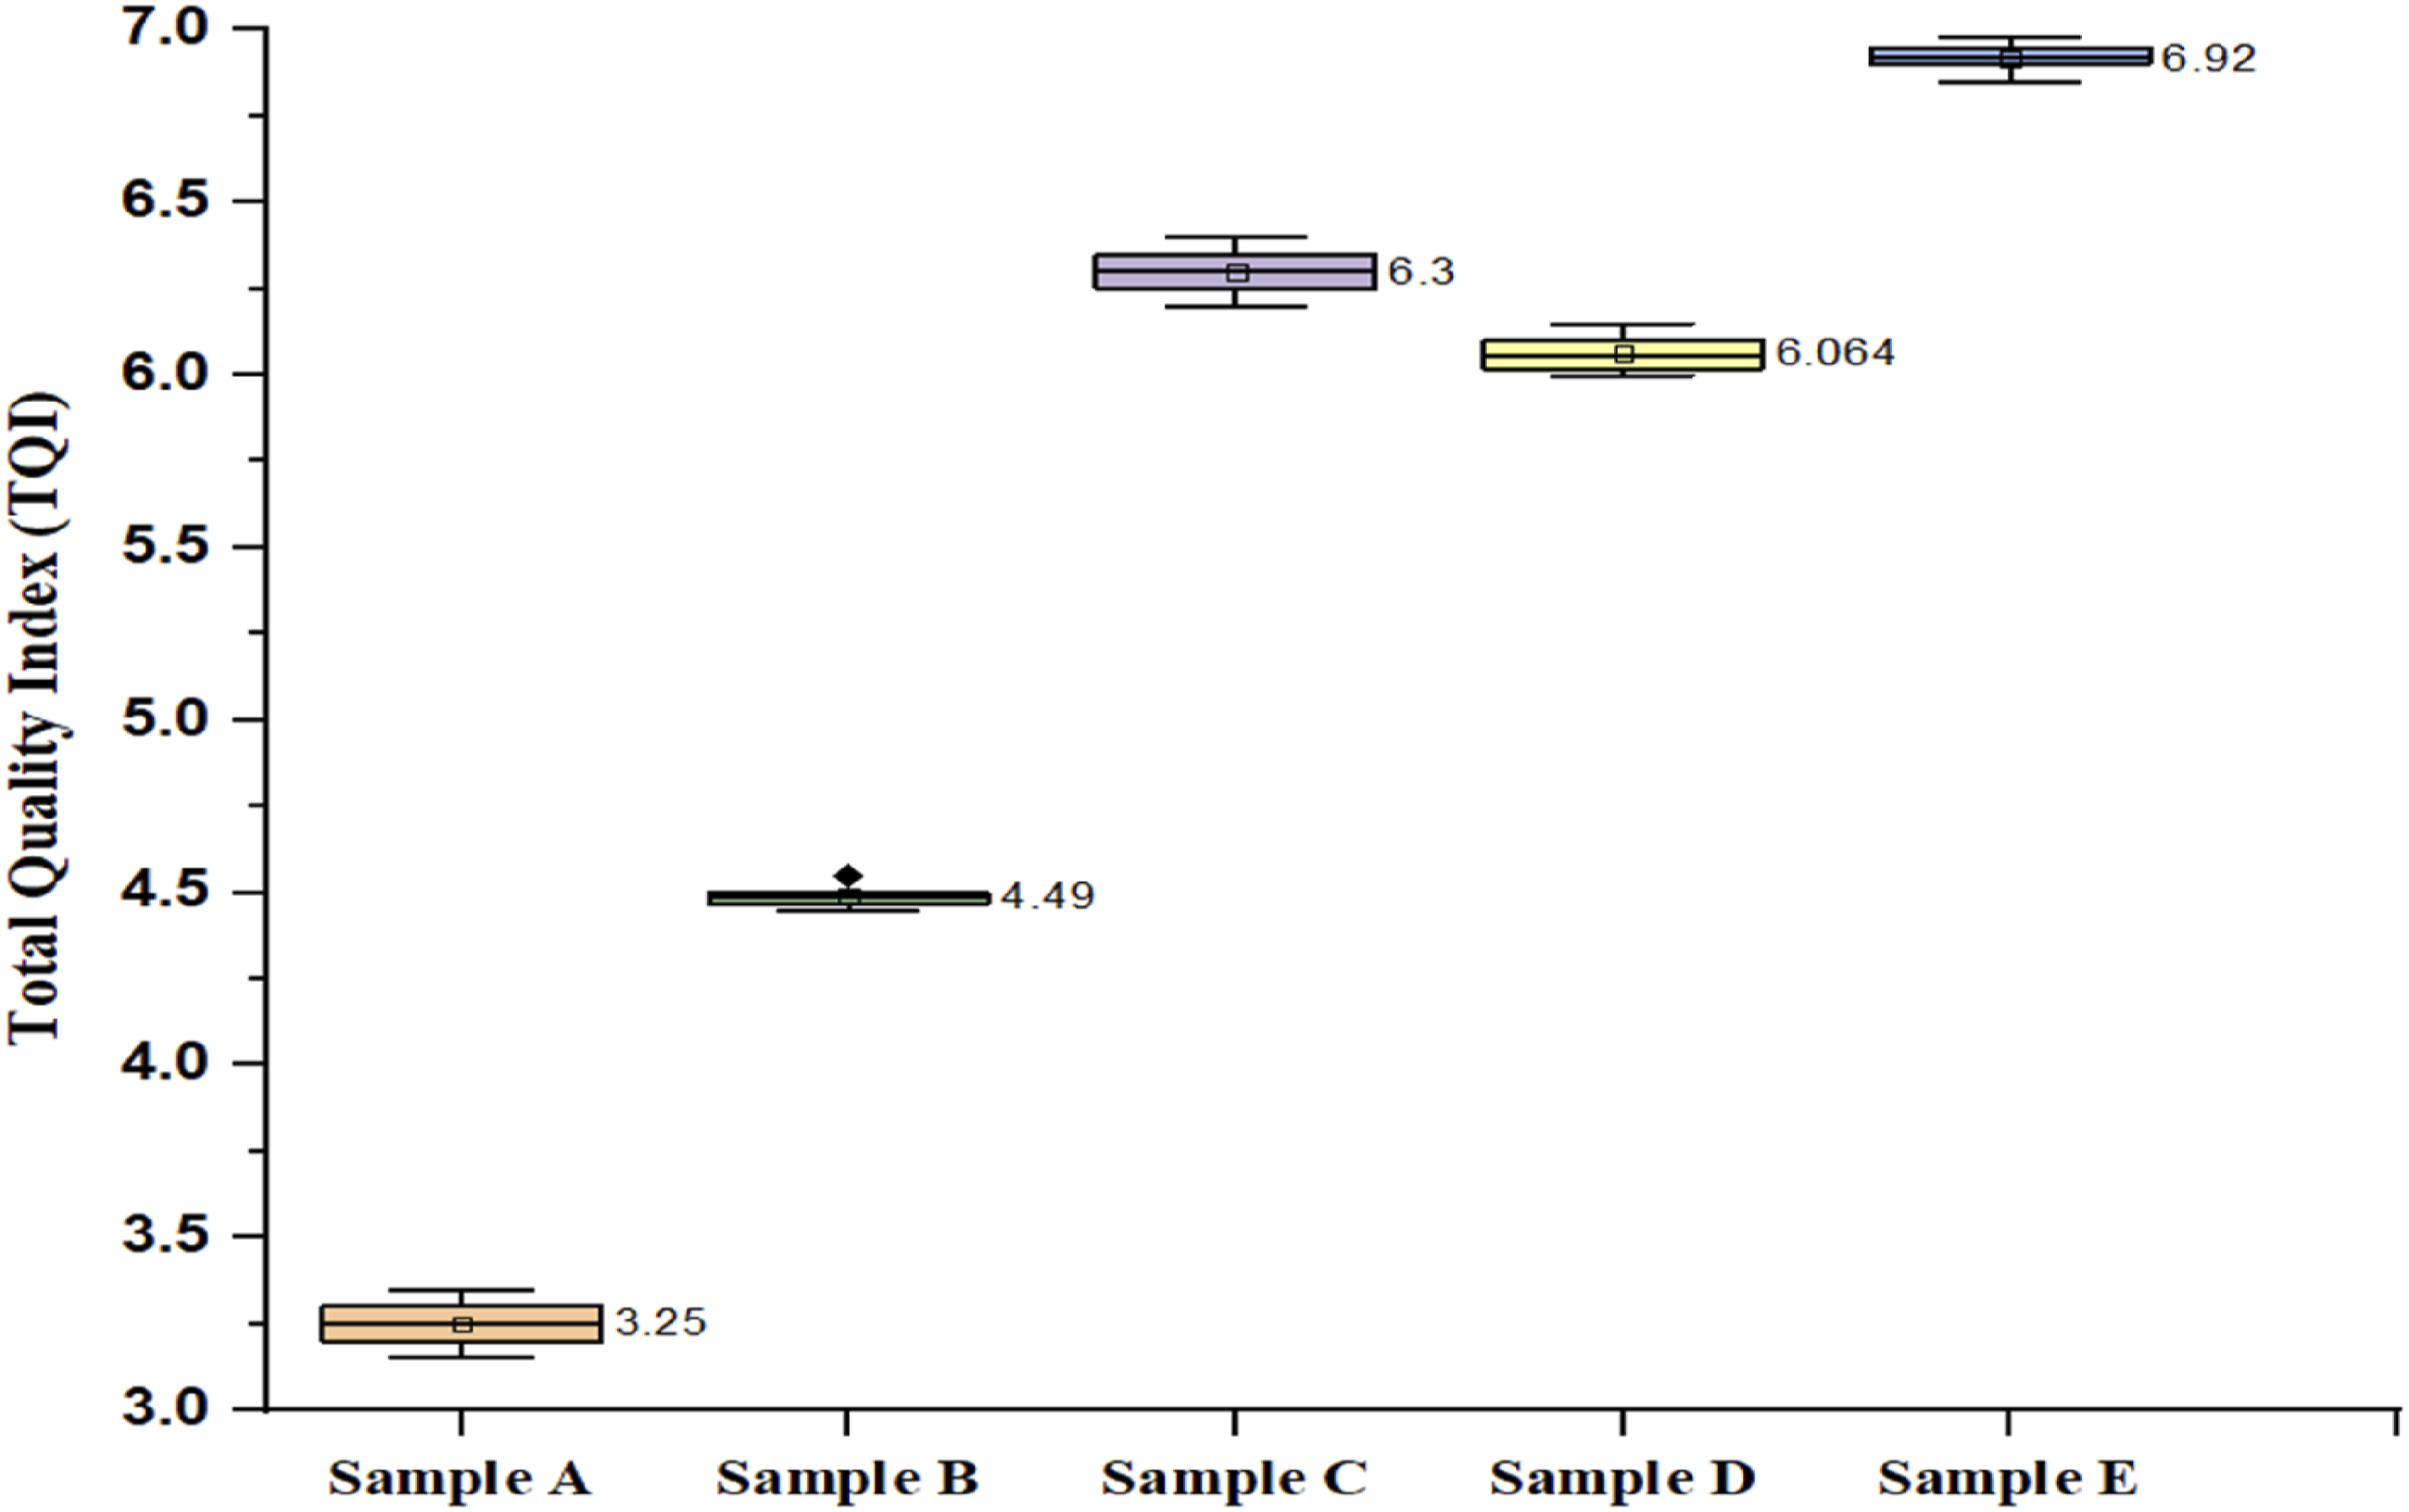
Comparison of yarn quality with factory standard
Comparison of different yarn samples with factory standard.

In this comparison of yarn quality criteria, Sample E had the highest overall tenacity of 12.614 cN/tex, slightly exceeding the factory norm. The CVm% (11.95%) is slightly above the permitted range of ≤11.88%, but hairiness (7.828) surpasses the requirement of ≤6.8. Sample D still performs poorly in tenacity (11.884 cN/tex) and neps, but it does better in thick areas and IPI. Samples A, B, and C perform poorly across a variety of parameters. Samples A and B in particular fall below the acceptable tenacity level while exceeding the limitations for thick spots and IPI. Although Sample E shows the most promise overall, all samples might use additional strength, consistency, and hairiness enhancements to satisfy the factory’s quality requirements.
Statistical analysis
One-way ANOVA analysis
ANOVA analysis of yarn characteristics for various blending ratios.

Tukey’s HSD test results for a pairwise comparison of yarn quality parameters.

The p-values for the majority of the comparisons were less than 0.05, indicating statistically significant differences between groups. 44 In these circumstances, the Significant value was equal to one, demonstrating the significance of the variances. On the other hand, a Sig value of 0 indicated no significant difference between the groups. CVm%, Thick, Neps, IPI, Hairiness, Tenacity, Elongation, and TQI were among the many metrics that revealed notable differences in comparisons like B versus A, C versus A, D versus A, and E versus A. These findings imply that blending ratios, namely the presence of virgin cotton, pre-consumer waste, and alterations in the spinning process, have a significant impact on yarn quality. However, certain comparisons, like D versus C, E versus C, and E versus D, produced p-values larger than 0.05 and Significant values of 0, suggesting that there were no statistically significant differences between the group means for those parameters. These results indicate that some blending ratio modifications may not result in notable differences in yarn quality for particular characteristics. Samples D and E have comparable yarn quality qualities, as seen by the minor mean difference for all quality measures. However, the mean difference between Samples E and A is greater, indicating that the yarn quality of these two groups differs significantly, with Sample E displaying more distinct characteristics than Sample A.
AHP analysis
Computing CI and CR.

Weight calculations for different alternatives.

Cost analysis of yarn obtained from different blending ratios
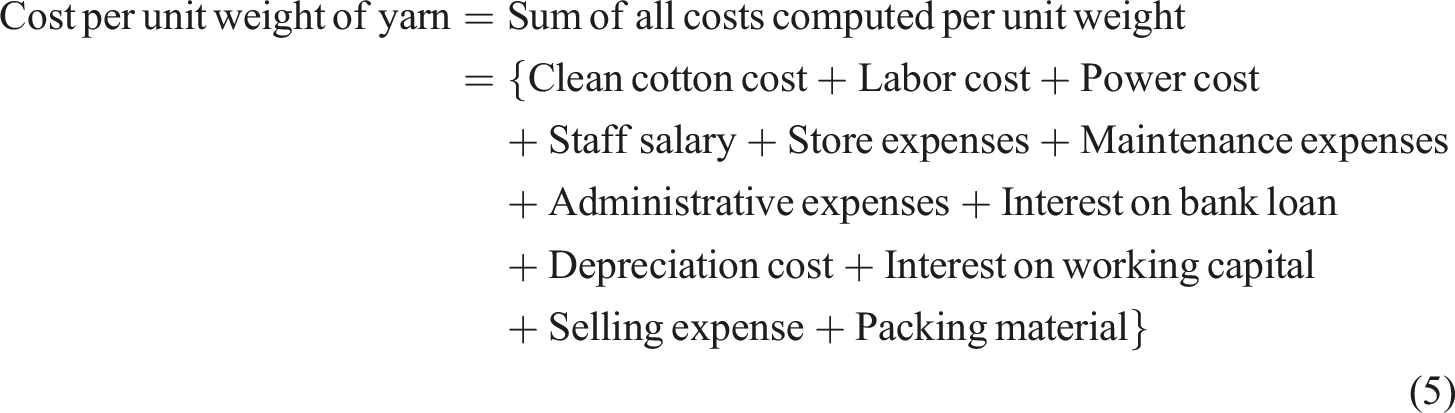
In spinning mills, yarn costs are computed by adding the raw material cost and the conversion cost. Clean material costs, mixing costs, yarn realization, waste computation, and waste sales revenue are all included in the raw material cost. However, all costs associated with yarn production—aside from raw material costs are included in conversion costs. The following formula is used for the cost calculation of yarn.
45
Detailed cost analysis for different yarn samples.

Sample E, which costs $1.95 per kilogram, offers the best balance between price and yarn quality. Despite having lower quality, Sample A is the most economical at $1.90 per kilogram. Even at $2.08 per kg, Sample B is the costliest; its cost is not justified by the notable quality gains it offers. Though Sample C is more cost-effective than Sample E, it is still not as good as Sample E, costing $1.94 per kilogram. Sample D likewise performs worse than Sample E, coming in at $1.97 per kg. Therefore, applications needing both high quality and cost effectiveness are advised to use Sample E.
Conclusion
This study investigated into different waste ratios to produce various types of yarn. Finding showed that the performance of sample E produced from a 30:10:30: 10:20 ratio of Virgin Cotton, Comber Noil, Hard Waste, Pre-consumer Waste, and Flat Strips outperformed the others. Sample E performed well in neps (2.06) and IPI (8.082), although its tenacity (12.614 cN/tex) and CVm% (11.95%) were somewhat lower than the factory norm. Hairiness (7.828) was higher than intended, indicating areas that needed improvement. This might be addressed by optimizing the spinning consistency index (SCI) values, which would help with fiber processing and eliminate yarn irregularities. Statistical investigation, particularly utilizing ANOVA, demonstrated that varying blending ratios have a substantial influence on all quality metrics. The Tukey HSD test revealed a significant mean difference between Samples E and A, showing a considerable disparity in yarn quality, with Sample E displaying better characteristics. In the AHP analysis, Sample E obtained the highest overall score (1.00), excelling in Imperfection Index (IPI) and Tenacity, indicating outstanding yarn quality. Furthermore, Sample E demonstrated to be cost-effective, driven by important economic variables such as raw material savings, enhanced yarn quality, and reduced waste, indicating its economic feasibility and competitive price at $1.95 per kilogram. The findings show that using suitable blending ratios can improve the quality of 84 tex rotor-spun weaving yarn while keeping it cost-effective and sustainable. This yarn is appropriate for numerous applications like including denim towels etc. Finally, Sample E demonstrates that it is a sustainable solution that contributes to both economic and environmental goals during the yarn production process.
Limitation and future scope of this study
Although the ideal mixing ratio computed from AHP provides useful information, its practical implementation in industrial settings can cause difficulties. The effectiveness and consistency of the suggested ratios may be impacted by differences in mechanical performance, operating efficiency, and quality control requirements. Furthermore, varying yarn fineness levels may bring further complications. Future studies could concentrate on resolving these issues by combining real-time performance monitoring with adaptive quality control methods and performing a thorough benefit-to-cost analysis to provide a more thorough assessment of sustainability from a business standpoint, taking yarn fineness variances into account.
Footnotes
Author contributions
Conceptualization – Amit Chakrabortty, Siyam Quddus Khan and Muaj Mohammad Shakib; Methodology – Amit Chakrabortty, Siyam Quddus Khan, Jamal Hossen and Subrata Kumar Saha and Muaj Mohammad Shakib; Performed the experiments- Amit Chakrabortty, Siyam Quddus Khan and Muaj Mohammad Shakib; Data analysis and interpretation – Amit Chakrabortty, Siyam Quddus Khan, Jamal Hossen and Subrata Kumar Saha; writing-original draft preparation, editing – Amit Chakrabortty, Siyam Quddus Khan, Jamal Hossen, Subrata Kumar Saha and Muaj Mohammad Shakib; writing-review– Amit Chakrabortty, Siyam Quddus Khan, Jamal Hossen and Subrata Kumar Saha
Funding
The authors received no financial support for the research, authorship, and/or publication of this article.
Declaration of conflicting interests
The authors declared no potential conflicts of interest with respect to the research, authorship, and/or publication of this article.
Data Availability Statement
Data included in article/supplementary material/referenced in article.