
Abstract
In the early stage, we established a tuft disentanglement model considering the interaction between fibers. In the disentanglement model, the fiber was assumed to be a multi-rigid chain model, with only friction between fibers. However, this model can only simulate the frictional mechanical response of fibers under a single carding action without evaluating the carding results. This paper applies the disentanglement model to the taker-in part of the carding machine, where one end of the tufts is continuously carded as the other end is gripped. Also, the effect of the carding parameters, such as the gauge between the feed roller and the taker-in and the speed of the taker-in, on disentanglement was studied based on the carding results, which are evaluated by the weight percentage of carded tufts. The simulation results showed that the higher taker-in speed and the smaller gauge can reduce the weight percentage of tufts after carding, which means better carding results. Similar trends were observed in the experiments, which verified the rationality of the simulation of tuft disentanglement for the taker-in part. Future work would apply the model to emphasize the frictional mechanical behaviors of fibrous materials involving fiber interactions given a specific scene during spinning.
Introduction
The disentanglement of tuft has been a matter of great concern since the result can directly affect the quality of subsequent textile products. Researchers1,2 have reported that some fibers in the sliver are not completely separated, but still gathered together in carded tuftlets rather than individual fibers. Hua 3 proved that the higher the degree of fiber individualization in the carded sliver, the better the uniformity of the subsequent semi-products, finally achieving better regularity of the yarn. Sripathi 4 pointed out that the variation in tuft size during the opening process may affect the end breaks at the ring frame, as well as yarn properties, such as the count CV, strength, and imperfections. Ishtiaque 5 and Dipayan 6 used a special tester or image analysis technique to measure the degree of fiber openness, respectively. It was found that the yarns spun by slivers with different opening degrees had different yarn quality, especially in the strength, imperfections, and unevenness of yarns.
Researchers study the size or weight of tufts experimentally to evaluate the results of tuft disentanglement. With high-speed motion photography, Niitsu et al. 7 and Dehghani et al. 8 observed the surface of saw-tooth clothing of the carding machines and compared the size of tufts under different parameters. Dehghani’s experiment also gave the tufts’ weight distribution before and after the opening to measure the carding results. Singh et al. 9 used the truncated exponential distribution to fit the tuft weight distribution. Chen 10 used the percentage of tufts less than 30 mg to evaluate the degree of tuft disentanglement in the practical cotton opening process. Kambo11,12 used the Poisson process to describe the tuft disentanglement and establish a nonlinear equation to describe the probability density equation of tuft weight distribution, which tries to understand the underlying mechanism. However, the key parameters of the probability density equation were obtained by fitting the observed data of the feed and output tufts, so they cannot reflect the influence of the specific process parameters of the blowroom line. Nevertheless, the reasons for all such changes in the sizes or weights of tufts are not yet completely understood.
Extensive studies have focused on the mechanical model of tuft disentanglement to clarify its mechanism. He 13 simulated the whole tuft carded by the taker-in to study the effect of the teeth on the fiber damage. However, the simulated tufts were seen as a whole, and the motions of the constituted fibers were ignored. Maltin & Mayer 14 constructed the tuft disentanglement models based on the simplification of the carding action, which can be simplified as pulling the fibers on one end, done by the teeth. The motions of withdrawn fibers were well studied, while those of the neighbor fibers were neglected since the neighbor fibers were fixed. The same simplifications of carding action also see in previous studies.15,16 The essence of this kind of prototype model is fibers withdrawal from the tufts and taking the withdrawal force on the carded fibers as the evaluation index. Therefore, this kind of model cannot analyze the influence of specific carding parameters, such as the speeding or gauge of the carding components, because it cannot evaluate the carding results.
In this work, the tuft model 17 and tuft disentanglement model 16 we established previously has been developed for the taker-in part of the carding machine. The early model only simulates the frictional mechanical response between fibers after a single carding, which cannot evaluate the carding results of tufts after continuous carding. According to the continuous carding for tufts clamped by the feeding roller, the corresponding constraint conditions were established to describe the carding characteristics of the taker-in part. The carding results can be evaluated according to the state of carded fibers both simulated and experimental, which can reflect the influence of the speed of the taker-in and the gauge between the taker-in part in greater detail. Pearson correlation coefficient between the results of simulations and experiments were all greater than 0.95, which can confirm the good agreement between model and experiment. Future work should therefore include follow-up work designed to apply the model to a given spinning scene and evaluate the semi- or final product quality.
Tuft disentanglement model for taker-in part
The principal objective of the taker-in is to open up the tufts fed to the card. The tuft is carded effectively when one end is momentarily held while the teeth of the taker-in tease out individual fibers or tuftlets from the other. Figure 1(a) illustrates the way the taker-in opens tufts. The trailing end of the tuft is gripped by the feed roller and the feed plate, which can be represented by the gripping line DD՛. The front of the feed plate facing the taker-in has a wedge space, which enables the taker-in teeth to penetrate the fibrous materials from point B to point A, gradually. Diagram of Taker-in part of carding machine (a) relative position between the feed plate and taker-in; (b) the gripping distance L
x
for each layer.
The fed laps can be divided into several thin layers along the thickness direction, as shown in Figure 1(b). The position of the initial carding point, x0, for each layer is different. The tufts on the top layers were opened by the saw teeth of the taker-in at point B, whereas those on the bottom layer may be opened at point A. The distance between the gripping point and the initial carding point is called the gripping distance, L
x
. The length of L
x
for each layer also changes since L
x
depends on the initial carding point. The calculation is as follows3,18:

Carding process simulation
The disentanglement model for the taker-in part was established considering that one end of the tuft is carded continuously when the other end is gripped. As shown in Figure 2(a), it is the actual clothing of the taker-in. The circumferential surface of the taker-in is all covered with teeth. The saw tooth constantly beat the tufts with the rotation of the taker-in, thus realizing the continuous carding. The simulated teeth of the taker-in can be simplified as the dot on plane x-y. To reflect the staggered arrangement of actual clothing, the positions of adjacent columns of virtual teeth are slightly offset Δy on the y-axis, as shown in Figure 2(b). Although the taker-in’s tooth specification is an important parameter in the carding process, this work only paid attention to the influence of the taker-in speed and gauge on the carding results without considering the effect of the tooth. Diagram of the saw-tooth clothing of taker-in: (a) real products; (b) simulation diagram.
For a single tuft at a certain layer, Figure 3 illustrates the carding process simulation for the tuft at the taker-in part. The virtual tufts were composed of multiple fibers modeled as a chain of fiber segments according to the previous work.
17
As shown in Figure 3(a), the gripping line can embody that the feed roller and the feed plate gripped the tuft end. Set the initial carding point x0 at the distance L
x
from the right side of the gripping line. A schematic diagram of tuft disentanglement simulation for the taker-in part: the relative position of the tuft and the saw-teeth at (a) T = 0; (b) T = Δt;(c) T=(n-1) Δt. The single fiber may be (d) only gripped; (e) only carded; (f) gripped and carded at the same time.
At time T = 0, the 1
st
column of the teeth was generated at x0, and the fibers within the tuft can be seen as carded by contacting the teeth. After the time step Δt, as shown in Figure 3(b), a new column of the teeth was arrived at x0 to reflect the continuous carding of the taker-in. During this time, the 1
st
column of the teeth moved the distance s can be calculated by the speed of the taker-in v
t
, and the uncarded tuft moved the distance Δx can be calculated by the speed of the feed roller v
f
, respectively. Also, the uncarded tuft moved as the speed at the feed roller.


Although the feed roller and feed plate grip the tufts, the tufts on the feed plate will still move forward at the speed of the feed roller. Since the differences in the speeds of the taker-in and the feed roller, the carded fibers were separated from the origin tuft. As the simulation continued, the fibers were gradually pulled away from the moving tuft carded by the taker-in. As shown in Figure 3(c), the tuft can be transferred by the taker-in as a whole when no fiber is held, which means the carding process simulation ends. According to the classical carding theory,3,18 the gripping distance, L
x
, directly affects the length, Lc, of the sawtooth acting on the tufts. The relationship between the two is that: Lc = L-Lx, where L represents the tuft length. When the simulation stops, the total number n of columns of teeth acting on the tuft can be calculated as follows:

At each time step, the state of fibers, gripped or carded, within the tuft should be determined according to the relative position of the tuft and saw teeth. In the simulation, the fibers in the tufts may experience the following three cases:
The fibers were only held without carding
The gripped fibers can be defined as those intersecting the gripping line, which indicates the fibers were held by the feed roller and the feed plate. For Figure 3(d), the gripped fiber intersected with the gripping line at point G. At time T, the grip constraints for those gripped fibers can be formulated according to the previous work
16

The fibers were only carded without holding
In the simulation, the carding action of the taker-in can be simplified as the contact with fibers. The carded fibers can be defined as those fibers that are in contact with the teeth without being gripped. For Figure 3(e), the carded fiber was in contact with the teeth at point C. In practice, the fibers are teased out from the original tufts by the taker-in and transferred to the clothing of the cylinder with the rotation of the taker-in. Therefore, the carded fibers in the simulation are defined to move forward at the speed of the taker-in at the carding points.
If certain carded fibers were separated by the ith column saw-teeth at time T
i
, and suppose that the tuft was carded by the jth column saw-teeth at time T
j
. Then the time t for that carded fiber moving forward is given as follows:

The carding constraints can be established based on the specified motion trajectories of carding point C, moving with taker-in speed v
t
.

The fibers were carded and gripped meanwhile
When the gripping distance L x is small, the situation may exist that the fiber may be held at one end and carded at the other end concurrently. Figure 3(f) shows that the fiber was simultaneously subjected to the action of the gripping and carding. This manuscript focused on the separation between fibers, which ignored the situation in which fibers are broken. In a certain way, the acting length can reflect the magnitude of the acting force, which was learned from the concept of slippage length 19 in the strength analysis of staple yarn. By comparing the distance between the gripping point G and the carding point C to the fiber’s endpoints, it can be judged whether the fiber can be teased out smoothly. In Figure 3(f), if CF≥EG, the fiber was classified as the carded fiber since the carding action is dominant. Therefore, the corresponding constraint for the action can be built as a carding constraint in equation (7). Instead, CF<EG, the fiber was classified as the gripped fiber and the corresponding constraint can be built as equation (5).
Based on the different states of fibers mentioned above, the carding or gripping constraints that can reflect the characteristics of the taker-in part were established. Replacing the carding or gripping constraints in the previous work 16 with the above constraints, the constrained dynamic equations can be established to analyze the fiber motion for the taker-in part. The constrained dynamic equations for the fibers within the tufts can be solved as a linear complementarity problem(Lcp) and solved by the Fischer-Burmeister Newton algorithm,, which was described in detail in our previous work. 16
In this manuscript, the carding process of the taker-in is studied through the movement of fibers within tufts. The simulations were all carried out using MATLAB. The parameters involved in the simulation were set as follows. According to the previous work, 17 ten virtual tufts were generated with 200 fibers, and each fiber only contained three segments with a length of 1 mm. The fed laps were divided into 50 layers along the thickness direction, and the thickness d of the lap was 1 mm. The simulation was carried out as a given tuft placed in each of the 50 layers respectively. These ten tufts were simulated 500 times at different layers, and the simulation results can reflect the carding results of the fed laps under various parameters. In the simulation, LA was 3 mm as the virtual fiber length. The angle β between the feeding plate and the vertical line was set to 10°. The longitudinal pitch px of teeth was set to 0.8 mm and the offset Δy was set to 0.5 mm. To simplify the calculation, the total number n of columns of teeth was reduced to 5∼14 varied by the parameters. The algorithm’s convergence standard was set at 10-5.
Evaluation of carding results
The fed tuft can be decomposed into individual fibers and tuftlets after being carded by the taker-in. According to the previous research, the carding results of the taker-in can be evaluated by the average weight or the weight percentage of carded tuftlets.3,8,20 Generally, the smaller weight percentage or the average mass of carded tuftlets means that there will be a more efficient breaking down of tuftlets into individual fibers, which indicates a better carding result.
In the simulation, only the weight percentage of carded tuftlets was calculated to evaluate the simulated carding results. When the tuft is carded by being held at one end, the carding action done by the taker-in is more sufficient, and most of the tuft may be separated as single fibers. When the tuft is carded without being held, the tuft may be transferred by the taker-in and the carded tuftlets may still contain many entangled fibers. In the simulation, the tuft transferred by the taker-in is the carded tuftlets. The simulated weight percentage of the carded tuftlets was equivalent to the average mass of virtual tuftlets since the fed tufts all contained the same number of fibers.
The carded tuftlet, as well as the number of fibers in that, can be determined by the position of each fiber after the simulation. In our previous work, the fiber in the virtual tufts was set as a chain of rigid segments connected by spherical joints. According to Christian 21 and Switzer, 22 the pair of fiber in contact can be calculated based on the centroid position and orientation of each fiber segment. The fibers still in contact can form the fibrous assembly, that is the carded tuftlets. According to the contacts between fibers, the fibrous assembly containing the most fibers was defined as the carded tuftlets. Then the simulated weight percentage can be calculated for the ratio of the number of fibers in the carded tuftlets to the fed tufts.
Experiments
As seen in Figure 4(a), the experiments were carried out on a prototype that retains the taker-in part of a carding machine. The fibrous materials enter the prototype along the feeding plate. Then, the fibrous materials are held by the feeding roller, as well as carded by the taker-in. Suction was used to extract samples of the carded fibrous materials from the taker-in surface during the operation of the machine. Part of the equipment and tools used in the experiment: (a) Prototype of the taker-in part; (b) space sheet used for measuring the gauges.
The specific parameters of the prototype are as follows: the diameter of the feeding roller is 57 mm, and the rotation speed of the feeding roller is 0.8 rpm; The diameter of the taker-in is 135 mm, and the specification and density of the tooth of the taker-in are AT5010 × 5030 V and 43 inch -2,respectively. The variable frequency motor comes from Changzhou Wangkai Reducer Co., Ltd, and the model is BWY00. The frequency converter comes from Shenzhen Easy Drive Electric Co., Ltd, and the model is Easy Drive Mini-S.
In the experiments, the influence of each parameter on the carding results can be observed by changing the speed of the taker-in and the gauge between the feeding roller and the taker-in, respectively. The speed of the taker-in of the prototype is controlled by the variable frequency motor. The speed of the taker-in was measured using a non-contact speedometer of SW6236 C from Guangzhou Suwei Electronic Technology Co., Ltd. Stick the reflective paper on the taker-in, then start the machine. After the machine runs for ten minutes, aim the speedometer at the reflective paper to measure the rotational speed of the taker-in. The gauge can be adjusted by the position of the feeding roller. Measure the gauge with the gauge sheet as shown in Figure 4(b). The numbers on the gauge sheet indicate the spacing and the units of those numbers are 1/1000 inches. After adjusting the position of the feeding roller, insert the gauge sheet into the gap to ensure that the gauge sheet can pass smoothly without being hindered by the teeth of the taker-in.
Fiber properties.
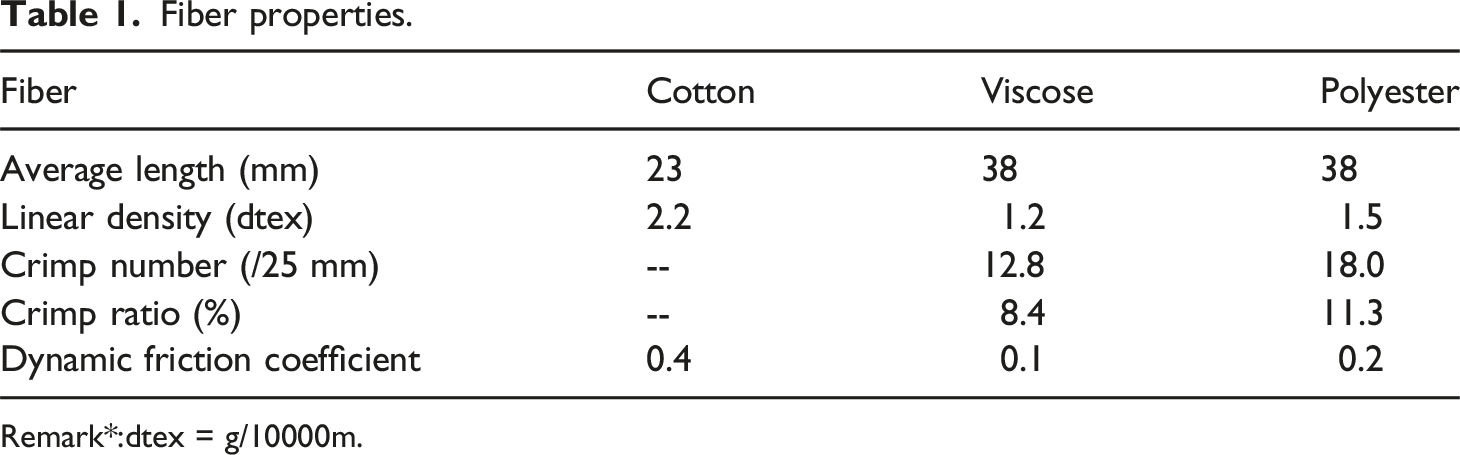
Remark*:dtex = g/10000m.
In the experiments, the effect of parameters on carding was evaluated on those carded tufts with the weight percentage and the average weight. The carded tuftlets were sorted out from 0.5 g of collected materials. The samples were all tested after standing for 24 h in a constant temperature and humidity room at 20 ± 1 C and 65 ± 5% relative humidity. The values for each parameter were averaged over 3 repeated experiments.
Results and discussion
Effect of taker-in speed
Figure 5 shows the effect of the taker-in speeds on the weight percentage of carded polyester tuftlets. In the experiments, the gauge between the feed plate and taker-in was kept at 8 × 10⁻³ inch, and the taker-in speed was set at 500, 600, 700, 800, and 900 rpm respectively. These parameters used in the simulation were the same as the experiments. Although these measured tuftlets weight percentages seemed slightly different from the simulated values, the simulated effect of taker-in speeds on carding presented the same trend as the measured ones: the weight percentage of carded tufts decreased with the increase in the taker-in speed. Under different speeds, the Pearson correlation coefficient between the measured and the simulated values of tuft weight percentage was 0.995, which proved that the correlation between the simulated and the measured values was significant at the level of 0.05. Therefore, the same trend between the results of the simulations and experiments can verify the rationality of the simulation. Effect of taker-in speed on the weight percentage of carded polyester tuftlets.
The speed v
t
of the taker-in affects the times of tufts carded along the longitudinal direction. In the simulation, the time step Δt was subject to the taker-in speed v
t
. As mentioned before, the time step Δt represents the time interval between two adjacent columns of teeth acting on the tuft: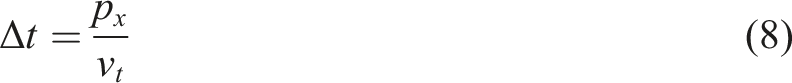
The increase in the taker-in speed can result in a shorter time interval between two adjacent carding, which means more carding actions in a certain tuft. More fibers are withdrawn from the tufts as the carding times increase, which can result in a decrease in the weight percentage of carded tufts.
The average absolute error between the experimental and simulated results was 24.1%. Simulating the carding action of the taker-in is equivalent to simulating the movement of fibers interacting with each column of teeth. The number n of teeth columns acting on the tufts in the simulation is smaller than that in the actual carding process. Since the virtual tufts were far less than the real tufts, the number of teeth was reduced accordingly, which can be adjusted by the time interval between adjacent teeth. The time interval between adjacent teeth has been artificially scaled up 500 times. The difference in the teeth column number led to the difference between the simulated and the experimental values.
Figures 6 and 7 show the measured effect of the taker-in speeds on the carded tuftlets. The experimental results showed that the mean weight or the sizes of carded tufts was decreased significantly with the increase in the taker-in speed. The conclusion was consistent with the research results of Niitsu
7
and Ishtiaque.
5
The above results were valid for all three types of tufts, although the specific values are different. Comparatively speaking, the size and weight of polyester tufts were slightly lower. It may be due to the influence of fiber crimp performance that the polyester tufts before carding appeared fluffier, and these were relatively small and light respectively with the cotton and viscose ones, so the sizes after carding were also smaller. The sizes of the cotton tufts after carding were also large under the same conditions which may be explained by the large friction coefficient between cotton fibers. The required decomposition force may be increased since the interactions between fibers were large, as well as the size of cotton tufts. Although the friction coefficient of viscose fiber is small, the viscose tufts before carding were large and mostly long, which increases the difficulty of decomposition. Therefore, the viscose tufts seem to easily stretch in the transverse direction, and those sizes after decomposition were also large. Measured effect of taker-in speed on tuftlets weight. Physical diagram of tufts (a) cotton tufts: (a1) uncarded tufts; carded tufts with speed of (a2) 500; (a3) 600; (a4) 700; (a5) 800; (a6) 900r/min; (b) viscose tufts: (b1) uncarded tufts; carded tufts with speed of (b2) 500; (b3) 600; (b4) 700; (b5) 800; (b6) 900r/min; (c) Polyester tufts: (c1) uncarded tufts; carded tufts with speed of (c2) 500; (c3) 600; (c4) 700; (c5) 800; (c6) 900r/min.

Figure 8 represents the changes of tufts in the disentanglement simulation under different taker-in speeds. The carded tuft comprised fibers with blue lines, and red dots denoted the teeth of the taker-in. The weight percentage at every moment was calculated and shown in the upper right corner of each subfigure. The time interval Δt was varied with taker-in speeds, therefore the recording time in each subfigure seems to be slightly different. Over time, it can be concluded from the weight percentage that the tuft became loosened as continuously carded by the taker-in. Two kinds of fibers may be separated from the original tufts. One is the carded fiber directly in contact with the teeth. The other, although not in direct contact with the teeth, can still be withdrawn from the tufts because of the friction with the carded fiber. These fibers were dispersed around the original tuft. In addition, the fibers at the head end of the tufts gradually became parallel and straight due to the frictional contact between the fibers. Simulation snapshot of tuft disentanglement with varying taker-in speeds.
Effect of gauge between the feed plate and the taker-in
Figure 9 shows the effect of the gauge on the weight percentage of carded polyester tuftlets. In the experiments, the taker-in speed was kept at 700 rpm, and the gauge between the feed plate and taker-in was set at 8, 10, 12, 14, and 16 × 10-3 inches, respectively. The velocity and gauge parameters used in the simulation were the same as in the experiments. The simulated results showed that the weight percentage of tuftlets increased with the increase in the gauge between the feed plate and the taker-in. On the one hand, the increased gauge will cause more tufts not to come into contact with the taker-in, so these tufts cannot be carded. On the other hand, the increased gauge will reduce the carding length Lc of carded tuftlets. These two factors jointly deteriorate the carding results. The Pearson correlation coefficient between the measured and the simulated values of tuft weight percentage was 0.963, which proved that the correlation between the simulated and the measured values was significant at the level of 0.05. Therefore, the same trend between the results of the simulations and experiments can verify the rationality of the simulation. Effect of gauge on the weight percentage of carded polyester tuft.
Figures 10 and 11 shows the measured effect of the gauges on the carded tuftlets. The experimental results showed that the sizes and the mean weight of carded tuftlets increased with the increase in the gauge. However, when the gauges were greater than 12 × 10-3 inches, the size changes of tufts were not obvious. The above trend held for polyester, cotton, and viscose tufts used in the experiments. The above experimental results were consistent with those of Ishtiaque
5
and Niitsu.
7
Measured effect of gauge on tuft weight. Physical diagram of tufts (a) cotton tufts: (a1) uncarded tufts; carded tufts with gauge of (a2)8; (a3) 10; (a4)12; (a5)14; (a6)16 × 10-3 inches; (b) viscose tufts: (b1) uncarded tufts; carded tufts with gauge of (b2)8; (b3) 10; (b4) 12; (b5)14; (b6) 16 × 10-3 inches; (c) Polyester tufts: (c1) uncarded tufts; carded tufts with gauge of (c2)8; (c3) 10; (c4) 12; (c5)14; (c6) 16 × 10-3 inches.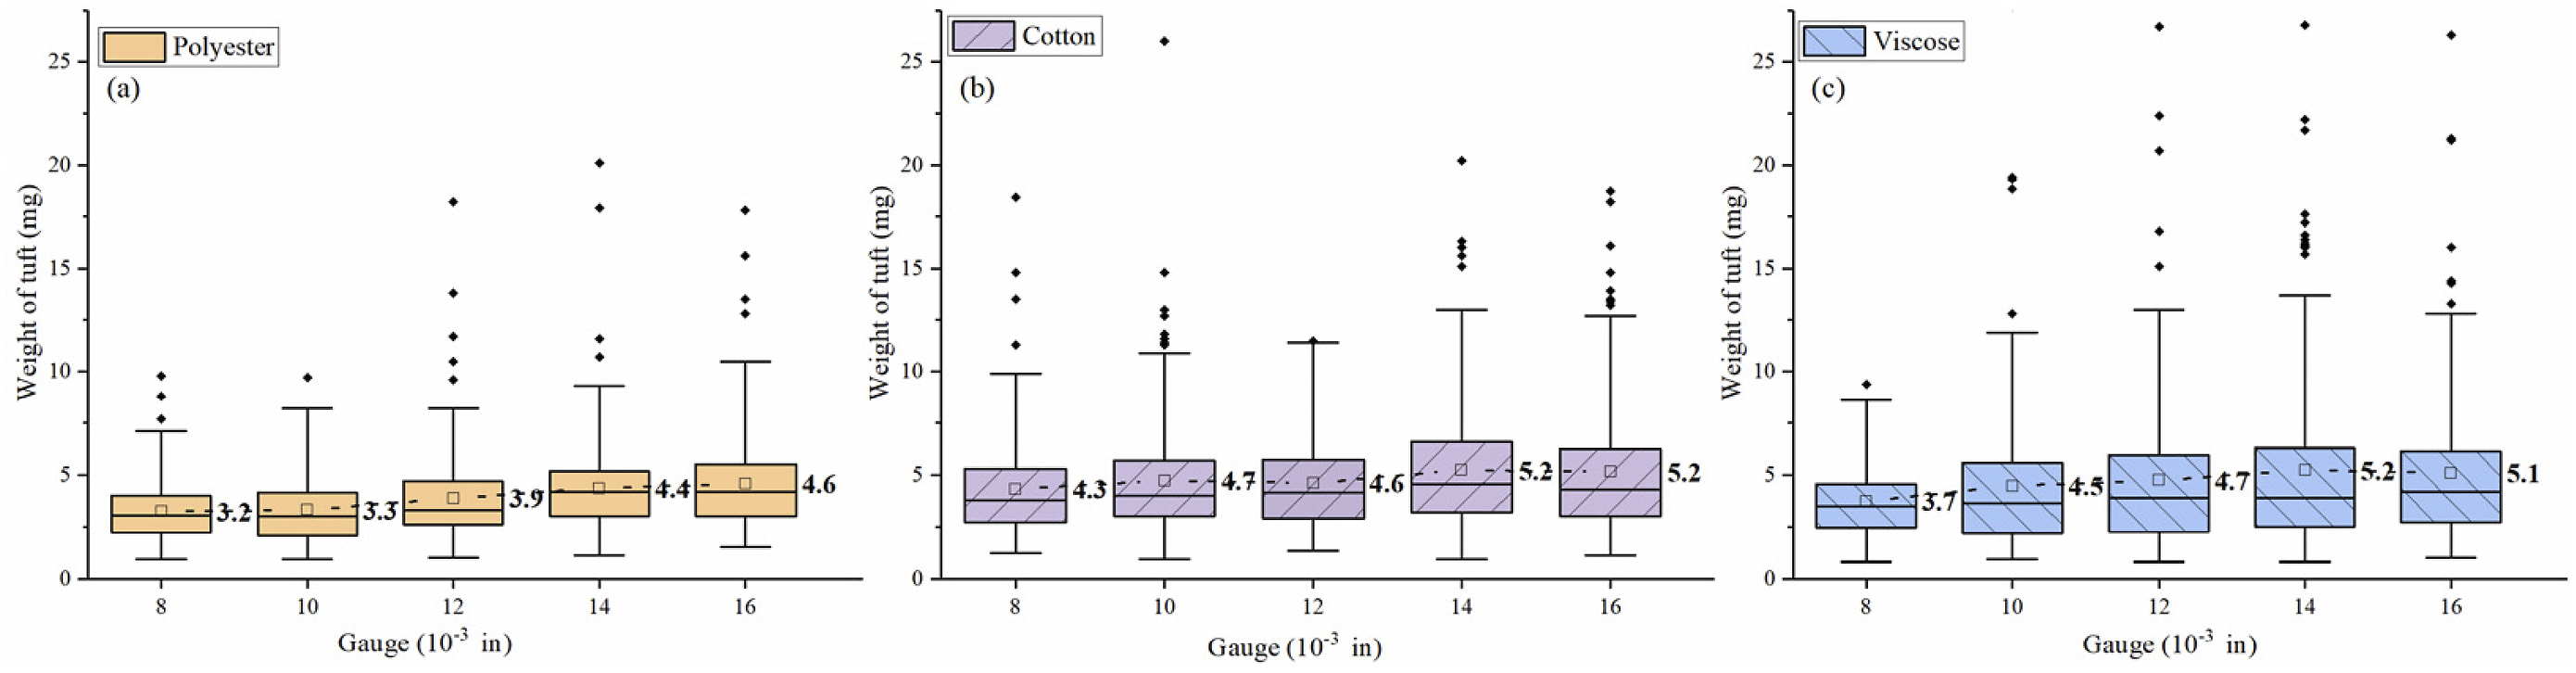

Figures 12 and 13 show the changes in surface and bottom tufts in the simulation under various gauges, respectively. Also, the weight percentage was calculated for every moment and shown in the upper right corner of each subfigure. There are differences in the carding results acted on the tufts on the top surface or bottom of the laps. As mentioned, z
x
is the height of the tuft in the fed laps along the thickness direction. The tuft with z
x
equal to the lap thickness d was selected as the surface tuft, whereas the tuft with z
x
equal to 0.32days can be seen as the bottom tuft. Snapshots of disentanglement for the surface tuft with different gauges (z
x
= d). Snapshots of disentanglement for the bottom tuft with different gauges (z
x
= 0.32days).

The height z x of the surface tuft is set greater than all the chosen gauges g. As shown in Figure 12, the surface tufts can be successfully carded under all chosen gauges. With the continuous carding actions of the taker-in, fibers were constantly separated from the original tuft due to the direct carding of the taker-in or the frictional contact with the carded fibers. Compared with the uncarded fed tufts, the carded tufts became loosened and the inner fibers were gradually parallel and straight.
The carding results for the surface tufts under different gauges were also different. It can be seen from equation (1) that if z x is constant, L x increases with the increase of g. Then the carding length Lc will decrease accordingly, which means the carding results deteriorate according to the classical carding theory. Comparing the carded tuftlets in Figure 12, it is found that the size change of carded tuftlets under different gauges accords with the classical theory.
If z x is less than the gauge g, the tuft may not be carded directly by the taker-in. Therefore, this kind of tufts may not be carded in the simulation. The height z x of bottom tufts chosen in this manuscript was more than 12 × 10-3 inches and less than 14 × 10-3inches. As shown in Figure 13(d)-(e), the bottom tuft can’t be carded because it can’t contact the taker-in under the condition of the gauge of 14 × 10-3 and 16 × 10-3 inches. As the tufts moved forward, the tufts carded by the taker-in gradually became loosened, whereas the tufts not contacting the taker-in have not changed.
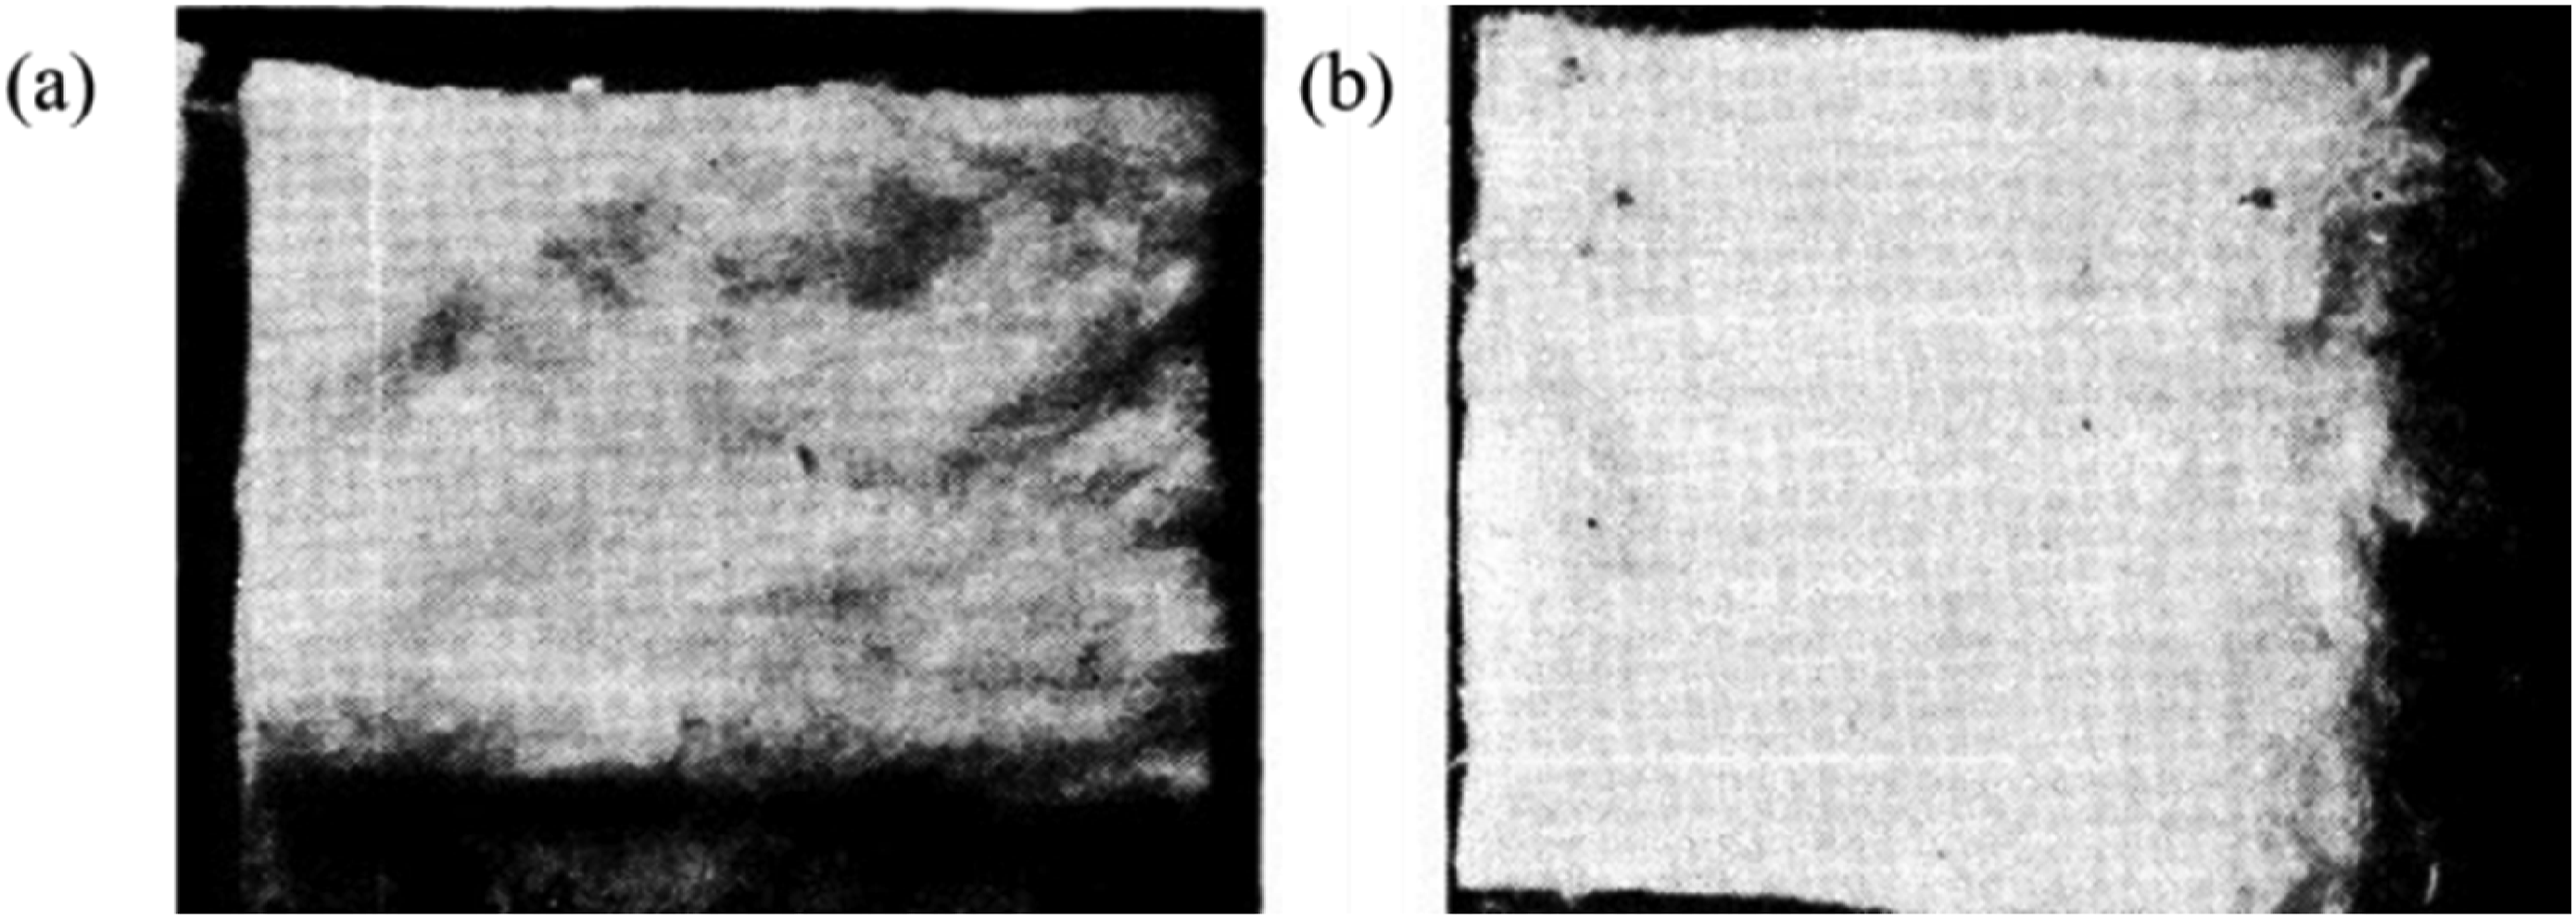
The difference in the simulated carding results between the surface and bottom tufts accords with the experimental results observed by Niitsu.
7
The surface and bottom laps were obtained after stopping and reversing the feed roller, as shown in Figure 14. Compared with the fibers originally on the surface laps, the fibers originally on the bottom layer were hardly carded by the taker-in, which proves that carding differences exist along the lap thickness. Front end of lap being fed to taker-in: (a) upper surface; (b) bottom surface.
7
Potential cause analysis
There are some differences between the simulation results and the experimental results in this paper, and we try to summarize the reasons for the differences, hoping to improve them in the follow-up research. A large number of tufts were used in the experiments, and the established fibrous tuft models cannot be completely consistent with the internal structure of the experimental tufts. Uncarded tufts contain many intertwined fibers, leading to variable fiber configurations and extremely complex internal spatial structure of tufts. The entanglement of fibers in the tufts can easily cause friction between fibers in the subsequent separation process, which will affect the movement and deformation of subsequent fibers. The fiber was set as a chain of rigid bodies in the virtual tufts, which may cause the flexibility of the fiber was not well-reflected. Also. The number of fibers in the virtual tufts were far less than the real tufts. Due to the simplification of the virtual fibers and tufts, its structure seems to be different from the actual tufts, which may lead to a difference in simulation results. In addition, due to the complexity of solving the dynamic equation considering friction, we reduce the number of pin-tooth in the overall simulation to reduce the limitation of calculation cost, which may also lead to the difference between the simulation results and the actual results. The tuft disentanglement model can be applied to the corresponding carding units by changing the constraints based on the carding characteristics, which provides a new idea for the research of the carding process.
Conclusions
The tuft disentanglement model was presented to mimic the card action of the taker-in part in the carding process. With the continuous carding action of the taker-in, the virtual fibers were withdrawn from the fed tufts due to direct contact with the teeth or frictional contact with the surrounding carded fibers. The carding or gripping constraints for the taker-in part were established based on its carding characteristics, that one end of the tuft is carded continuously by the taker-in as the other end is gripped by the feed roller. The carding model for the taker-in part can be used to evaluate the degree of carding by using the weight percentage of carded tuftlets.
The rationality of the simulation was verified by comparing the effect of parameters on the carding results. The simulation results showed that higher taker-in speeds or smaller gauges can reduce the weight percentage of carded tuftlets by increasing the carding times acted on the tufts, which can achieve better carding results. The taker-in can directly card the bottom tufts on the laps with the small gauge, which can also enhance the carding effectiveness. The simulation results were consistent with the experiments.
Footnotes
Funding
The authors disclosed receipt of the following financial support for the research, authorship, and/or publication of this article: This work was supported by the Key Research and Development Special Task Project of Xinjiang (No. 2024B04004-3).
Declaration of conflicting interests
The authors declared no potential conflicts of interest with respect to the research, authorship, and/or publication of this article.