
Abstract
Drafting is a critical process in spinning that attenuates slivers or strands into yarn and influences the final yarn quality. Roller pressure is key to controlling fiber movement within the strand during drafting. However, previous studies have mainly concentrated on roller pressure in non-twisted strands, leaving the effects on twisted strands unexplored. This study develops a geometric model to analyze the roller pressure distribution in twisted strands during drafting and establishes a mechanical calculation model for further analysis. A thin-film pressure sensor was used to measure the pressure distribution and validate the calculation model. The results indicated that the maximum deviation between the calculated and measured values was 9.58%, confirming the accuracy of the model in predicting pressure distribution on twisted strands held by the roller nip. Additionally, this study investigates how linear density and twist factor influence strand compression properties. Increasing strand linear density promotes uniform pressure distribution, while a higher twist factor leads to stress concentration and elevated compressive stress. Understanding roller pressure distribution is essential for accurately predicting fiber interactions and movement during drafting, ultimately aiding in yarn quality assessment.
Introduction
Spinning is important in textile manufacturing because it transforms fibers into yarns, serving as an intermediate link between raw fibers and end products.1,2 Drafting, a crucial stage in spinning, directly affects yarn quality. 3 In this process, a drafting zone is formed by two pairs of rollers, where fibers transition from a slower to a faster speed, leading to strand attenuation. Achieving uniformity in the drafted strand requires minimizing variations in fiber acceleration within the drafting zone. 4 Fiber movement is governed by the forces acting on individual fibers, making pressure distribution a critical factor in controlling fiber dynamics. 5 This distribution influences the physical properties of the strand, such as fiber arrangement, structure integrity,3,6 and mechanical properties like yarn strength and abrasion resistance.7–9
During drafting, the top and bottom rollers form a gripping nip, applying pressure to the strand to ensure a stable and uniform pressure distribution, which is essential for achieving optimal drafting performance. 10 Researchers have analyzed roller pressure distribution and its influencing factors, highlighting roller performance and surface morphology as key factors. 11 A finite-element model was developed for roller-flat surface contact to study how the roller elasticity modulus affects pressure distribution.12–14 The results indicated that a lower elasticity modulus and larger roller diameter increased the contact area, resulting in a more uniform pressure distribution in nonplanar, single-curvature contacts. Building on this, Qu 15 developed a theoretical model to study pressure distribution based on roller deformation in single-curvature conditions. However, these studies mainly focused on the pressure exerted on flat surfaces without addressing the complex pressure distribution when a roller nip grips an irregular, flexible fiber assembly (strand) during drafting.
During spinning, fiber material presents a complex and irregular structure.16,17 The roller-applied pressure significantly influences fiber compactness, directly impacting inter-fiber interactions and ultimately determining fiber arrangement in the final yarn.18,19 While fiber compaction tests have established a power-law relationship between applied pressure and the fiber volume fraction, 20 the roller-fiber pressure distribution remains insufficiently explored, limiting the accurate analysis of fiber movement during drafting.
This study examines the mechanical behavior of a twisted strand held by rollers, developing a mechanical calculation model using elasticity theory to analyze the roller pressure distribution. Experimental investigations evaluate the effects of roller elasticity, diameter, strand width, and thickness on pressure distribution. A thin-film pressure sensor measures the actual force on the strand, validating the model. Additionally, the study explores how strand linear density and twist factor influence pressure distribution. These findings provide critical insights for optimizing drafting and improving fiber control. This study contributes to advancing textile manufacturing and production efficiency by refining drafting process regulations and product quality standards.
Pressure distribution calculation model
Drafting unit
The drafting unit comprises a rubber top roller and a metallic bottom roller, which together regulate fiber movement by exerting controlled pressure. In ring spinning, the input strand is twisted (roving), causing the fibers to arrange in a helical shape. Consequently, when uncompressed, the strand exhibits a circular cross-section. 21
According to Figure 1(a), the geometric structure of the top and bottom rollers can be simplified as two parallel-contacting cylinders. To facilitate the analysis, a cartesian coordinate system is established, with the contact center as the origin. In this system, the strand-feeding direction is the x-axis, the direction parallel to the roller axis is the y-axis, and the direction perpendicular to the contact area is the z-axis. (a) Top and bottom rollers forming the nip holding the strand; (b) Sectional diagram on the xy plane passing through the origin; (c) Rollers forming an elliptical contact area on the strand; (d) Pressure distribution act on the strand; (e) Deformation of the top roller. F: Total pressure applied to the top roller (N); R1, R2: Radii of the top and bottom rollers (mm); l: Length of the top and bottom rollers (mm); x: Strand feeding direction; y: Direction parallel to roller axes; z: Normal direction to the contact area; a: Half-width of roller-roller contact (mm); b: Half-width of compressed strand (mm); c: Half-width of roller-strand contact (mm); h: Thickness of compressed strand (mm); z1, z2: Indentation of the top roller.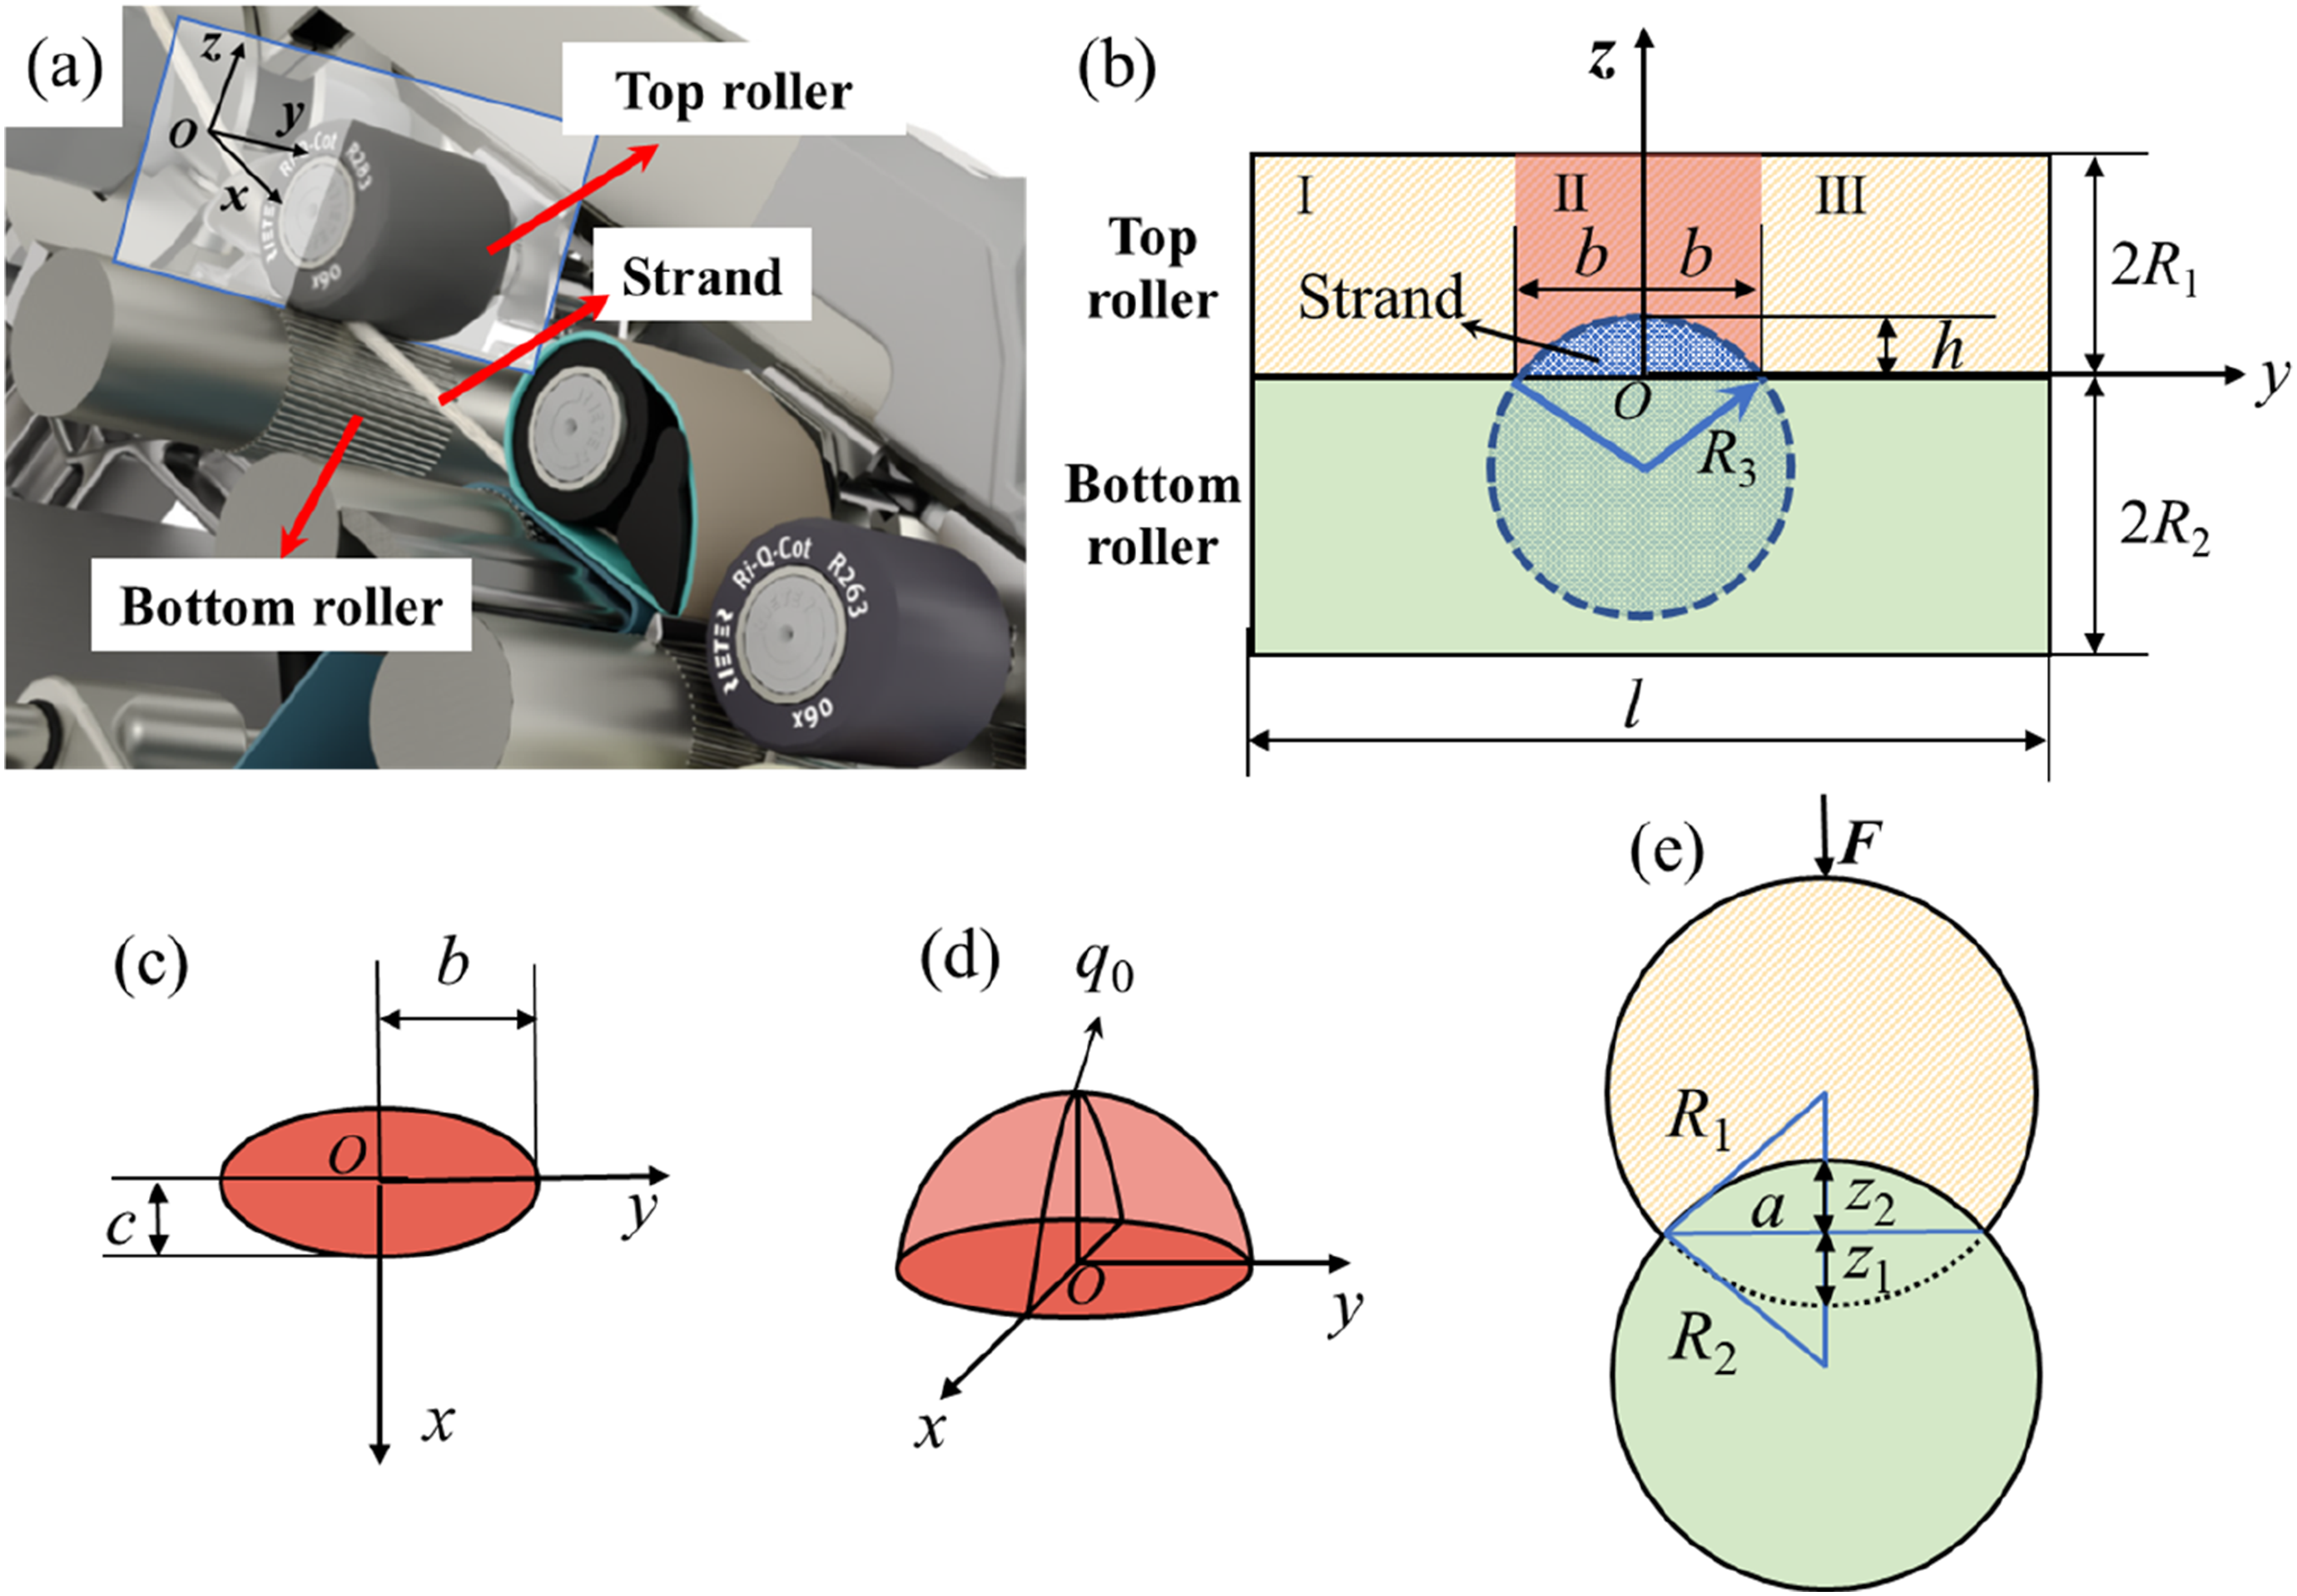
When the roller nip grips the twisted strand, the top roller exerts pressure on the strand and bottom roller. Simultaneously, the top roller undergoes elastic deformation, forming a depression, as shown in Figure 1(b) and (e). Figure 1(b) presents a sectional diagram of the xy-plane passing through the origin, providing a visual representation of the relative positions and contact interactions between the strand, top roller, and bottom roller.
As depicted in Figure 1(b), the contact area comprises three regions based on contact pairs: parts I and III are the contact areas between the top and bottom rollers, while part Ⅱ is the contact area between the roller and the strand. When the total applied pressure on the top roller is F, the applied pressures on the three contact areas have the following relationship:

Contact between the top and bottom rollers
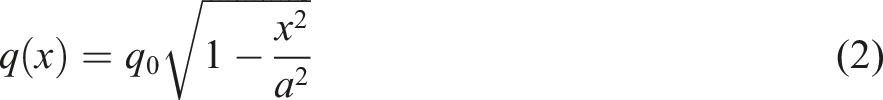
For parts I and III, the top and bottom rollers are cylinders with parallel axes and radii R1 and R2, respectively. The contact between these rollers conforms to the Hertzian elastic contact theory for cylinders. For this model, the contact pressure, q(x), is distributed on a semi-ellipse and is expressed as
22
The per unit length pressure

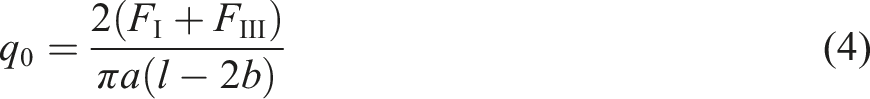
According to Hertzian contact theory, a contact area formed between the top and bottom rollers is a strip area with a width of 2a. The half-width a of the contact area is calculated using the following equation22,23:

Here, l represents the length of the roller nip (mm); 2b denotes the width of the strand after compression (mm); μ1 and μ2 are the Poisson’s ratio of the top and bottom rollers, respectively; E1 and E2 are the elastic moduli of the top and bottom rollers, respectively (MPa); R1 and R2 are the cross-sectional radii of the top and bottom rollers (mm), respectively.
As illustrated in Figure 1(b), the top roller undergoes deformation, and the distance between the centers of the top and bottom rollers is reduced, as shown in Figure 1(e). The indentation of the top roller, defined as the approach distance h0, is
23
:

Equation (2) expresses the pressure distribution model for the contact between the top and bottom rollers. This equation indicates that the contact pressure is highest at the contact center, gradually decreasing towards its edges. This distribution is crucial for understanding the interaction between the top and bottom rollers and the pressure distribution exerted on the strand.
Contact between the roller and strand
The contact area between the roller and strand corresponds to part II in Figure 1(b). As the bottom roller is a metal cylinder and the top roller is a rubber cylinder, the compressed strand adopts an arc-like cross-sectional shape, as shown in Figure 1(b). If this arc is considered part of a circle, then contact between the top roller and the strand can be regarded as an orthogonal contact between the two cylinders. Based on the geometric relationship, the radius R3 of the circle in which the cross-section of the strand lies can be calculated using the following equation:

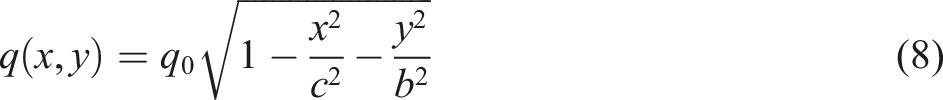
When the rollers grip the twisted strand during the drafting process, the pressure exerted on the strand is non-uniform. According to the elastic contact theory, when two cylinders are in orthogonal contact, the resulting pressure distribution is a semi-ellipsoid, as shown in Figure 1(d). The pressure distribution under this contact condition can be expressed as
22

Hence, the maximum compressive stress at the contact center between the roller nip and strand is

When the two cylinders are in orthogonal contact, their contact areas form an ellipse. Therefore, the contact area between the top roller and strand is as shown in Figure 1(c). The elliptical parameter e can be obtained using the following equation
22
:

In this case, one elliptical axis is half the compacted strand width, denoted as b. The other axis, c (where c > a), can be determined based on the width of the compacted strand, expressed as

Combined with equation (7), the maximum surface indentation, hmax, of the top roller can be derived as
24

Equation (8) represents the pressure distribution of the top roller acting on the strand. The contact pressure reaches its maximum at the center of the contact ellipse and gradually decreases towards the edges.
The pressure distribution is calculated using the aforementioned equations. Further experiments are required to verify the established model.
Experiment
Materials
The experiment used a ring-spinning frame and involved three components—fiber, top, and bottom rollers. Polyester fibers were selected because of their widespread use in the textile industry, attributed to their excellent physical properties and cost-effectiveness. 25 During the experiment, the fibers became compacted when the roller nip gripped the twisted polyester strand, reducing the void spaces and increasing the density and elastic modulus of the polyester strand. This state led to the convergence of Poisson’s ratio and elastic modulus of the polyester strand with those of the polyester fibers. 26
The textile industry has a specific relationship between the elastic modulus E1 (MPa) and hardness HA of the rubber roller, which is expressed as follows
27
:


Total pressure and pressure distribution
The measurement methods for the front and rear roller nips were consistent. For clarity, the measurement demonstration was conducted in the front roller nip to present the experimental setup and procedures effectively.
As shown in Figure 2(a), a roller dynamometer measured the total pressure applied to the top roller. A thin-film pressure sensor was used to measure the pressure distribution generated by the contact,
30
as shown in Figure 2(b). Measurements were repeated five times to minimize random errors, and the average value was used as the final result. (a) Roller dynamometer for total pressure measurement; (b) Thin-film pressure sensor for pressure distribution measurement; (c) Thin-film pressure sensor and its force-bearing area A.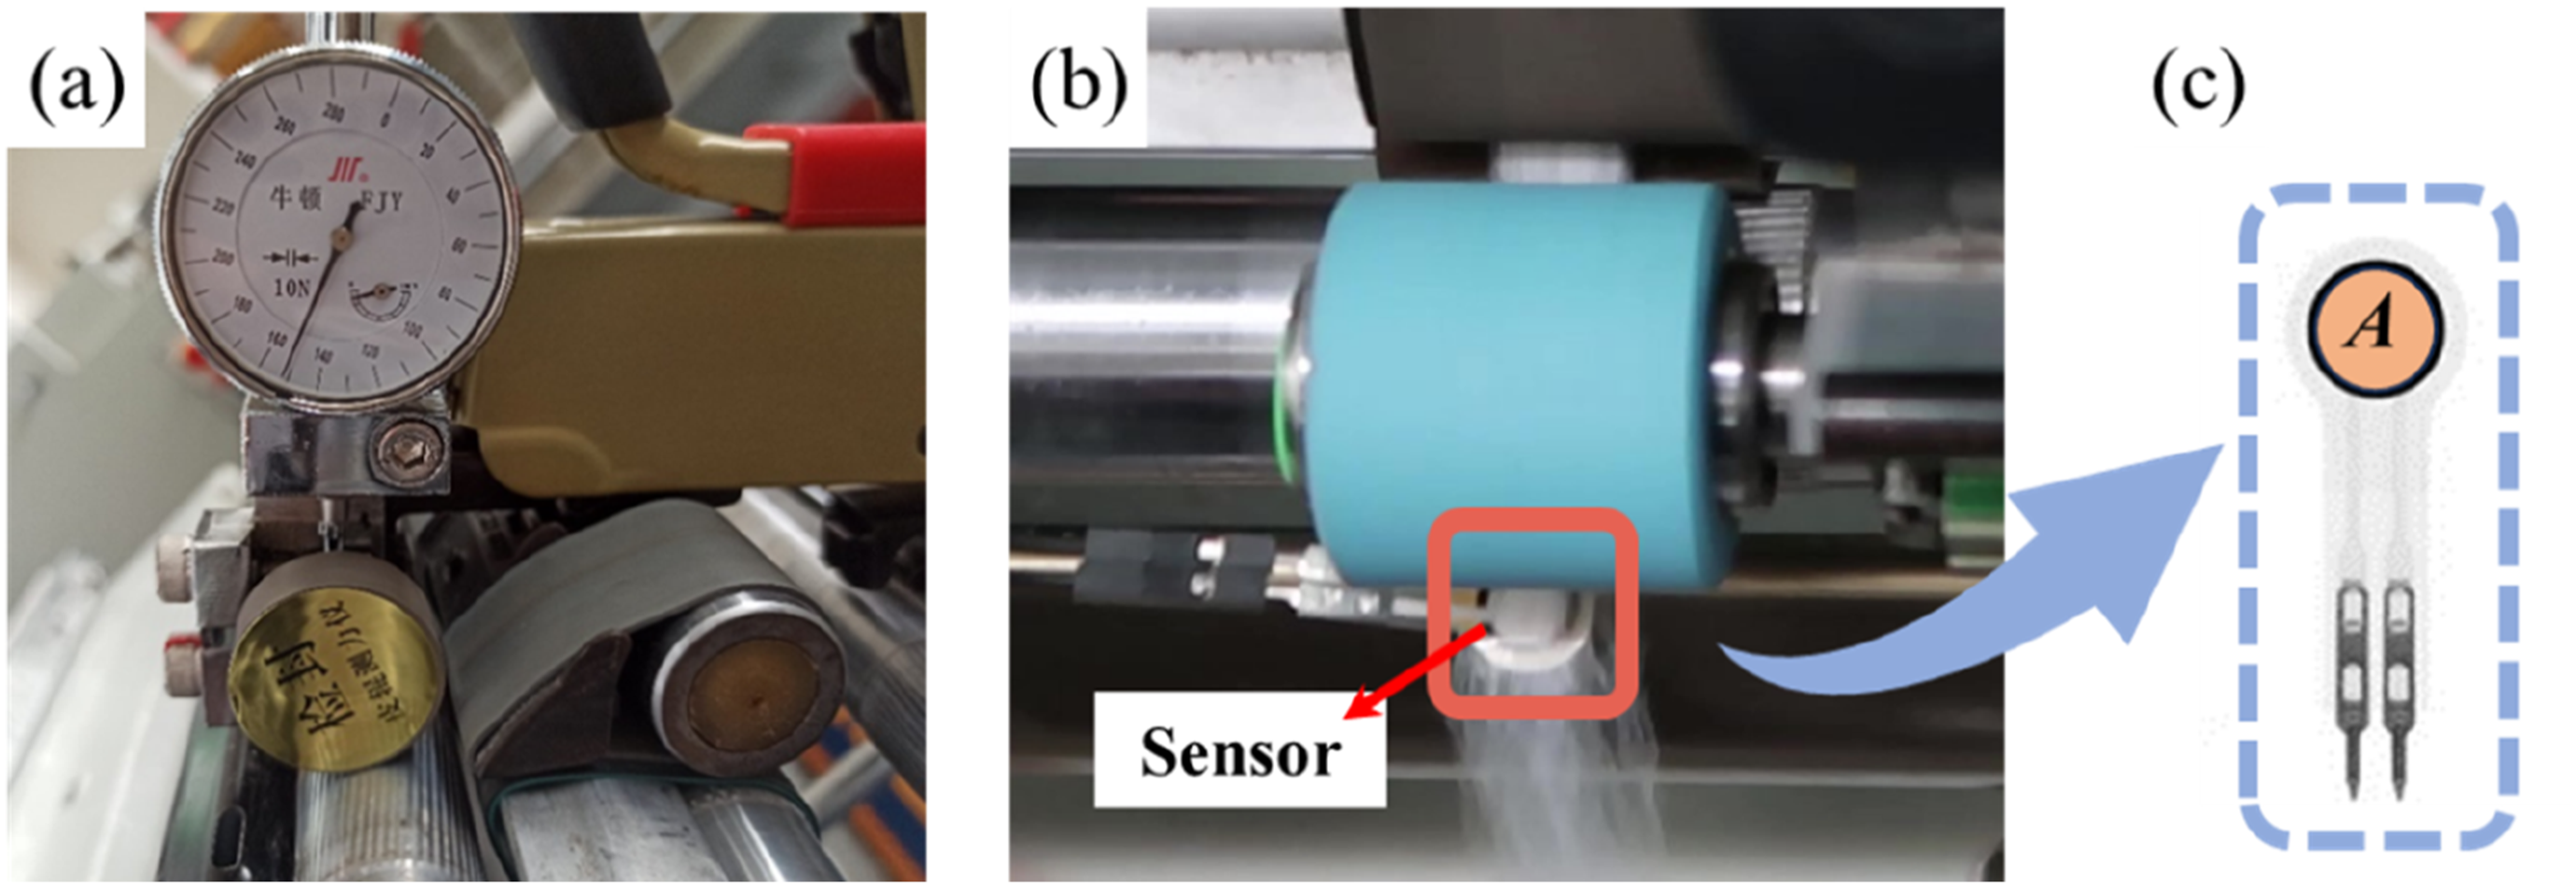
The area A of the thin-film pressure sensor is marked orange in Figure 2(c). The measured pressure σ
m
(N) corresponds to the resultant force σ
c
acting on the area A, which can be calculated using the following equation:
Width and thickness of the compressed strand
The width of the compressed strand was measured using a millimeter ruler, while its thickness was measured using a vernier caliper.
Result and discussion
Studies have demonstrated that strand shape significantly influences roller pressure distribution when the pressure device and magnitude are determined. 31 Strand linear density and twist factor (a relative value combining strand linear density to represent the twist level) are critical parameters in determining strand shape.18,21 Therefore, this study investigates the effects of strand linear density and twist factor on pressure distribution.
Strand linear density
A total pressure was maintained at 190 ± 5 N.
32
Polyester strands with different linear densities, each with a twist factor of 95, were held using the same roller nip of the ring frame. The width 2b and thickness h of the compressed strands were measured, with the results shown in Figure 3(a). The results indicated that both 2b and h increased proportionally with increasing linear density. Twisted strand of different linear densities with a twist factor of 95 held by the roller nip: (a) Measurements of 2b and h; (b) Calculations and measurements of c and σ; (c) Calculations of 
Using the measured strand thickness and width, the half-width, c c , of the contact area between the roller, strand and the resultant force, σ c , exerted on this area were calculated using equations (12) and (15). These calculated results were then compared with the measured results, c m and σ m . A t-test was conducted to evaluate the statistical significance of the differences between the calculated and measured values of c and σ. The p-values obtained were 0.651 for c and 0.405 for σ, both exceeding 0.05, indicating no statistically significant difference. This finding suggests strong agreement between the calculated and measured results within the range of experimental error.
As shown in Figure 3(b), the calculated and measured pressure values reveal a high consistency. Additionally, this figure illustrates that as the strand linear density increases, c increases, leading to a corresponding rise in σ.
As the total pressure remains constant when the roller nip grips the twisted strand, the thickness of the strand causes pressure to concentrate in the contact area between the roller and strand, 33 as evident in Figure 3(b). The pressure exerted on the strand for the same area was greater than that exerted on the bottom roller, resulting in a broader contact width between the top roller and strand than between the top and bottom rollers. Moreover, compared to the measured values, the calculated deviations for c and σ were 7.23% and 7.71%, respectively. Both deviations were insignificant. These results confirm the effectiveness of the proposed pressure distribution calculation.
The applied pressure,
Strand twist factor
A total pressure was maintained at 190 ± 5 N.
32
Polyester strands with different twist factors and a constant linear density of 1000 tex were held by the same roller nip of the ring frame. The measured width 2b and thickness h of the compressed strands are presented in Figure 4(a). The results show that as the twist factor increases, h increases while 2b decreases. Under similar conditions, a higher twist factor reduces gaps between the fibers and a tighter fiber arrangement. This finding enhances the resistance of the strand to pressure-induced deformation, causing an increase in thickness and a decrease in width. Twisted strand of different twist factors with a linear density of 1000 tex held by roller nip: (a) Measurements of 2b and h; (b) Calculations and measurements of c and σ; (c) Calculations of 
Based on the measured thickness and width of the twisted strand, the half-width of the contact area between the roller nip, strand, c c , and resultant force exerted on this area, σ c , were calculated using equations (12) and (15), respectively. These calculated values were compared with the measured values, c m and σ m . Furthermore, a t-test was conducted to evaluate the statistical significance of the differences between the calculated and measured values of c and σ. The p-values obtained were 0.584 for c and 0.931 for σ, both exceeding 0.05, indicating no statistically significant difference. This further validates the reliability of the proposed pressure distribution calculation method for strands with different twist factors.
Figure 4(b) shows that as the strand twist factor increases, c and σ initially increase before stabilizing. The calculated deviations of c and σ were 9.58% and 7.55%, respectively. Both were insignificant. This finding confirms the reliability of the proposed method for calculating pressure distribution in twisted strands held by the roller nip.
Equations (10) and (13) were used to calculate the pressure
Thus, the calculated results of the proposed model closely align with the measured results. Therefore, the model can effectively calculate the pressure distribution between the roller and twisted strand during drafting.
Unlike previous studies on non-twisted strands,12,15 which reported uniform pressure distributions, our model revealed stress concentration owing to helical fiber alignment in twisted strands. At a twist factor of 185, compressive stress q 0 increases by 14.7% compared to a twist factor of 65, highlighting the role of twist on pressure distribution. This result aligns with the observation of Yang et al., 21 who noted tighter fiber arrangements in twisted strands but did not quantify stress distribution.
Conclusion
This study developed a calculation model to analyze pressure distribution during the drafting process in a ring frame, specifically for roller-gripped twisted strands. The model was validated through meticulous experiments, demonstrating excellent agreement with measured results, with a maximum deviation of only 9.58%. The results indicate that increasing strand linear density leads to a more uniform pressure distribution, whereas a higher twist factor causes pressure concentration.
These findings are essential for optimizing drafting parameters and controlling fiber movement, ultimately enhancing product quality. Future research could refine the model by incorporating more influencing factors such as fiber type and roller surface properties, further improving precision in controlling and predicting drafting dynamics.
Statements and declarations
Footnotes
Funding
The author(s) disclosed receipt of the following financial support for the research, authorship, and/or publication of this article: This project was supported by the Fundamental Research Funds for the Central Universities and Graduate Student Innovation Fund of Donghua University (CUSF-DH-D-2023025), National Natural Science Foundation of China (52173032), and Shanghai Frontier Science Research Center for Modern Textiles, Donghua University, China.
Conflicting interests
The author(s) declared no potential conflicts of interest with respect to the research, authorship, and/or publication of this article.