
Abstract
The interface and porosity play important roles in determining the damage of C/C composites (C/Cs). This study presents a novel finite element model that incorporates cohesive elements with porosity. Based on this model, numerical analyses were conducted to investigate the axial compressive damage of C/C composites with orthogonal woven structure (3DOW) and fine weave pieced (3DFWP) structures, both of which are 3D woven structures. The results indicate that damage initially occurs at the interface, and axial fiber damage is the decisive factor in material failure. The pores at the interface have little effect on the failure of C/Cs. Eliminating the pores within the fibers significantly improves the compression performance of the material, and the strengths of the two structural models increase by 28% and 6%.
Introduction
Due to low density, high strength, and excellent thermal stability, Carbon/Carbon composites (C/Cs) have been widely employed in various extreme operational environments, such as spacecraft braking slots 1 and rocket nozzles. 2 Compared to felt-based C/Cs, 3D woven C/Cs exhibit superior interlaminar properties 3 and specific directional mechanical performance. To ensure densification efficiency and material performance, a composite production process of “chemical vapor deposition (CVD) + precursor infiltration and pyrolysis (PIP)” is commonly employed. During the densification process, pores and cracks are unavoidably generated due to incomplete gas penetration, 4 resin shrinkage, 5 and high-temperature heat treatment. 6
The mapping relationship between porosity and the mechanical properties of C/Cs has always been a focus of researchers. In the fabrication of C/Cs, variations in the structure of the preform initially lead to differences in the porosity structure. Compared to needle puncture structure, 2D stitching structure enhances the compressive strength and interlaminar shear strength but reduces the tensile strength and flexural strength. 7 Li et al. 8 analyzed the damage process of C/Cs preforms subjected to 3D puncture and needle puncture. The results suggest that defects generated by puncture are the main cause of crack formation during the loading process. In our previous work, 9 the mapping relationships between the structure, pore evolution, and macroscopic performance of three types of 3D orthogonal C/C preform structures were investigated. The puncture structure compromises the integrity of the structure, thereby reducing the compressive strength of the composite. Stefan et al. 10 suggested that the structural level of macropores generated during the process of modifying C/Cs with thermoplastic precursors affect the mechanical properties of the composite materials. Yu et al. 11 studied the effect of pore distribution at different stages of the PIP process on mechanical properties and proposed that intrabundle pores are the primary cause of compressive damage in C/Cs. The pyrolysis temperature of the precursor can also lead to differences in porosity structure and mechanical properties. 12 As the pyrolysis temperature increases, the volume of pores decreases, leading to an increase in the flexural strength of the composite. Xue et al. 13 demonstrated that with the increase in heat treatment temperature, the porosity of C/Cs rises, the texture becomes more uniform, and the mechanical properties decrease. Unfortunately, commonly used observation methods for the pore structure of C/Cs, such as polarized light microscopy (PLM), 14 scanning electron microscopy (SEM), 15 and micro-CT, 16 often face challenges in balancing structural integrity and high precision. Additionally, due to the high modulus and stiffness, it is challenging to observe the mechanical damage and failure process of C/Cs in real-time. Therefore, simulation methods are considered for analyzing the mechanical properties and damage evolution of C/Cs.
Currently, some scholars have used experimental and numerical simulations to predict the mechanical properties of C/Cs. Yao et al. 17 numerically analyzed the influence of axial yarn content and fiber volume fraction on the out-of-plane compressive performance of fine weave pierced C/Cs based on statistical information. To improve the realism of the model, the porosity of C/Cs is considered in some studies. Zhang et al. 18 considered the distribution of pores on the surface of composites and established a predictive model for cutting forces in needle-punched 2.5D C/Cs. Qi et al. 19 proposed a new representative volume element (RVE) model that approximates irregular pores as polygons, used to predict the transverse elastic properties of unidirectional (UD) C/Cs. Chao et al. 20 combined microstructure information with a modified RSA algorithm to efficiently generate RVEs, used for predicting the influence of porosity on the elastic properties of unidirectional and felt-based C/Cs. Ai et al. 21 predicted the effect of defects on the tensile strength of 3D orthogonal C/Cs based on statistical analysis of μ CT data. They consider defects in the fibers to have a more significant impact on the mechanical properties of C/Cs compared to defects in the matrix and interfaces. These studies lack interface debonding or damage between the fibers and matrix under loading. Therefore, cohesive elements were attempted to be incorporated into the model. Alessandro et al. 22 employed a dual-stage approach based on the cohesive zone model to evaluate and predict the structural integrity of 2.5D laminated C/Cs. Composite interlaminar properties and fiber-matrix (F/M) damage are analyzed through tensile and double cantilever beam tests. Ge et al. 23 employed a bilinear cohesive constitutive model to characterize interfacial properties and compared the predicted elastic characteristics of unidirectional and felt-based C/Cs based on interfacial stiffness and porosity analysis. Chao XJ et al. 24 simulated the interface fracture process of UD-C/Cs using an eight-node zero thickness cohesive element. Additionally, they 25 analyzed the influence of porosity on the bending performance of 2D C/Cs based on progressive damage criteria, using a model established with cohesive elements inserted between adjacent layers. Rajneesh et al. 26 predicted the tensile modulus of 3D C/Cs based on a frictional cohesive interface model but overlooked the pores in the geometric structure due to computational complexity. Overall, using cohesive elements for interface modeling is reliable for improving the accuracy of predicting the mechanical properties of C/Cs. However, numerical studies on the mechanical properties of 3D woven C/Cs based on both porosity and cohesive interface remain limited.
This study innovatively combines porosity and interfacial cohesive elements to numerically analyze the axial compressive damage process of 3D woven C/Cs. Attempt to reveal the differences in the damage process of 3D woven C/Cs with different forming methods. The porosity at different locations of the composite was obtained based on image recognition processing. Based on statistical information, Finite element models (FEM) with different structures containing pores and interlayer cohesive elements were established. Then, the accuracy of the model was verified through Z-direction compression tests. Additionally, the influence of preform structure and porosity at different locations on the compression damage of C/Cs was discussed.
Experiment
Materials and samples
As the two most common preform structures in 3DC/C composites, 3D orthogonal woven (3DOW) and 3D fine weave pierced (3DFWP) structures have been widely used in the fields of aerospace and transportation.27–29 Two types of C/Cs formed using the 3DOW and 3DFWP molding techniques are explored in the paper. The two types of C/Cs composites were designated as 1# and 2#. Figure 1 displays process diagrams of the two types of C/Cs and Optical images of their cross-sections after the first CVI cycle. The X and Y-direction carbon fibers (CF) are interleaved around the Z-direction CF layer by layer, and the fabric is tightened to form the 3DOW structure. The X and Y-direction unidirectional CF layers are interleaved through Z-direction steel needles layer by layer. Subsequently, the CF replaces the steel needles and is introduced into the preform thickness direction, forming the 3DFWP structure. The two preforms were densified through 120 hours of chemical vapor infiltration (CVI) at 950°C and four cycles of precursor infiltration and pyrolysis (PIP). To improve the texture, the composites were graphitized at 2700°C. The structural information of the two types of C/Cs preforms is presented in Table 1. (a) Fabrication process diagram of Sample 1#, (b) detailed morphology of Sample 1#, (c) Fabrication process diagram of Sample 2#, (d) detailed morphology of Sample 2#. Structural information.

Structural information statistics
The two types of 3D C/Cs are formed by the periodic integration of woven structural units. Based on Optical images, in the 3DOW structure, the CFs are compressed against each other and evenly stressed, resulting in cross-sections of fibers in different directions appearing approximately rectangular in shape. In the 3DFWP structure, the CFs in the Z-direction are located within circular holes formed by needle piercing, resulting in the cross-sections of the Z-direction CFs appearing approximately circular. Additionally, the steel needles pierce and stretch the XY-direction fiber layers, creating a region of approximately triangular-shaped pores. The two sides of the triangle, formed by the stretched yarns, should be tangent to the circular cross-section of the axial fibers.
Microscopic images of the cross-sections of both types of C/Cs after 24 hours of CVI were analyzed using ImageJ software to accurately determine their geometric parameters while preserving structural integrity. Fiber bundle dimensions were extracted from specific areas of interest in PLM images, while pore data between fiber bundles were extracted from SEM images. The dimensions of fiber length (L), width (W), height (H), gap (G), and the side length or diameter of Z fiber (ZF) were measured and recorded. Each dimension type was sampled at least 50 times, and the average values were calculated, as depicted in the Figure 2 (taking sample 2# as an example). The statistical results are depicted in the figure, and the dimensional data of the structural units for both types of C/Cs are detailed in the Table 2. Based on the dimension data, the fiber volume fractions (FVF) for structure units of 1# and 2# are calculated as 47.2% and 49.1%, respectively. The differences in FVF between the two types of C/C preforms are 0.2% and 1.1%, respectively, thereby confirming the accuracy of the dimension data extraction. The larger error in Sample 2# might be due to the difficulty in accurately determining the FVF of the triangular pore region. (a) Dimensional data extraction, (b) Structural information statistics. Structural information data.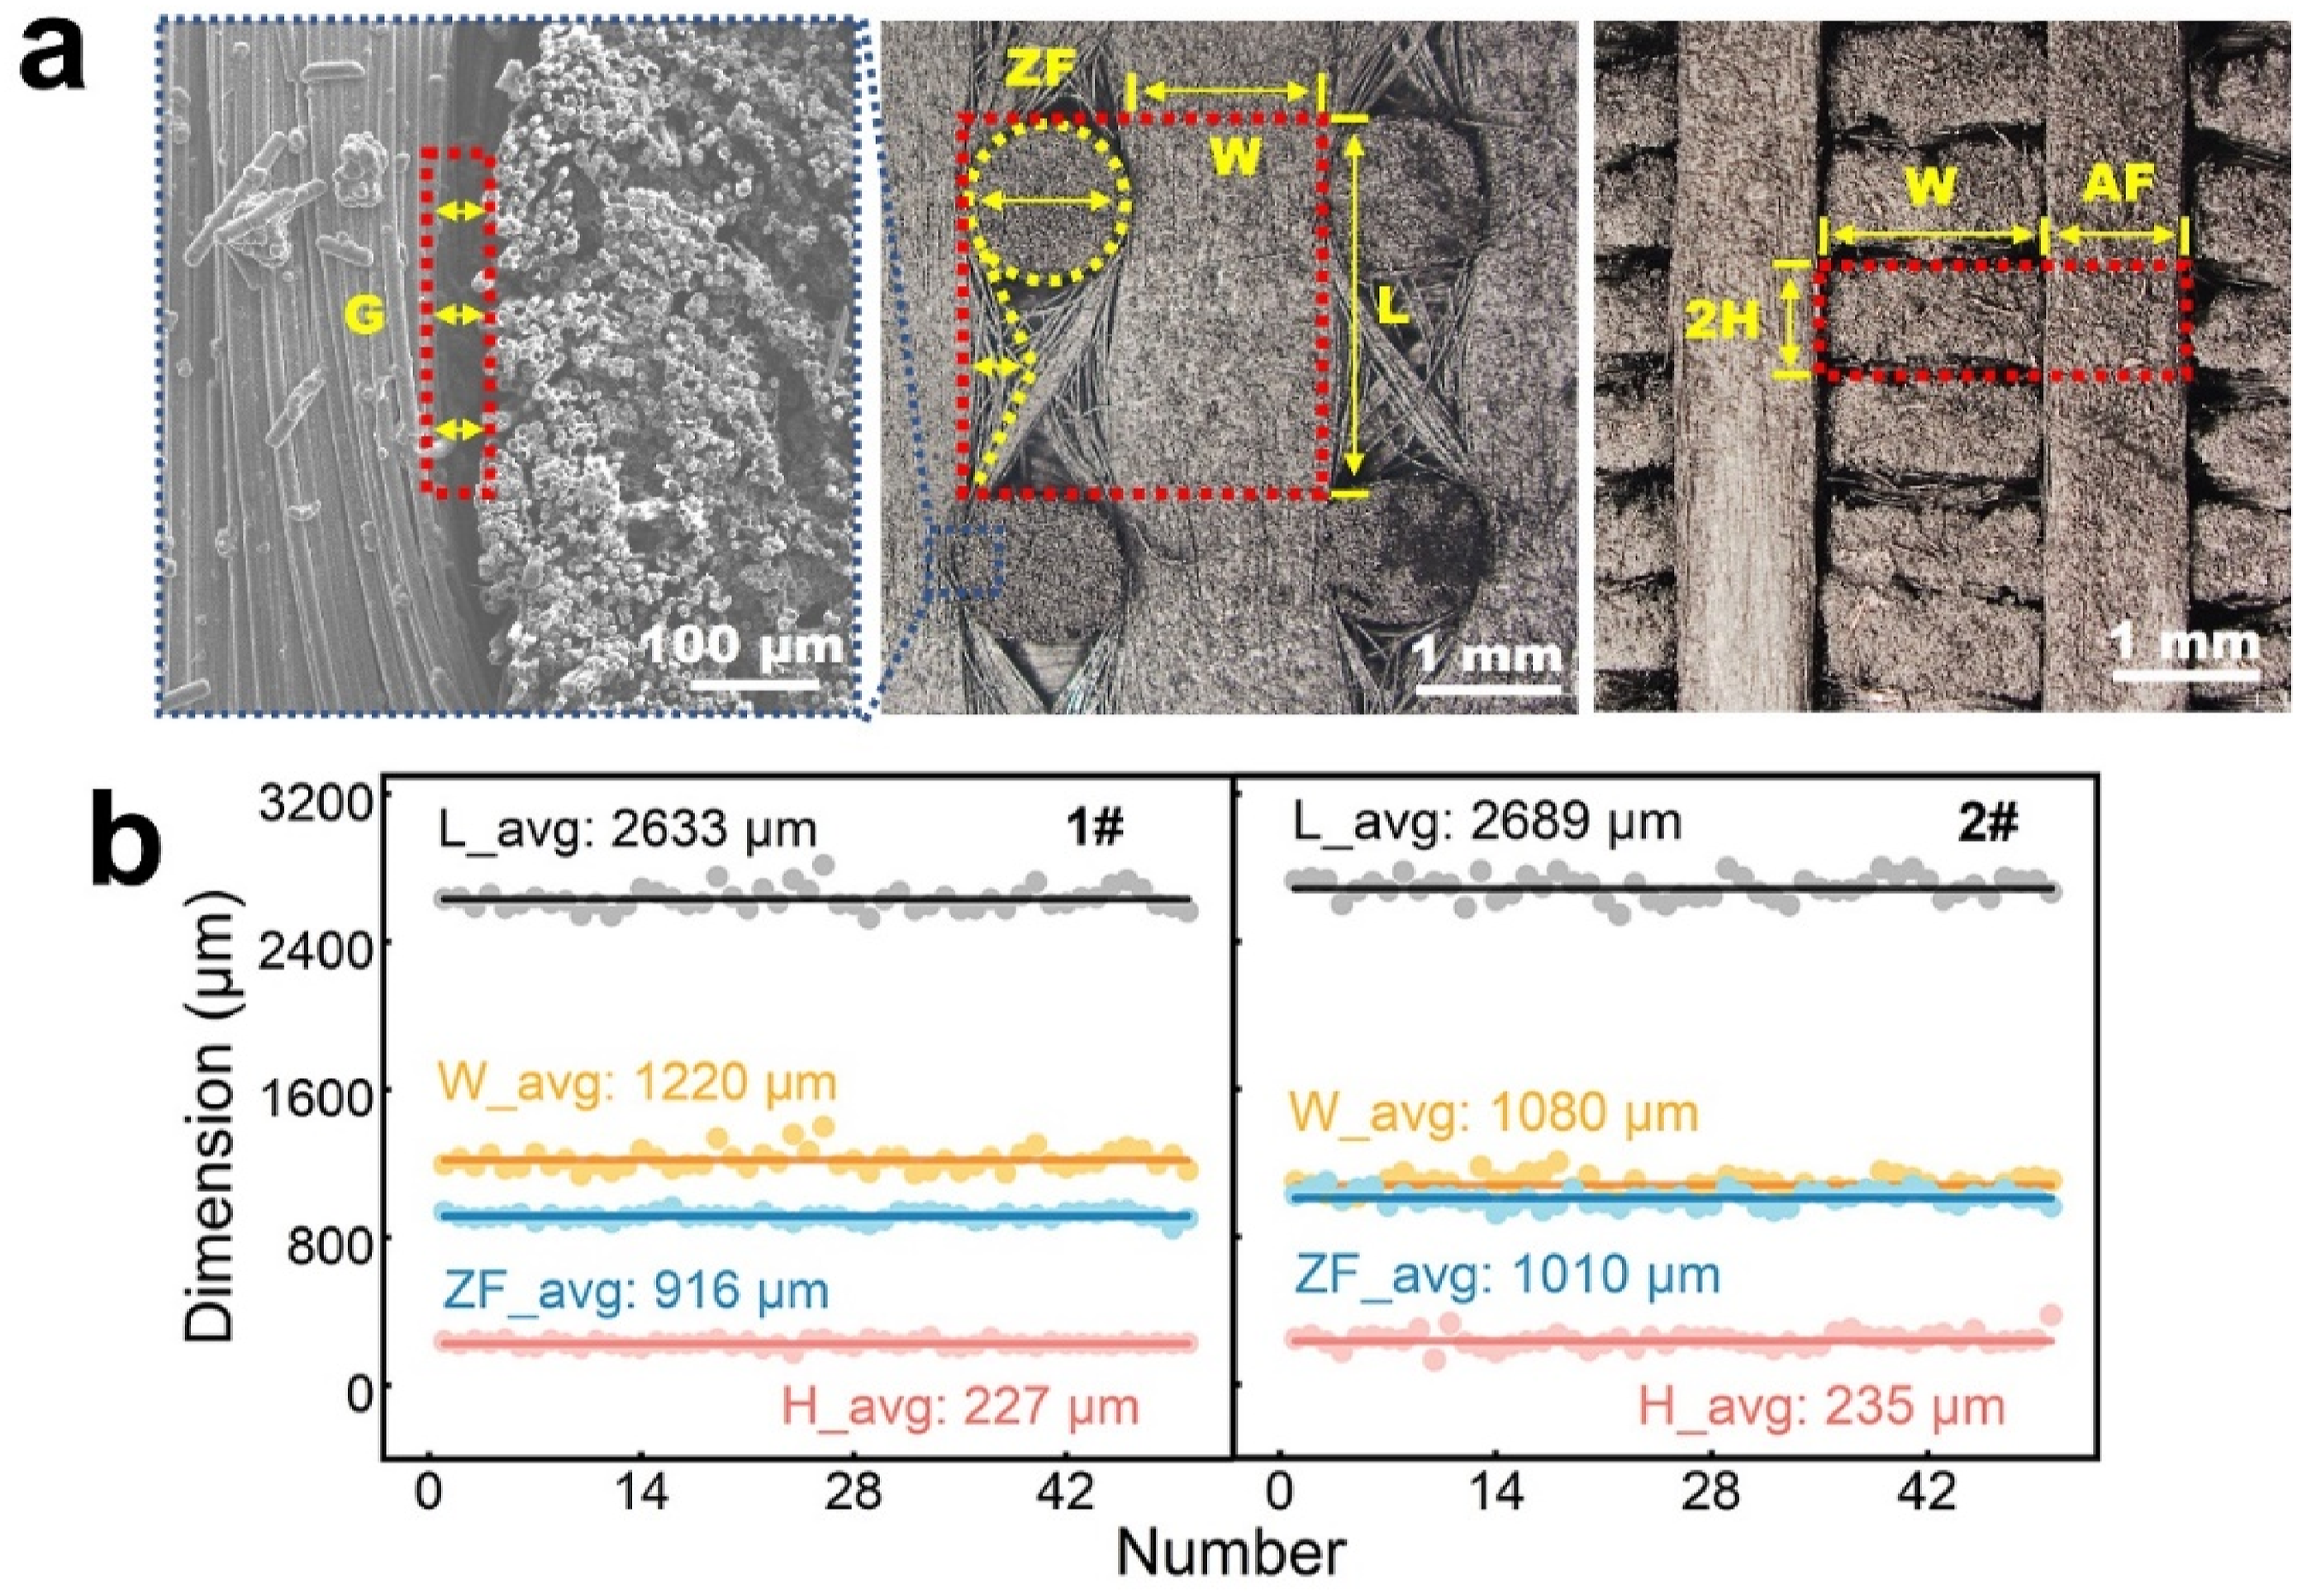

Structural information data.

Performance testing
Axial Compression Testing was performed on C/Cs using a ZwickRoell Z100 mechanical testing machine. The samples, with dimensions of 10 mm × 10 mm × 10 mm, were tested under a loading rate of 1 mm/min. To minimize error, each sample was subjected to five tests.
FEM simulation
This section introduces the specific process of finite element simulation. 3D finite element models based on porosity and cohesive interfaces were innovatively established. Using the Hashin failure criterion and maximum stress criterion, the compressive performance of two types of 3D woven C/C structures was obtained through User-Defined Field (USDFLD) and Python script programs in the commercial finite element software Abaqus. The impact of porosity on the compressive performance of C/Cs was analyzed by varying the pore locations. The specific process of simulation and calculation is illustrated in the Figure 3. Simulated calculation process.
3D finite element model
Based on the statistically obtained size data and porosity, the minimum repeatable representative volume elements (RVEs) of the two types of C/Cs were constructed in Abaqus software, as illustrated in the Figure 4. The model was meshed using 8-node linear brick elements, with reduced integration and hourglass control applied. The interface between fibers and matrix was meshed using COH3D8 cohesive elements. The mesh numbers for models 1# and 2# are 230838 and 234649, respectively, with node numbers of 250529 and 256170. Both types of C/Cs are orthotropic materials, and the mechanical behavior of different fiber bundles/layers is accurately described by defining global coordinates and discrete directions. Geometric models of two 3D woven C/Cs (1: 1#, 2: 2#), (a) RVE model, (b) CF yarns, (c) Matrix carbon, (d) F/M interface with cohesive elements, (e) Pores in the models.
The fibers, matrix, and interfaces in the 3D FEM model were separately grouped into sets. Using a Python script based on the Monte Carlo algorithm, 21 elements were randomly selected and removed from different sets in proportions matching the actual porosity to create a FEM model with accurate porosity. The schematic diagram of the removed pores in the model is shown in the Fig. A rigid platen was applied to both the upper and lower surfaces subjected to compression forces to simulate the actual compression test. The rigid platen was modeled using 4-node curved shell element (S4R in Abaqus/Standard (2014a)) with hourglass control.
Damage initiation criteria and stiffness degradation
Damage initiation criteria
The compression failure process of C/Cs primarily includes fiber damage, matrix cracking, and interface debonding. 30 For fiber-reinforced composites, common criteria for determining initial strength failure include the Tsai-Wu criterion, Hashin criterion, maximum stress criterion, and maximum strain criterion. Currently, the Hashin criterion has been widely used for predicting fiber damage and has been proven to be highly accurate. 31 This study utilizes the Hashin failure criterion to assess yarn damage. The fiber yarn was in the L–T–Z coordinate system, L and T (Z) are parallel and perpendicular to fiber bundle directions.
The tensile damage in the fiber bundle along the L direction is as follows:
The compressive damage in the fiber bundle along the L direction is as follows:
The tensile and shear damage in the fiber bundle along the T and Z directions are as follows:
The compressive and shear damage in the fiber bundle along the T and Z directions are as follows: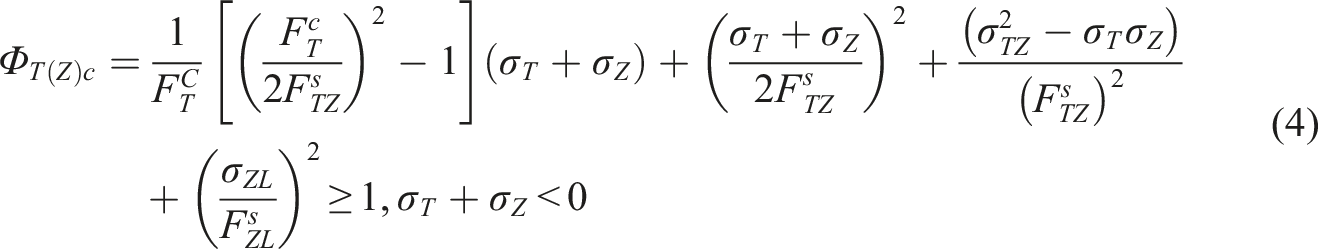
The initial damage of the matrix is determined using the maximum stress criterion, expressed as follows: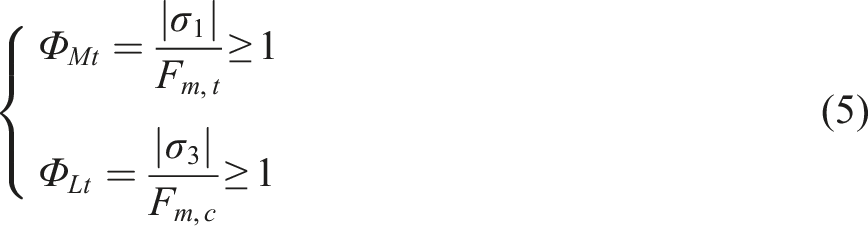
Interlaminar cohesive models
The interface between CF and the carbon matrix is defined by a cohesive element with a thickness of 0.01. The interface is considered an independent material that connects CF and the carbon matrix, with an independent cohesive mixed-mode (I + II + III). Assuming that a linear elastic traction-separation behavior is used for the damage initiation criteria, as shown in the Figure 5.
32
(a) Coordinate axes and (b) assumed traction-displacement relationship under mixed fracture mode.
In the model, the initial failure is predicted using the nominal quadratic stress criterion, expressed as follows:
n and shear directions s and t, respectively. N, S, and T respectively represent the interlaminar normal strength and shear strengths.
When the interface meets the initial damage criteria, the damage evolution is simulated using the linear fracture energy criterion
33
:
The relative displacement for each mode can be obtained from the expression (8):
Damage evolvement
Stiffness degradation coefficient under failure mode.


Flow chart of stiffness degradation.
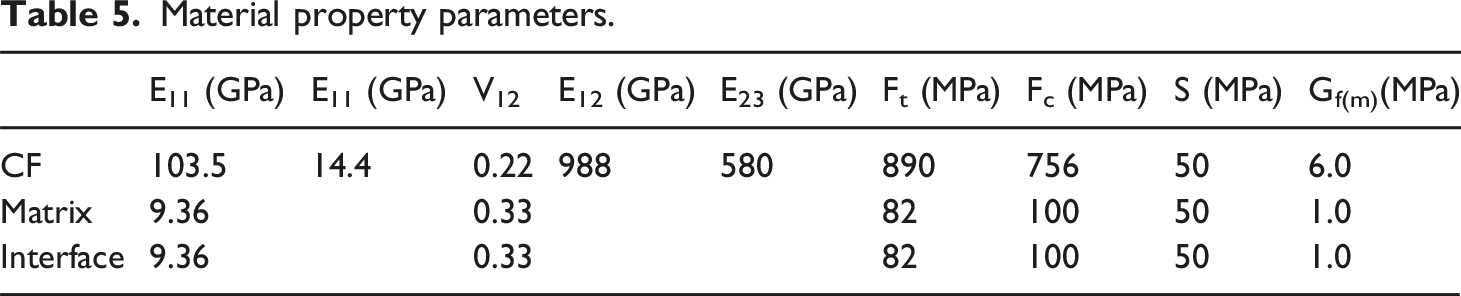
Material parameters and boundary conditions

Material property parameters.
To ensure the continuity of forces on the opposite faces of the RVE, periodic boundary conditions (PBC) were applied to the model. Therefore, during the finite element meshing process, the nodes on the opposite faces were constrained to be at the same positions. PBC were applied to the nodes of the RVE using a Python script, as detailed in the literature. 36 Sufficient displacement loads were applied to the rigid platen to ensure the failure of the model.
Results and discussion
FEM simulation results based on experimental data
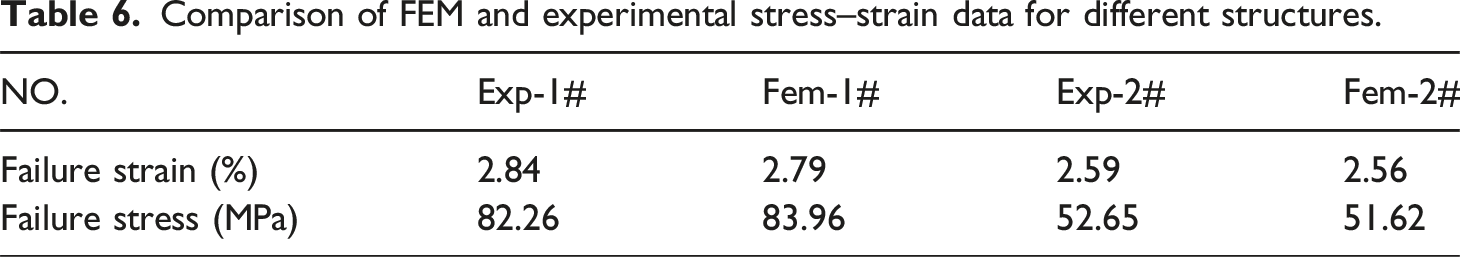
The Figure 7(a) compares the stress-strain curves obtained from experiments and simulations. Performance data from both experiments and simulations are presented in the Table 6. The axial compressive strengths from testing for Samples 1# and 2# are 82.26 MPa and 52.65 MPa, respectively, while the simulated axial compressive strengths are 83.96 MPa and 51.62 MPa, respectively. The differences between the experimental values and simulated results for the two models are 2.07% and 1.96%, respectively. The low error validates the accuracy of the established FEM model, which supports the reliability of subsequent simulations. (a) Comparison of FEM and experimental stress–strain curves for different structures, (b) Sample image after compression failure. Comparison of FEM and experimental stress–strain data for different structures.
From the failure morphologies of the two types of C/Cs (Figure 7(b)), the Sample 1#, with no extensive damage, maintained relatively intact structure. Moreover, delamination of the fiber layers oriented in the XY direction is observed. Sample 2# exhibits partial crushing at the bottom, accompanied by the delamination of a few axial fiber bundles.
The damage evolution of two types of C/Cs under compression is evident in Figure 8. Here, QUADSCRT represents the damage variable of the cohesive elements at the interfaces, SDV1 denotes the damage variable for the matrix elements, and SDV2 indicates the damage variable for the axial fibers. To reveal the overall failure process of the composite, damage nephograms were captured at three key stages: the initial damage of the elements, material failure, and the end of the compression test. Damage nephograms of finite element models based on the experimental sample: damage nephograms of (a) interface, (b) matrix and (c) carbon fibers.
Based on the simulation results, upon the initiation of the compression process, damage first appears at the interface, with stress concentrations being particularly likely at locations where multiple fibers interlace. As strain increases, damage begins to propagate from the interface into the matrix. Due to the stress transfer, the matrix surrounding the axial fibers is more likely to damaged. As strain continues to increase, damage progressively expands. When the axial fibers begin to fail, stress concentrations immediately develop at the locations of pores, with pores at fiber interlacing points being particularly prone to quicker damage. Additionally, damage to the axial fibers is a decisive factor contributing to material failure.
Comparing the damage nephograms of the two C/Cs, Sample 1# shows slower initial damage in both the interface (0.81%) and the matrix (1.85%) compared to Sample 2# (0.78% and 1.64%, respectively). After the increase of compressive strain, damage in Sample 1# primarily concentrates at the interface between the axial fibers and the matrix. In addition to the axial fiber interfaces, in Sample 2#, damage progressively extends to the interface between the XY-oriented fiber layers and the matrix. The distribution pattern of damage within the matrix is similar to that at the interface. On the other hand, initial damage in the axial fibers of Sample 1# occurs slightly faster (2.12%) compared to Sample 2# (2.19%). At the end of the compression, damage distribution in the axial fibers of Sample 1# is uneven, with large red areas surrounding the pores at fiber interlacing points. In contrast, damage within the axial fibers of Sample 2# is randomly distributed. This indicates that the structural integrity of Sample 1# fully utilizes the load-bearing capacity of the axial fibers, but it also makes the structure more prone to stress concentrations. The damage result of axial fiber failure but XY fiber layer being protected is prone to occur. Conversely, the needle-punching process used in Sample 2# results in faster initial damage to the matrix and interfaces, which easily led to large-scale matrix failure. The damage modes displayed by the stress nephograms were basically consistent with the actual compression results (Figure 7(b)).
The influence of pores within fibers on model damage
The Figure 9 illustrates the damage evolution process for the two models when pores are present only within the fibers. Due to the removal of pores in the matrix and interfaces, a slight improvement in the compressive performance of the C/Cs. The initial interface damage for the two C/Cs models has increased to 0.92% and 0.8%, respectively, while the initial matrix damage has increased to 1.99% and 1.87%, respectively. Pores cause stress concentrations, which accelerating the propagation of cracks and damage. After the pores within the interfaces and interfaces are removed, the distribution of damage, represented by the red areas, becomes more uniform. Additionally, the removal of pores in these locations has a minimal effect on the initial damage of the fibers. The initial fiber damage for the two C/Cs changes from 2.12% to 2.19% to 2.15% and 2.23%, respectively. It is noteworthy that the removal of pores within the matrix and interfaces intensifies stress concentrations within the axial fibers of Sample 1#. This is reflected in the expansion of localized damage areas within the axial fibers. In contrast, Sample 2#, where damage is randomly distributed, is almost unaffected. Damage nephograms of the model with only the pores within the fibers: damage nephograms of (a) interface, (b) matrix and (c) carbon fibers.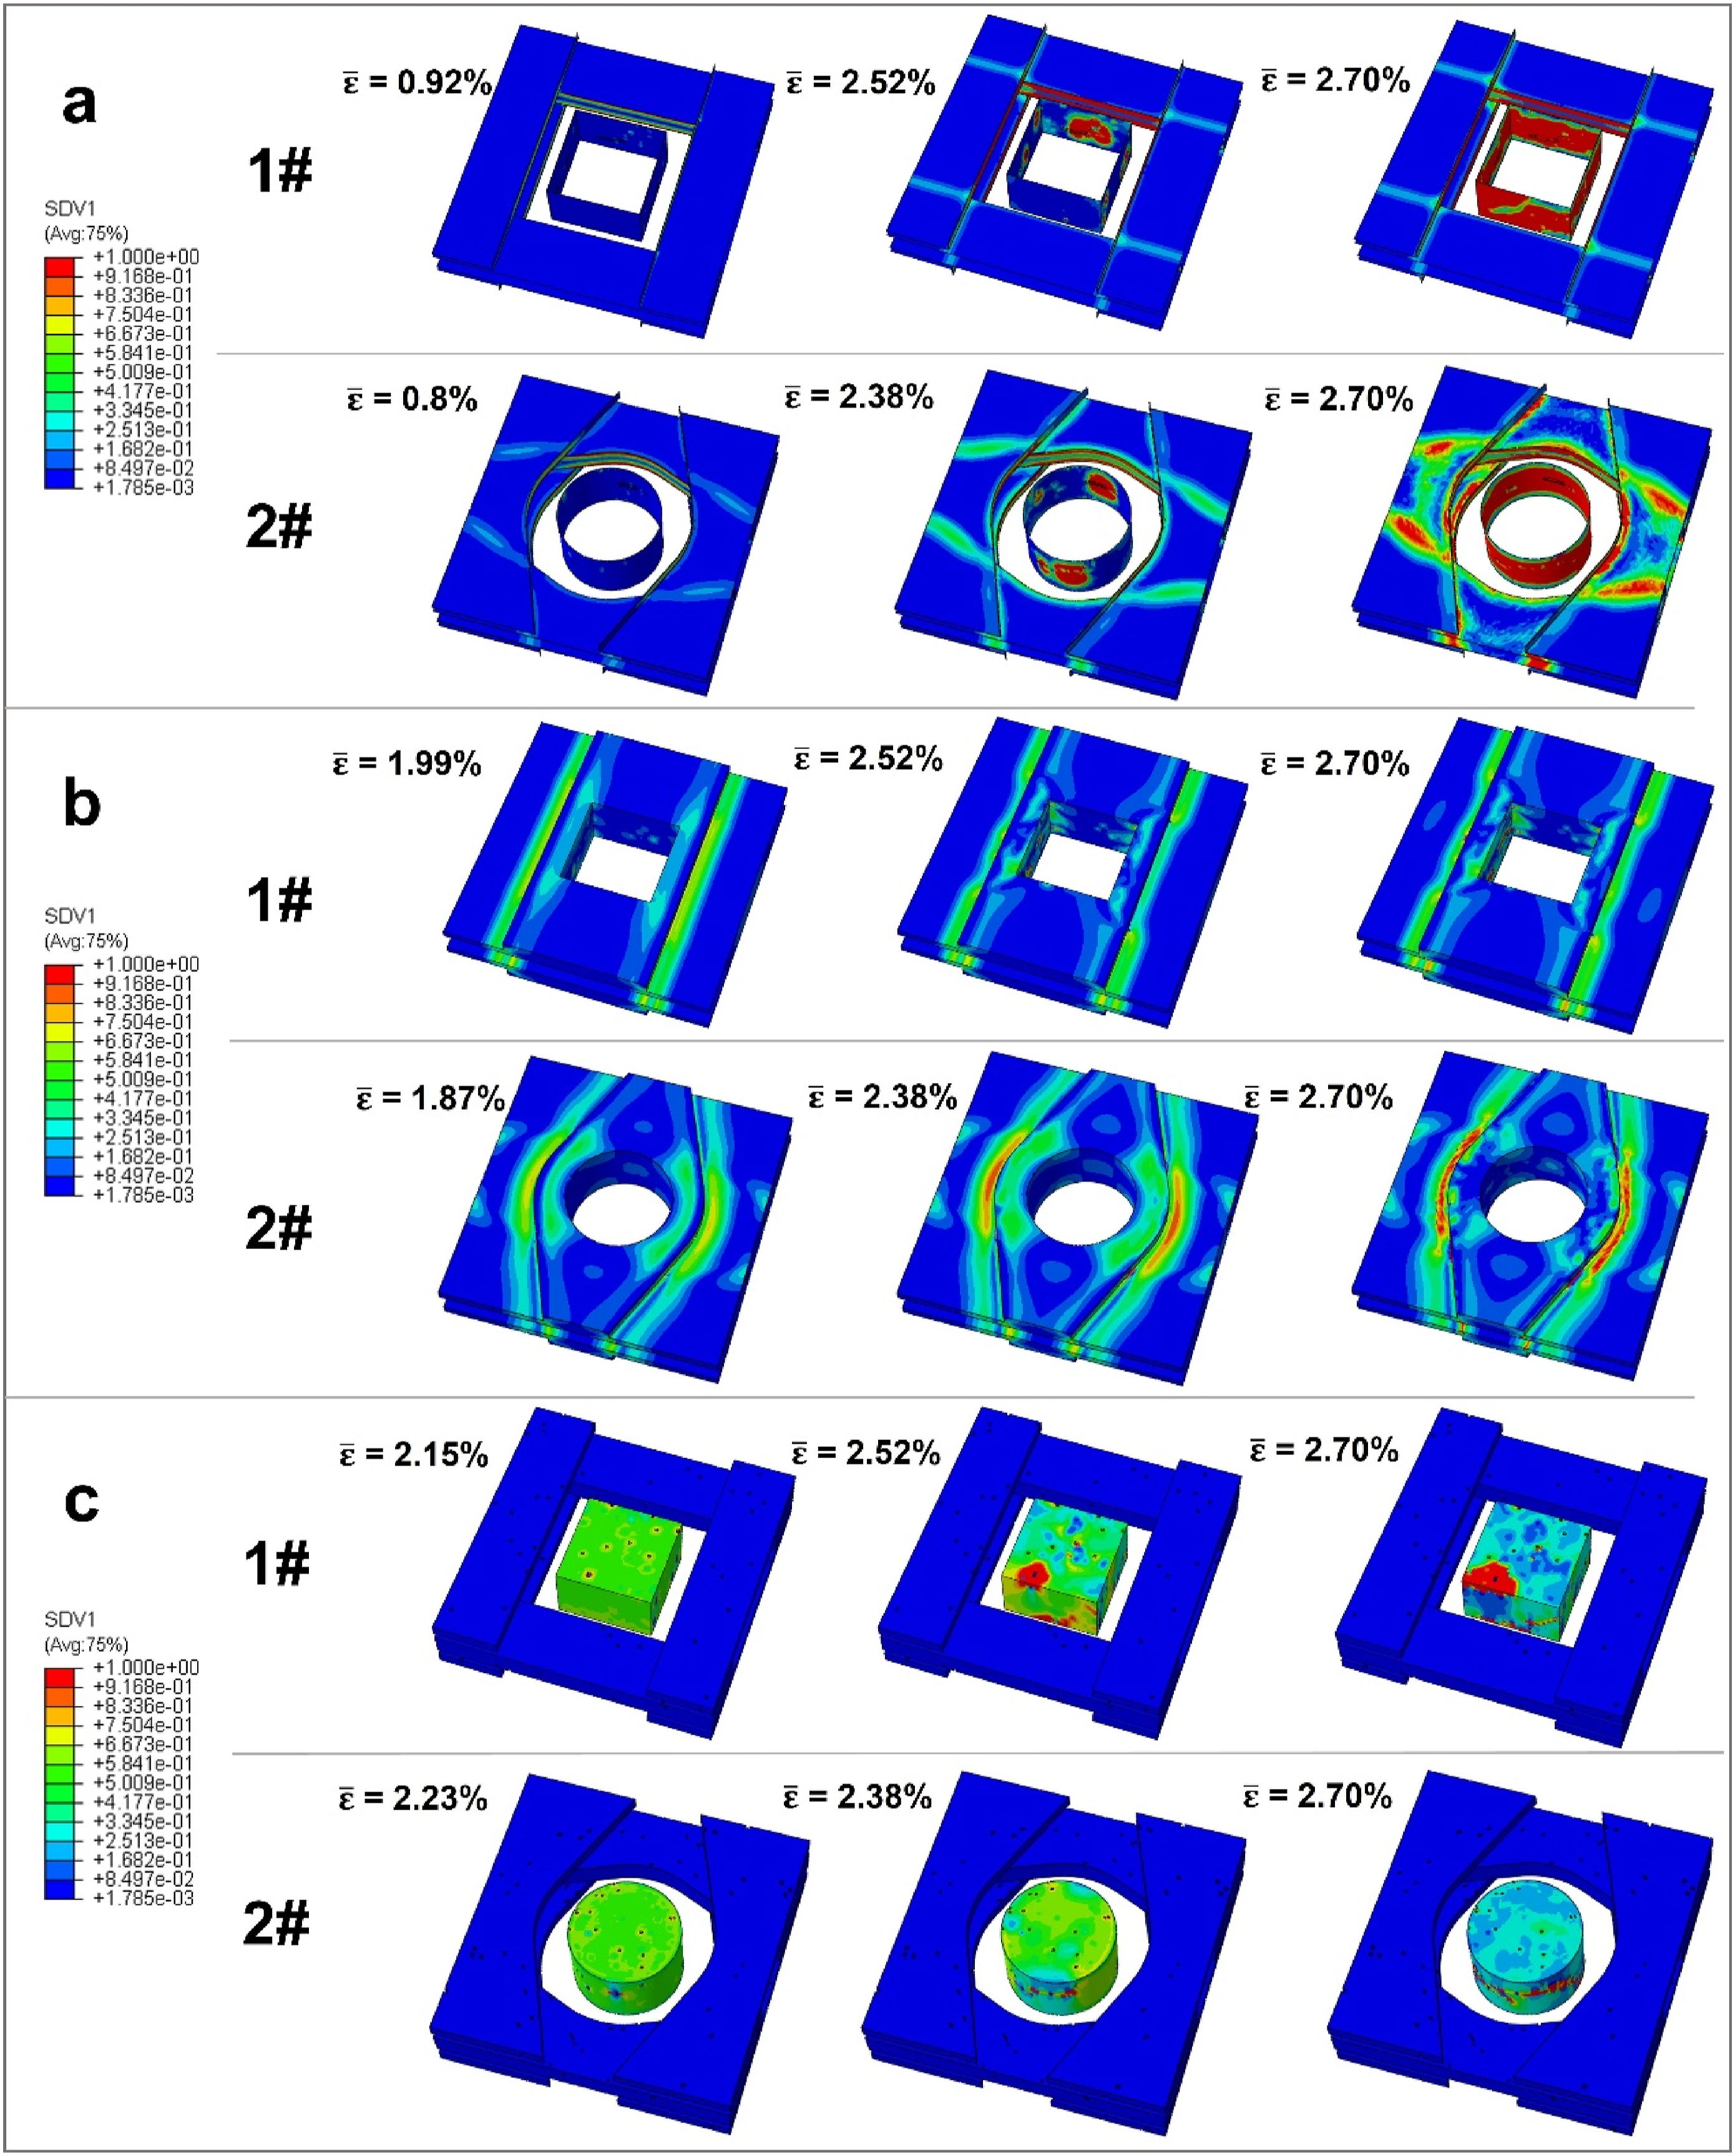
The influence of pores within matrix on model damage
In this section, the mesh numbers for the two structural models are 232924 and 239088, respectively. As shown in the damage evolution process for the two models when pores are present only within the matrix (Figure 10). Unlike Section 4.2, the removal of pores in the fibers and interface leads to an increase in the strain values for initial damage at the interfaces and in the fibers. Compared to pores within the matrix, pores within the fibers have a more pronounced impact on the compressive performance of C/Cs. The initial interface damage for the two C/Cs models increases to 0.97% and 0.89%, respectively, while the initial damage in the axial fibers significantly rises to 3.11% and 2.72%. Additionally, the damage nephograms reveal that the damage area at the interfaces decreases, while the axial fibers are almost completely damaged by the end of the experiment. This suggests that, with the removal of pores within the fibers, the axial fibers of the C/Cs can nearly fully realize their load-bearing capacity, while damage to the interfaces and matrix is reduced. Notably, the strain at complete failure for sample #1 increases significantly with pore removal. This improvement is particularly marked in sample #1, attributed to the integrity and uniformity of its orthogonal woven structure compared to sample #2. Damage nephograms of the model with pores present only in the matrix: damage nephograms of (a) interface, (b) matrix and (c) carbon fibers.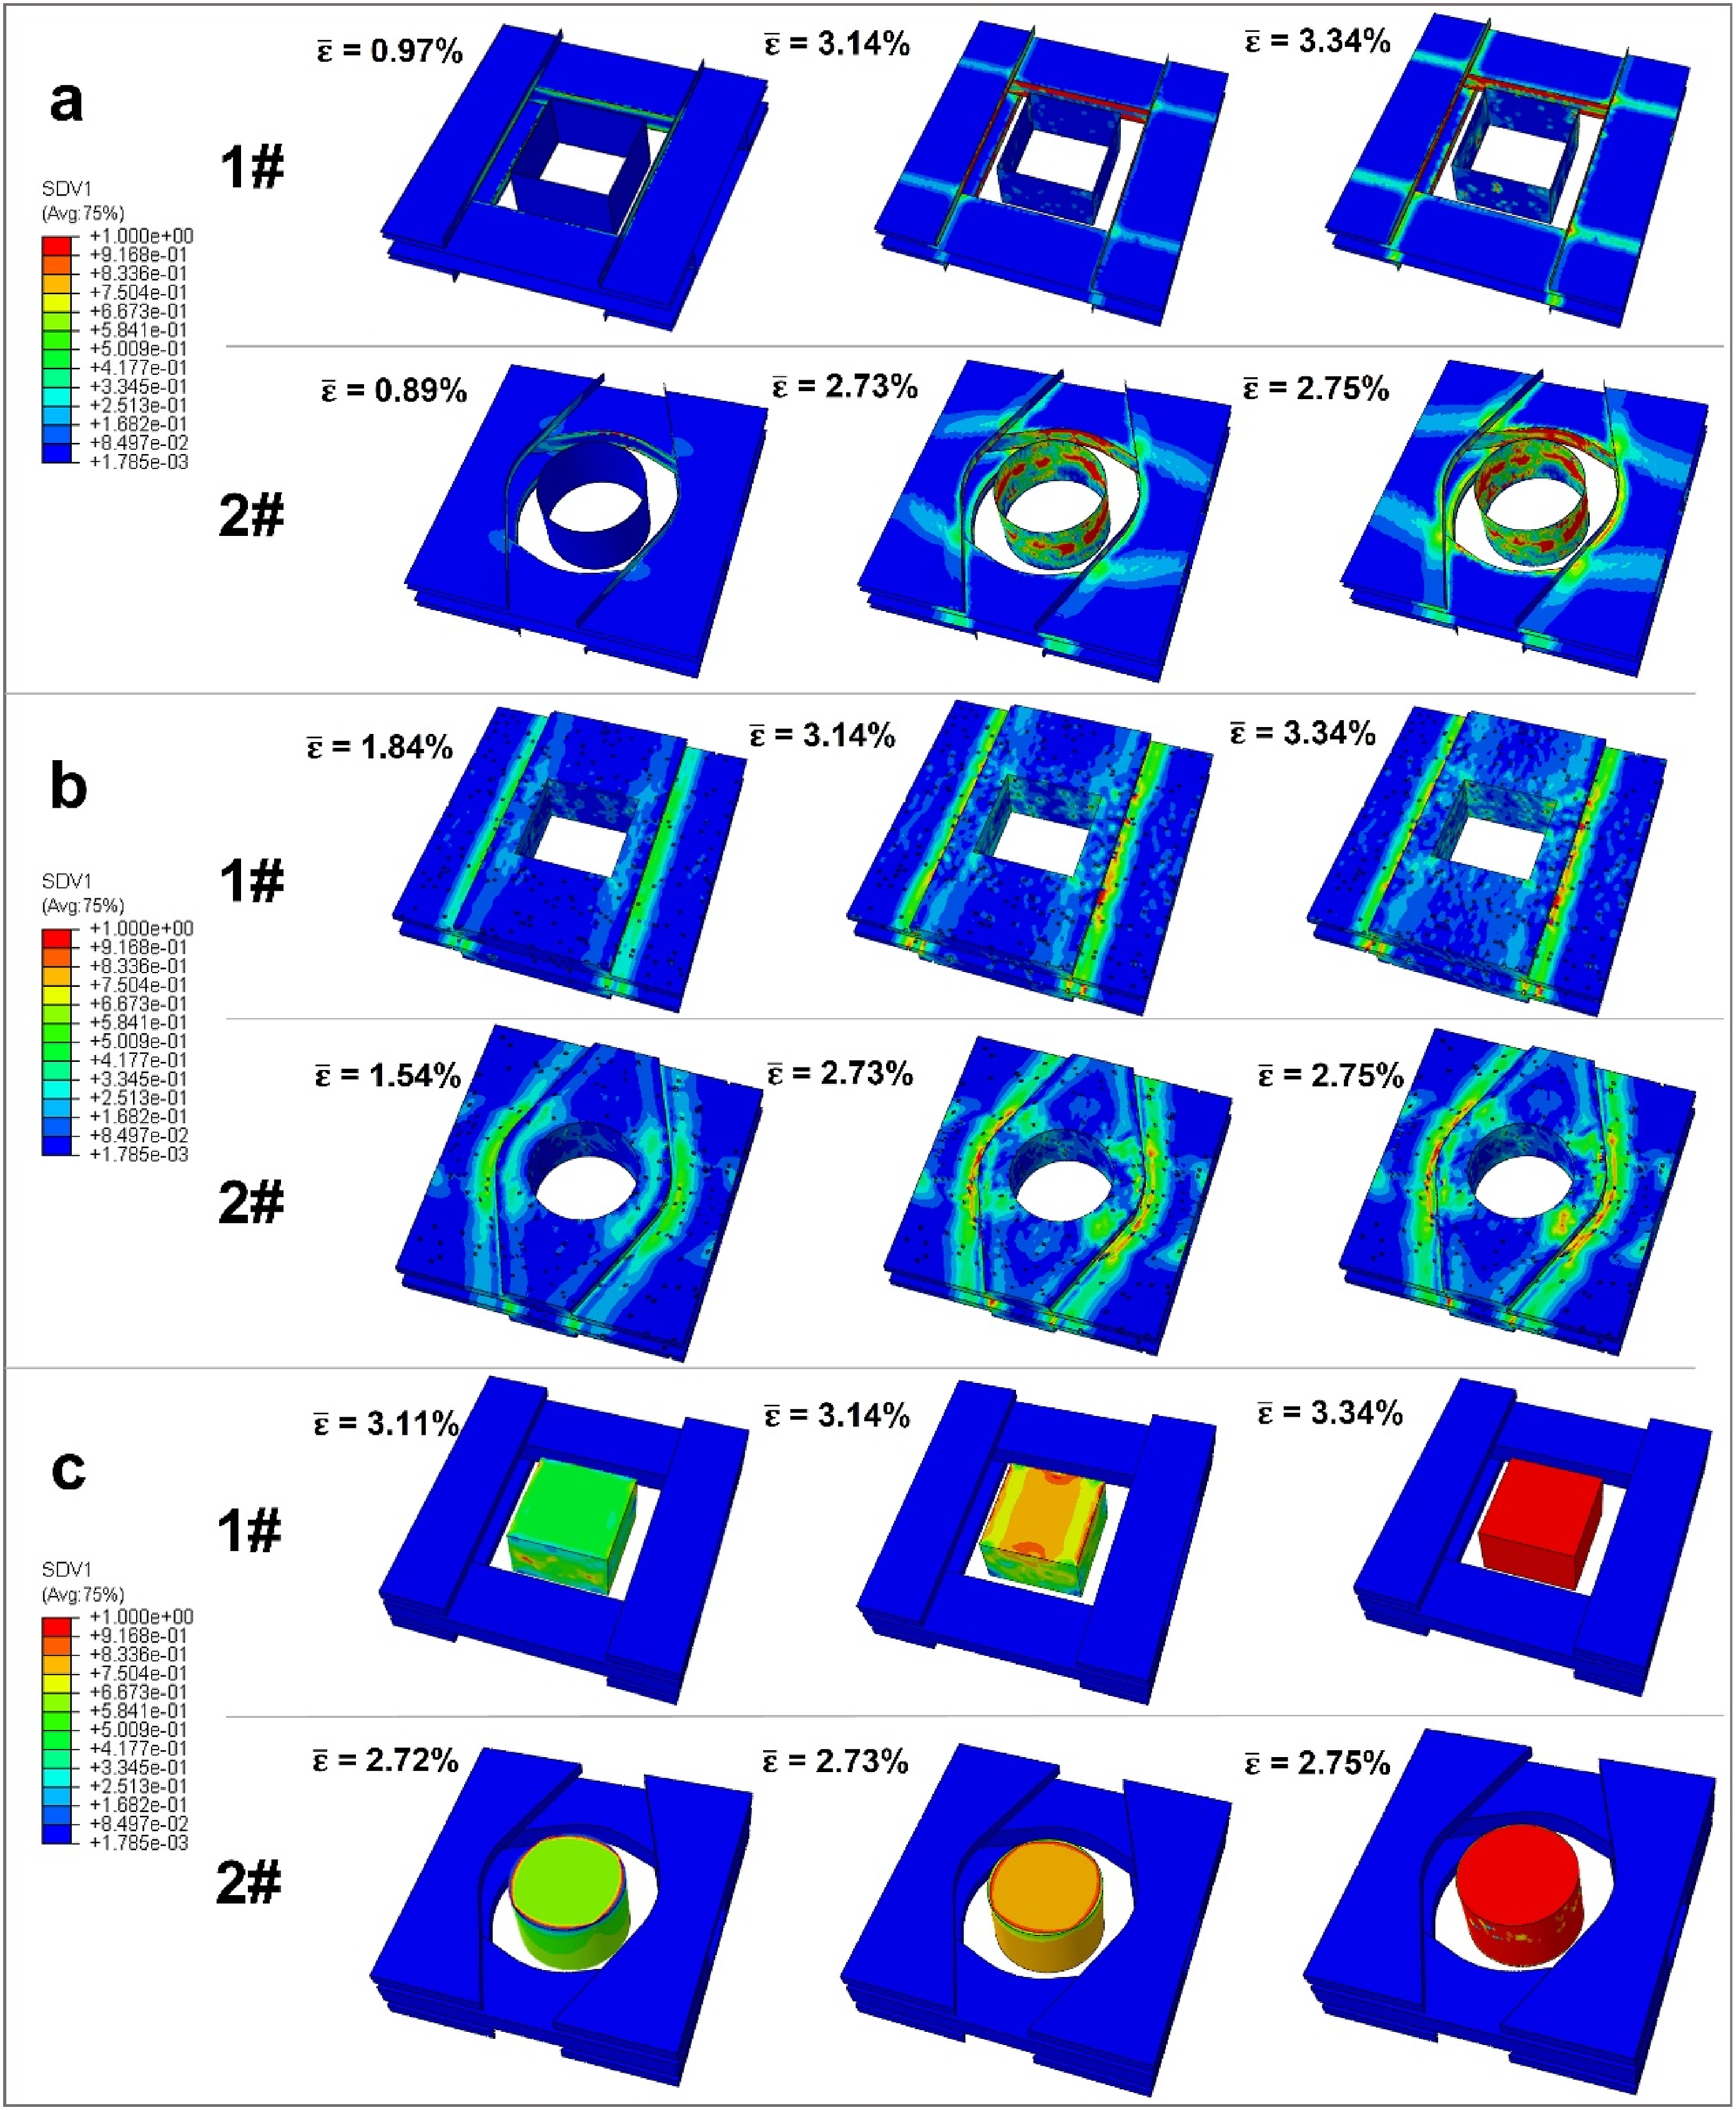
The influence of pores within interfaces on model damage
The Figure 11 illustrates the damage evolution process for the two models when pores are present only at the interfaces. The pores at the interfaces does not affect the pattern of damage propagation from the interfaces to the matrix and fibers. Compared to Section 4.3, when pores are present only at the interfaces, the strain value for initial damage at the C/Cs interfaces slightly decreases. This indicates that the interface performance of the C/Cs is relatively weak. When pores in the matrix are removed, the strain value for initial damage decreases. Additionally, the pores at the interfaces have minimal impact on the initial damage to the axial fibers. This suggests that the pores at the interface have little effect on fiber damage. Compared to sample 2#, the interface damage of sample 1# is later and slower. This indicates that the influence of interface pores on the damage evolution of sample model 1# is weaker. Damage nephograms of the model with pores present only at the interfaces: damage nephograms of (a) interface, (b) matrix and (c) carbon fibers.
Effect of pores on the compressive performance of C/Cs
The stress-strain curves for all models are summarized as shown in the Figure 12(a). The models with pores retained only in the fibers, matrix, and interfaces are named Fem-F, Fem-M, and Fem-I, respectively. From the stress-strain curves, it is evident that in the model Fem-F, the curve shows a nonlinear rise as strain increases. This indicates that the damage mode of the Fem-F closely approximates that of real C/Cs, and the pores within the CFs significantly influences the damage behavior of the composites. When pores within the CFs are removed, the stress-strain curve loses its nonlinear segment, and the load decreases sharply after reaching its maximum. This indicates that the load-bearing effect of carbon fiber is significantly improved during the compression process. Comparison of FEM models based on different pore positions in (a) stress–strain curves and (b) mechanical properties.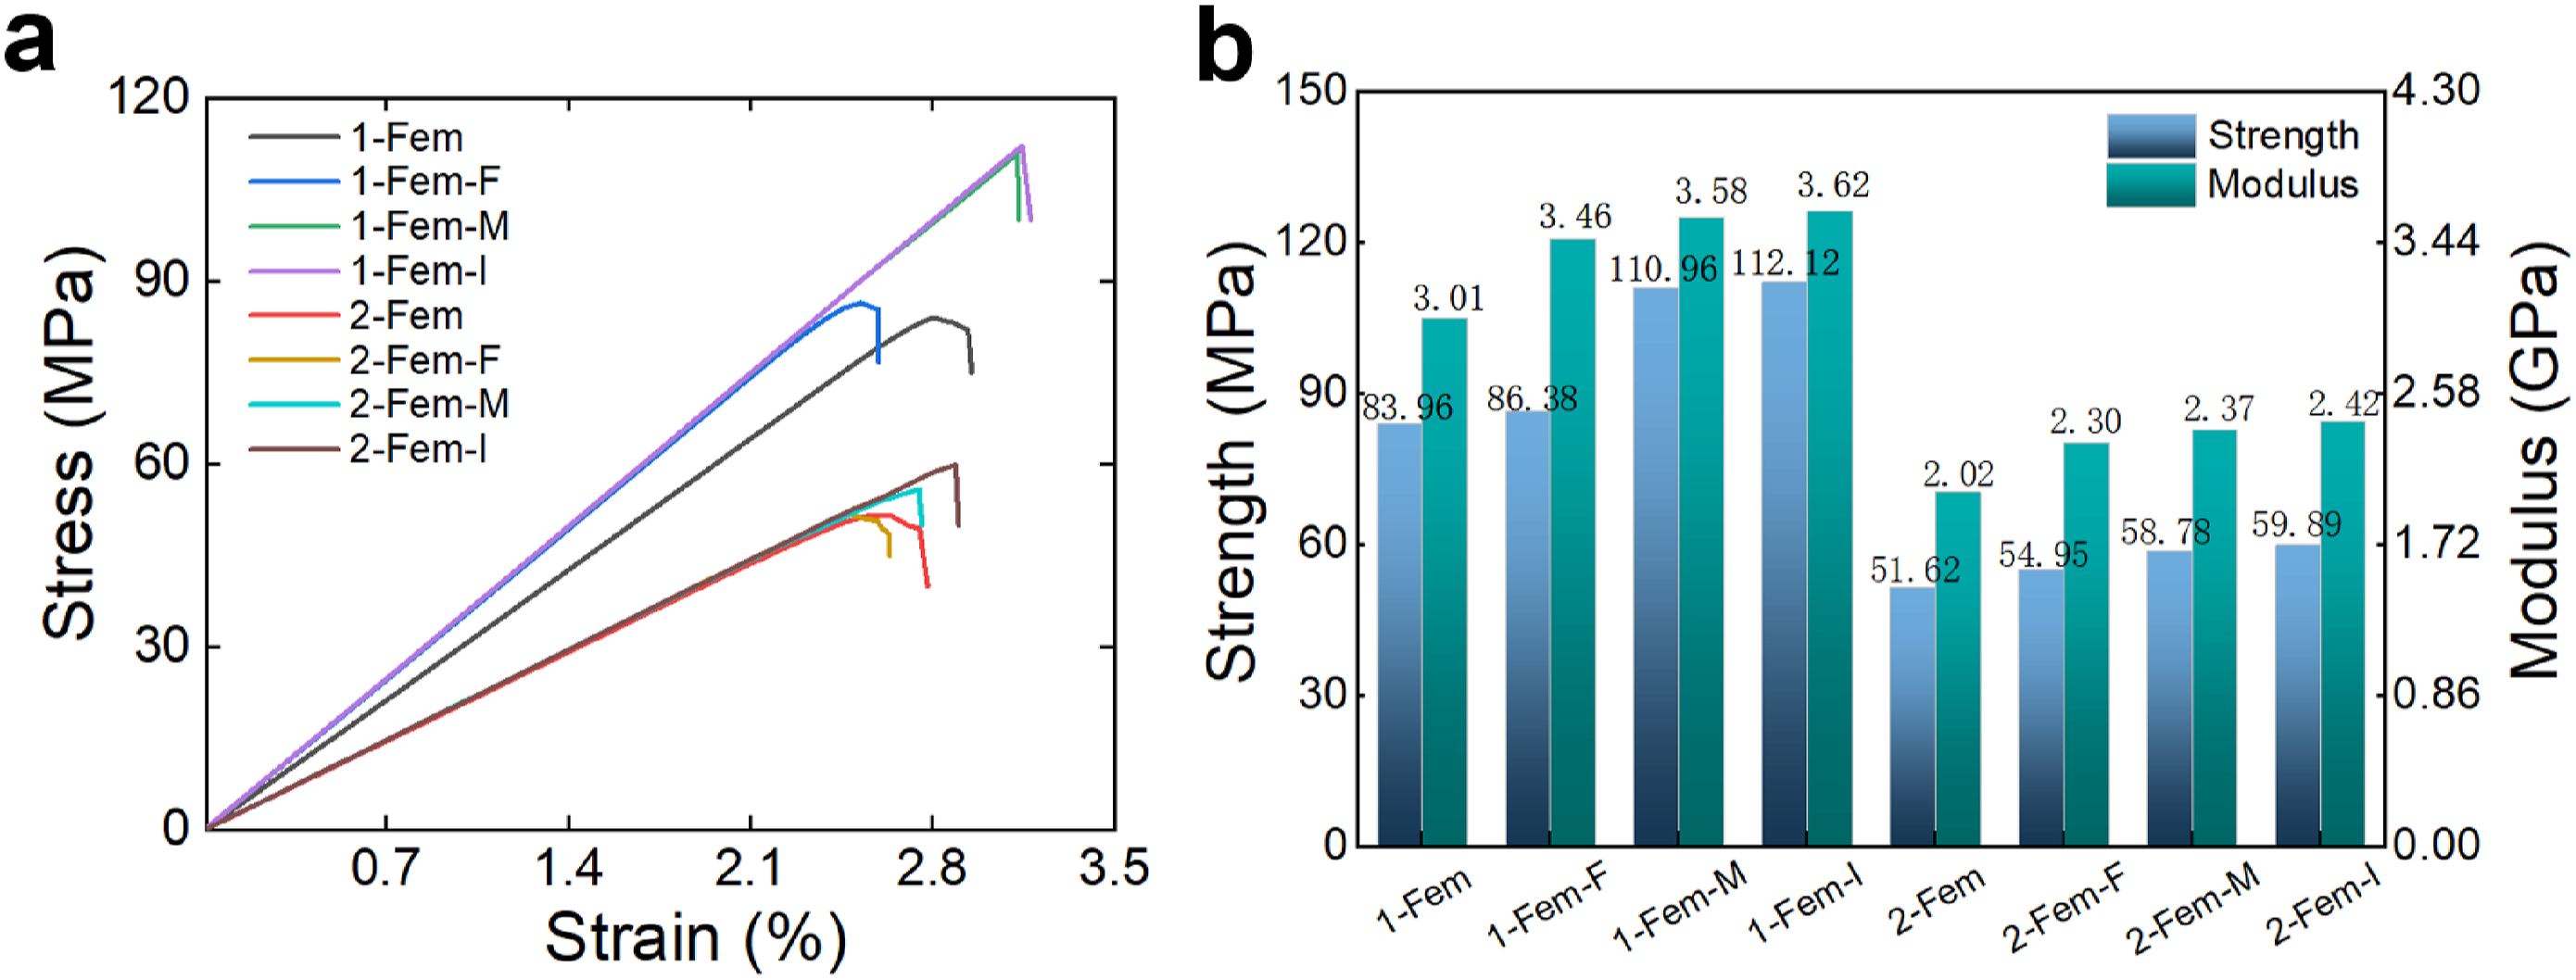
The Figure 12(b) compares the compressive strength and modulus of models with different components of pores retained. As pores in the fibers, matrix, and interfaces are sequentially removed, the compressive strength of the models gradually increases. When pores are present only within the fibers, the compressive strengths of the two structural models are 86.38 MPa and 54.95 MPa, respectively, which are closest to the models with no pores removed. This confirms that pores within the fibers have the most significant impact on the compressive performance of C/Cs among all components. Notably, after the removal of pores within the fibers, the strengths of the two structural models increase by 28% and 6%, respectively, indicating a more pronounced reinforcement effect in Sample 1#. Additionally, pores in the matrix have a greater influence on compressive performance compared to those at the interfaces.
Conclusion
Structural information for the two C/Cs was obtained using image recognition and processing methods. Innovative FEM models with varying structures based on porosity and interfacial cohesive elements were then developed. Compression tests were conducted to validate the accuracy of the developed models. The impact of pores within different components on the compressive performance and damage processes of C/Cs was investigated. According to the numerical simulation results, the initial damage sequence in C/Cs is as follows: interfaces, matrix, and then fibers. Damage initially occurs at the interfaces, particularly at the intersections of multiple fibers. This interface damage then propagates to the corresponding locations in the matrix. The damage to the axial fibers is a decisive factor in material failure. The integrity of the 3D orthogonal woven (3DOW) structure facilitates effective stress transfer, whereas the needle-punching process in the 3D Fine weave pierced (3DFWP) structure affects the load-bearing capacity of the axial fibers. Finite element damage analysis indicates that the impact of pores on the compressive performance of C/Cs follows the sequence: fibers, matrix, and interfaces. Pores within the interfaces and matrix create stress concentrations that impede the propagation of cracks and damage. However, The influence of pores within the interface is relatively limited. The stress concentrations caused by pores within the axial fibers are critical in leading to fiber damage and material failure. Eliminating pores within the fibers significantly enhances the material’s compressive performance, with this improvement being more pronounced in the 3D orthogonal woven (3DOW) structure.
Footnotes
Declaration of Conflicting Interests
The author(s) declared no potential conflicts of interest with respect to the research, authorship, and/or publication of this article.
Funding
The author(s) received no financial support for the research, authorship, and/or publication of this article.