
Abstract
Internal structural changes in yarns directly affect yarn tensile fracture behavior. The acoustic emission (AE) technique plays a crucial role in dynamically monitoring the internal structural changes of stressed materials. In this paper, an acoustic emission signal analysis method during the whole process of yarn tensile fracture is proposed to study the yarn tensile fracture behavior and mechanical properties from the internal microscopic changes. Tensile fracture tests and acoustic emission tests were carried out to investigate the behavioral properties of yarns during the whole process of stretching from both macroscopic and microscopic perspectives and to compare the results with those of conventional acoustic emission amplitude analysis. The effects of the selection of key parameters of Shannon entropy (window width and bin width) and external noise on the yarn stretching behavior were investigated. The mechanical properties of different yarns were characterized by the entropy changes in different stretching stages compared with the analysis results of conventional mechanical property tests. The results show that compared with the AE amplitude, the Shannon entropy can extract the weak AE signal under high background noise and effectively characterize the yarn tensile fracture behavior. In addition, key parameters were shown to affect the yarn tensile fracture behavior. Further, the entropy change when the yarn is subjected to stretching reflects the change in mechanical properties of the yarn and the difference in mechanical properties of different yarns.
Keywords
Introduction
Yarns are subjected to various external forces from spinning to subsequent weaving stages, which weaken the mechanical properties of the yarn.1,2 Tensile fracture is one of the basic failure modes of yarns when subjected to external forces. 3 The tensile mechanical properties of yarns, such as modulus of elasticity and breaking strength, are important indicators for assessing the quality and performance of yarns. These property indexes macroscopically reflect the response and behavior of the yarn when subjected to tension, which directly determines the performance and life of the yarn in textiles.
The current testing of yarn tensile properties is mainly carried out by using yarn tensiometers or simulated with models.4,5,6 However, the mechanical properties of textile materials are analyzed only from a macroscopic point of view, and the mechanical properties are not analyzed from the essential level of the internal state of the yarn during yarn tensile fracture. In fact, changes in the internal microstructure of the yarn, such as inter-fibre interactions and damage accumulation, have a decisive influence on its macroscopic mechanical properties. Therefore, in-depth revelation of the internal state changes throughout the yarn tensile fracture process is crucial for the quality assessment of yarns, optimization of yarn properties, and development of new materials.
Among the methods for detecting the internal state of materials, non-destructive testing (NDT) is favored for its ability to carry out effective testing without damaging the material. Commonly used NDT methods include ultrasonic inspection, radiographic inspection, visual inspection, and acoustic emission techniques.7,8,9 Since its first use in the 1950s, acoustic emission (AE) has become a widely accepted NDT method 10 and is commonly used in condition inspection and fault detection in process monitoring. It is based on the principle that when a material is fractured or deformed by an external force, a localized source within it rapidly releases energy and generates a transient elastic wave. The elastic wave then propagates within the material and is picked up by piezoelectric sensors placed on the outer surface of the material. After amplification by an amplifier, these signals are further analyzed and processed.
With the research and application of acoustic emission nondestructive testing technology in various fields, acoustic emission technology has been welcomed in the textile field in recent years, especially in the study of the tensile fracture behavior of textile materials. Zhang et al. 11 analyzed the singular values of AE signals during tensile fracture of blended yarns and characterized the fiber fracture order by the EEMD-HHT-SVD method. However, only the AE signal at tensile breakage was analyzed. To address the problem of monitoring the internal state of yarns, Xue et al. 12 supplemented the study of yarn tensile fracture behavior by using the AE technique. It uses HHT to identify fiber breakage and fiber slip characteristics during ring-spun yarn stretching. Wang 13 used kernel density to estimate the overlap of the probability density eigenfrequencies of the first three AE signals and the main fracture zone to reveal the order of fiber fracture for each component of polyester-cotton blended yarns. Although the above studies provide an in-depth discussion of some aspects of the yarn stretch-fracture process, they lack an exploration of the whole process of yarn stretch to fracture.
For the study of the whole process of yarn tensile fracture, Yi et al. 14 used an acoustic emission device to collect the AE signals during the whole process of tensile fracture of woven fabrics, and they found that the amplitude curve of the AE signals basically corresponded to the tensile load-displacement curve. Although the fabric tensile fracture stage can be clearly distinguished from the other stages, the fabric structural phase change stage and the yarn deformation stage cannot be clearly distinguished. This is mainly due to the fact that they directly analyzed the raw AE signals without adopting appropriate AE analysis methods, resulting in the inability to effectively extract the information of the potential microstructural changes within the textile materials, which has been a key challenge in the analysis of weak AE signals.
The acoustic emission (AE) signal of yarn tensile fracture is a nonlinear and non-smooth time-domain signal. 15 Currently, AE signal analysis methods are mainly divided into parametric and waveform analysis. 16 AE parameters other than amplitude are susceptible to thresholds and other settings in the data acquisition system. Existing waveform analysis methods also face many challenges. Waveform analysis methods mainly include spectral analysis, modal acoustic emission, time-frequency analysis, and artificial neural networks.17,18,19 Spectral analysis is difficult to capture the details of key time periods, modal acoustic emission 20 is affected by multiple factors, artificial neural networks are complex and targeted to establish, 21 and time-frequency analysis is susceptible to fabric anisotropy and noise interference. Therefore, it is difficult for the existing methods to effectively capture the weak AE signal characteristics of yarn tensile fracture, and there is an urgent need to propose new AE signal processing methods to identify the potential microscopic change characteristics of the fibers inside the yarn during the whole process of yarn tensile fracture.
Given that the uncertainty of the whole process state increases the complexity of the analysis, Shannon entropy, as a simple, sensitive, and efficient method, has been successfully applied in recent years to reveal and measure the uncertainty of microstructural changes.22,23 Hosseini et al. 24 used AE entropy to detect crack budding, Kahirdeh et al. 25 to observe microstructural changes in the degradation process of a material, and Chai et al. 26 analyzed fatigue crack extension in CrMoV steels. These studies show that Shannon entropy retains the AE feature information more completely and better characterizes the original microstructural deformation than the traditional AE signal analysis methods, and thus has significant advantages in processing and analyzing the AE signals during the whole process of yarn tensile fracture.
Aiming at the difficulty of extracting the characteristic information of internal microscopic changes during the whole process of yarn stretching, this study proposes a new Shannon entropy-based waveform analysis method for AE signals. The core of the method is to identify the tensile-fracture behavioral properties and evaluate the mechanical properties of yarns by monitoring the internal state of the whole process of yarn stretching. Specifically, based on the concept that each waveform is a unique probability distribution, the method splits the AE signal waveform of the whole process of tensile fracture into a number of windows and measures the difference of the probability distributions of the front and back windows using the information uncertainty. In this paper, we obtained the macroscopic mechanical characteristics of polyester/cotton blended yarns through mechanical property tests. Then Shannon entropy analyzes the acoustic emission signals during the whole process of stretching and compares them with other analysis methods, such as AE amplitude and time-frequency methods. The effects of parameters related to the method and external background noise on the whole process of tensile fracture are also discussed. Finally, Shannon entropy analysis of the tensile fracture behavior of different yarns is performed to assess the variation of the mechanical properties of the yarns as well as the differences in the mechanical properties of the different yarns.
Theory and calculation
Feature extraction and denoising of AE signals is very difficult. Specifically, the voltage values in the AE signals have a complex composition and originate from multiple emitting sources, and the interaction between reflection and refraction between the signal sources also generates new signals, which can have a large impact on the processing of the original signals. In addition, the mechanisms of generating and propagating AE signals are still not fully understood, which can also increase the difficulty of processing AE signals. For this reason, we propose an adaptive method based on the discrete probability distribution of the original signal. In this section, we will introduce four aspects, namely, AE signal probability distribution, Shannon entropy based on probability distribution, calculation of Shannon entropy, and performance index of Shannon entropy distribution, respectively.
Probability distribution of AE signal
During the acquisition of the AE signal, the yarn is stretched and deformed to produce an instantaneous elastic wave, which is captured by the piezoelectric transducer and pre-amplified into a voltage signal. If we denote the voltage discrete sequence by X, it has L data points. Divide X into m time Windows with a window length (window width) of

For the ith time window of the signal X, the probabilities of the 1st to nth bin are

Wavelet denoising
Denoising is a fundamental and unavoidable process in signal processing. However, the denoising process inevitably changes the probability amplitude distribution of the AE waveform, resulting in different entropy values. Wavelet denoising is an advanced denoising method. In wavelet threshold denoising, the threshold function is the central step in processing wavelet coefficients above and below the threshold. Traditionally, there are two methods, hard thresholding and soft thresholding, but each has its own defects. Many scholars have proposed many improvement methods for the threshold function. Among them, two improvement methods have attracted much attention: one is the introduction of α and γ,
27
whose threshold function is shown in eq. (3); the other is the introduction of α and β two adjustment factors,
28
whose threshold function is shown in eq. (4). By adjusting the two parameters so that the asymptote is close to the hard threshold function after being larger than the threshold, denoising is performed while preserving the effective signal as much as possible.


Shannon entropy based on probability distribution
The internal state of the yarn changes when it is subjected to external forces, and this internal microscopic change affects the probability distribution of the waveform and the extraction of features from it. Shannon entropy is the information entropy, which is the mathematical expectation of self-information. Shannon entropy can quantify the disorder or uncertainty of the probability distribution and has been widely used in the fields of engineering, mathematics, and computers.
29
Given a random sequence


Note that the Shannon entropy H is non-negative. For the voltage variable X, its Shannon entropy value for the ith time window is

AE discrete time sequence
The calculation of Shannon entropy
Figure 1 shows the process of calculating the Shannon entropy value of the AE signal during the whole process of yarn stretching. Firstly, the raw AE signals of the yarn stretching process are obtained. Then, the raw AE signals are segmented and partitioned. Finally, the calculation of Shannon entropy for each segment is carried out using equation (7). The specific calculation steps can be expressed as follows: 1. Data Acquisition: Acquisition of raw AE time series X. The sampling rate and length of the signal depend on what is being monitored. 2. Segmentation Setting: the original AE signal X is divided into m equal time windows 3. Partition setting: The partitioning is set up for m equal time windows, respectively. For example, the ith time window of signal X is partitioned into n zones, which can be expressed as 4. Frequency histogram: Determine the distribution boundary of the histogram 5. Shannon entropy calculation: calculate the Shannon entropy value Flowchart of Shannon’s entropy value calculation.

Indicators for assessing the distributional performance of Shannon entropy values
In this study, we used the coefficient of variance (CV) to assess the distributional performance of Shannon entropy. CV is an effective measure of the relative dispersion of the data, which expresses the percentage of the standard deviation of a set of observations with respect to the arithmetic mean,
31
and it can be calculated by equation (8):

The building of DAQ system platform
The first AE waveform is made up of discrete voltage values that were recorded by the data acquisition (DAQ) system that was built separately in Figure 2(a). The DAQ system mainly consists of four parts: a microcomputer-controlled electronic tensile tester, an acoustic-electrical converter module, an oscilloscope (DS70504, STATIONMAX), and a horizontal stage. Among them, the electronic tensile testing machine (WDW-5, Jinan Baichuan Instrument and Equipment) stretches the specimen, and the corresponding force transducer (CSF-A) has a range of 50 N, which is equipped with the Fasttest universal testing machine test system. Figure 2(b) Acoustic-electrical conversion module, which includes a PVDF sensor, an amplification module, and a battery. The PVDF sensor operates in the frequency range of 0.001 Hz∼1000 Hz and is used to receive the AE signal. The amplification module amplifies the AE signal, and the battery provides a 6 V power supply to the amplification module. An oscilloscope records and displays the acquired AE signal, and a horizontal stage is used to support the PVDF sensor. Experimental equipment (a) experimental platform construction (b) acoustic-electric conversion module (c) AE signal detection process.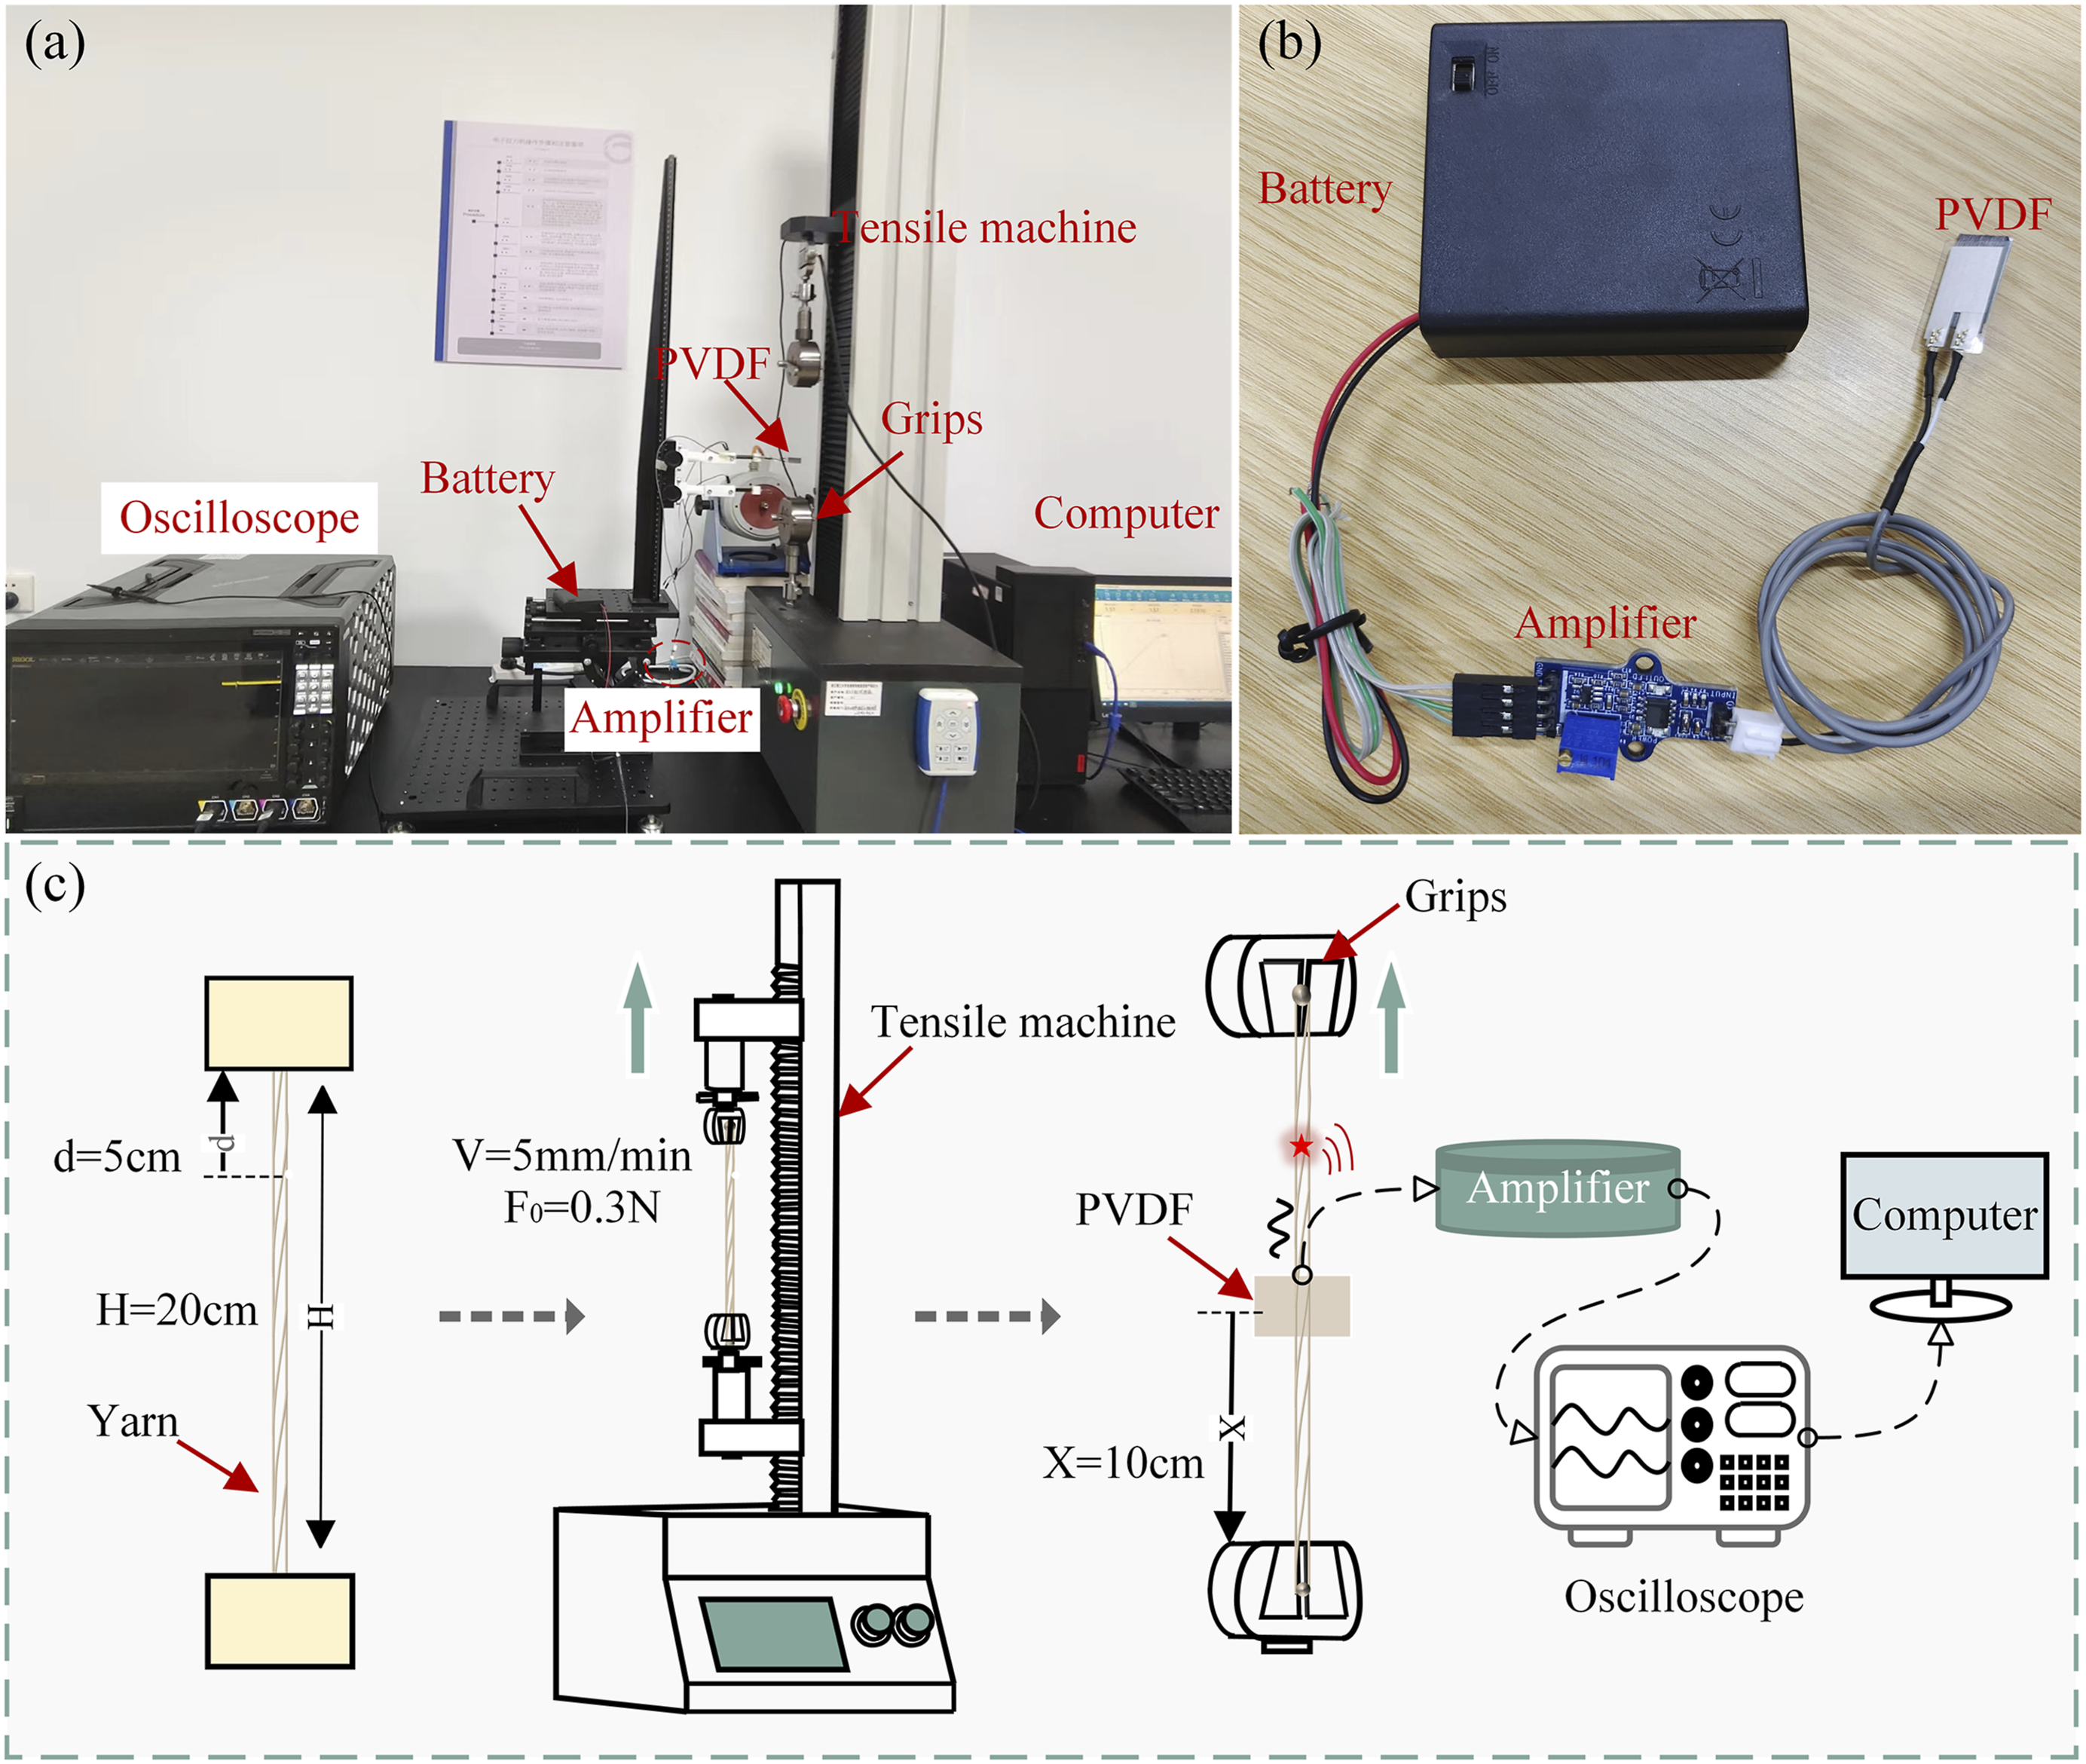
Figure 2(c) shows the AE signal detection process as follows: fix the specimen on the fixture of the electronic tensile testing machine, paste the soft magnet on the back of the PVDF sensor, and apply an appropriate amount of petroleum jelly on its contact surface with the yarn; adjust the horizontal table so that the PVDF sensor touches the yarn; and gently attach a thin piece of iron on the front side of the PVDF so as to make full contact between the yarn and the sensor. Adjust the stretching spacing of the fixture and the electronic tensile testing machine to stretch the yarn at a steady speed, and repeat the test several times. Ambient temperature T = (25 ± 2)°C, relative humidity RH = 65%. The specimens had been placed under standard conditions for 24 h before the test to allow the specimens to reach equilibrium moisture regain rate. In the stretching process of the yarn, its constituent components—fibers—are changing at all times. The deformation process or breakage is accompanied by the release of energy in the form of instantaneous elastic waves propagating inside the material; this elastic wave is transmitted through the coupling of the PVDF sensor mounted on the surface of the completion of the acoustic-electrical conversion into level signals and amplified by the amplifier. Recorded by an oscilloscope with a sampling frequency of 20 ksa/s and a storage depth of 1 MHz, the waveforms of the recorded acoustic emission signals were post-processed by the programmed algorithm after the test.
Related experiments and discussions
Analysis of yarn tensile fracture behavior under whole process condition monitored by Shannon entropy
The whole process of yarn stretching usually includes elastic, plastic, and fracture stages. In this section, the macroscopic mechanical behavior characteristics of the whole process of yarn stretching are firstly obtained by tensile strength testing. Among them, an electron microscope is used to statically observe the microscopic features under the macroscopic mechanical behavior characteristics. Secondly, Shannon entropy is used to analyze the AE signals generated by the internal force deformation of the yarn during the whole process of tensile stretching, to characterize its mechanical behavior at the microscopic level, and to compare it with the results of the AE amplitude parameter and the time-frequency analysis. In addition, the effects of two key parameters on the characterization of yarn fracture behavior during the Shannon entropy calculation process are discussed. Finally, the effect of external noise on the tensile fracture behavior of Shannon entropy analysis is discussed.
Characterization of the tensile fracture behavior of yarns
Blended yarns consisting of multiple fibers are one of the more widely used yarns in the current market. We chose 12 s polyester/cotton blended yarn (CVC, 45/55, air-flow spun) as the tensile specimen, referred to as ROTOR45/55. The tensile clamping distance of the specimen was 200 mm, and the specimen was stretched at a uniform speed with a displacement-controlled speed of 5 mm/min until it broke for several tests. The recorded ROTOR45/55 tensile mechanical property curves (Figure 3(a)), P1 and P2 are the elastic section marker points, and the slope of the curve in the P1P2 section, Kp12 = 0.09, is the initial modulus E. The yield point of the yarn was estimated using the tangent line method,
32
which is the extension of the straight line of P1P2, and the point A, which is the point that intersects with the subsequent portion of the curve, is used as the estimated yield point, and the time for the occurrence of the yield point is about t = 105.8 s. The elastic phase is before the yield point A, and the plastic deformation phase is after the yield point. With the increasing stress, the stress reaches the maximum value Fmax = 4.39 MPa at t = 198.5 s (after point B), that is, after point B is the fracture stage. (a) Mechanical properties test (b) static pictures of different stages of yarn under electron microscope.
An electron microscope was used to record the internal state of the yarn during stretching, as shown in Figure 4(b). In the elastic stage, the internal structure of the yarn undergoes reversible deformation within the elastic range, that is, the internal structure of the yarn does not undergo destructive changes. A part of the deformation produced in the plastic phase is the mutual slippage between the macromolecular chain segments. With the increasing stress, the stress reaches the maximum value Fmax = 4.39 MPa at t = 198.5 s, and the yarn breaks. Although the mechanical property test can reveal the key mechanical features such as the elastic phase, the plastic phase, and the fracture point from a macroscopic point of view, it does not analyze the yarn tensile fracture behavior in terms of the changes in the internal state of the yarn. (a) Raw AE signal during the full stretching process (b) Shannon entropy analysis of the AE signal during the full stretching process.
Figure 4(a) shows the raw AE signals acquired by the DAQ system during the whole process of yarn stretching. Obviously, it is not possible to identify the internal state change characteristics during the whole process of yarn stretching directly from the raw AE signals. The amplitude is used as a threshold-independent acoustic emission parameter, and we calculate the AE amplitude during yarn stretching. Figure 4(b) shows the amplitude fluctuations throughout the process. It can be seen that the amplitude signal is roughly distributed between 122 and 123 dB throughout the process, with higher amplitude signals occurring at the break. However, it is still not possible to identify the characteristics of the internal change states of the elastic and plastic phases of the yarn stretching process.
It is natural to expect that time-frequency analysis methods, that is, short-time Fourier (STFT), wavelet transform (SWT), and frequency-sliced wavelet transform (FSWT), may produce better results. In this work, SWT and FSWT are used to analyze the raw AE signals during the whole process of yarn stretching. FSWT decomposes the signals into different frequency components by wavelet decomposition and then ‘slices’ them for specific frequency ranges. It can extract more detailed information about the signal in a specific frequency range.
33
The results obtained using SWT and FSWT are shown in Figure 5(a) and (b). Figure 5(a) does not show the breakage feature of the yarn at 198.5 s. Figure 5(b), although it is able to identify the yarn stretch breakage feature, it is not able to identify the internal change feature within the other phases. (a) SWT (b) FSWT analysed raw AE signal.
In order to identify the key feature signals during the whole process of specimen stretching, the Shannon entropy of the raw AE signals was calculated according to the method described in Section 2. The raw signals were divided into equal-length sections (400 data points, corresponding to a duration of 0.2 s). Based on the maximum and minimum values of the AE voltage signal, the distribution margins were set at 2.5 V to 3.5 V. According to Sturges’ rule, the voltage range was divided into n = 9 box widths, at which point the box widths were approximately 0.11 V.34,35 Figure 6 shows the entropy evolution with time. According to the evolution of entropy, it is obvious that it can be divided into three stages: stage 1, stage 2, and stage 3. In stage 1, although the arrangement and interaction of fibers start to change, the overall structure of the yarn still maintains a certain degree of order, and the Shannon entropy value of the yarn exhibits a small upward tendency but overall maintains a relatively smooth state. In stage 2, as stretching continues, the Shannon entropy begins to show a rapid rising trend. At this stage, the yarn undergoes plastic deformation, and the internal structural changes such as fiber slippage and microcrack formation lead to a significant increase in the uncertainty of the acoustic emission signal. In stage 3, when enough fibers break, the yarn as a whole breaks, and the uncertainty of the system reaches a maximum at this moment, and the Shannon entropy reaches a maximum value of Emax = 2.65 Bit at t = 178.7 s. However, after yarn breaking, a complete system no longer exists, and the Shannon entropy is relatively stable overall. In stage 4, the Shannon entropy increases rapidly as the stretching process continues. After that, a complete system no longer exists, and the entropy value decreases sharply to the lowest point. Comparing the entropy evolution curve with the tensile mechanics curve, the three phases of the entropy curve correspond to the elastic phase, the plastic phase, and the fracture phase. In addition, the entropy evolution curve can observe the internal structural changes of the yarn, such as the local peak at t = 170 s (at point C), which is related to the fracture of some fibers inside the yarn. Shannon entropy analysis of AE raw signals during the whole process of stretching.
The above analyses show that the Shannon entropy is more effective in identifying the characteristics of internal state changes during the whole process of yarn stretching when comparing the AE amplitude with the conventional time-frequency analyses of SWT and FSWT. The entropy evolution curve of yarn stretching until breakage was divided into three stages: low entropy, increasing entropy, and decreasing entropy after the maximum value. These three stages correspond perfectly to the elasticity, plasticity, and breakage stages of the tensile property test. In addition, the entropy evolution curve is able to identify internal structural changes in the yarn, such as internal fiber breakage.
Analysis of key parameters of Shannon entropy under yarn tensile fracture behavior
Calculating the Shannon entropy value for the yarn stretch fracture process involves two key parameters—window width and bin width. One of the essential steps is the splitting of the original AE waveform into equal-length windows because the specified data points must be used to calculate the probability distribution. In the tensile fracture process, the window width was specified to be 0.2 s. This window width was chosen for a reason: in the yarn tensile fracture test, where the yarn was stretched at a uniform speed at a rate of 5 mm/min, the stretch distance for 0.2 s was 0.017 mm. This distance is small enough to ensure that the critical state is recognized for a very small period of time. At the same time, the window width of 0.2 s is close to the time accuracy of 0.1 s of the tensile testing machine.
Based on the window width of 0.2 s, two other window widths shorter or longer than it (0.1 s and 0.5 s) were chosen to calculate the Shannon entropy during the tensile fracture process in order to observe the effect of the window widths on the characteristics of the yarn tensile behavior, and the results are shown in Figure 7(a)–(c). The results show that all three plots can recognize different stages, but different window widths have obvious effects on Shannon entropy. The Shannon entropy values corresponding to the window widths from 0.1 s to 0.5 s range from [0.41, 0.96], [0.40, 0.90], and [0.50, 0.87]. Obviously, the range of the distribution of Shannon entropy values increases with the gradual shortening of the window width. Figure 7(f) shows the CV values of the Shannon entropy distribution calculated using different window widths, and it is clear that the lowest window width shows the highest CV value, indicating that this window width has the highest variability. Shorter window widths increase the number of entropy values due to the fact that a shorter window width will have more windows of data to be analyzed in the same time period, but shorter window widths mean that more computation time is required. However, as the window width increases, detailed information about the stretching process (m = 2 s) cannot be observed, such as the elastic and plastic phase demarcation points, which are not clear. And a longer window width leads to a larger error between the occurrence time of the critical point and the actual occurrence time, which is caused by the internal nature of its algorithm. It can be seen that the choice of window width plays a crucial role in the Shannon entropy analysis of the internal state of the whole process of yarn stretching, and the selection of the appropriate window length according to the monitored process is a key factor to ensure the accurate analysis of the yarn stretching and fracture behavior. (a), (b), (c) Results of Shannon entropy analysis for 0.1 s, 0.2 s, and 0.5 s widths, respectively, (d) results of comparative analysis of Shannon entropy for 0.100 V and 0.110 V bin widths (e) results of comparative analysis of Shannon entropy for 0.100 V versus 0.125 V bin widths (f) distribution of Shannon entropy values for different window widths and bin widths CV value.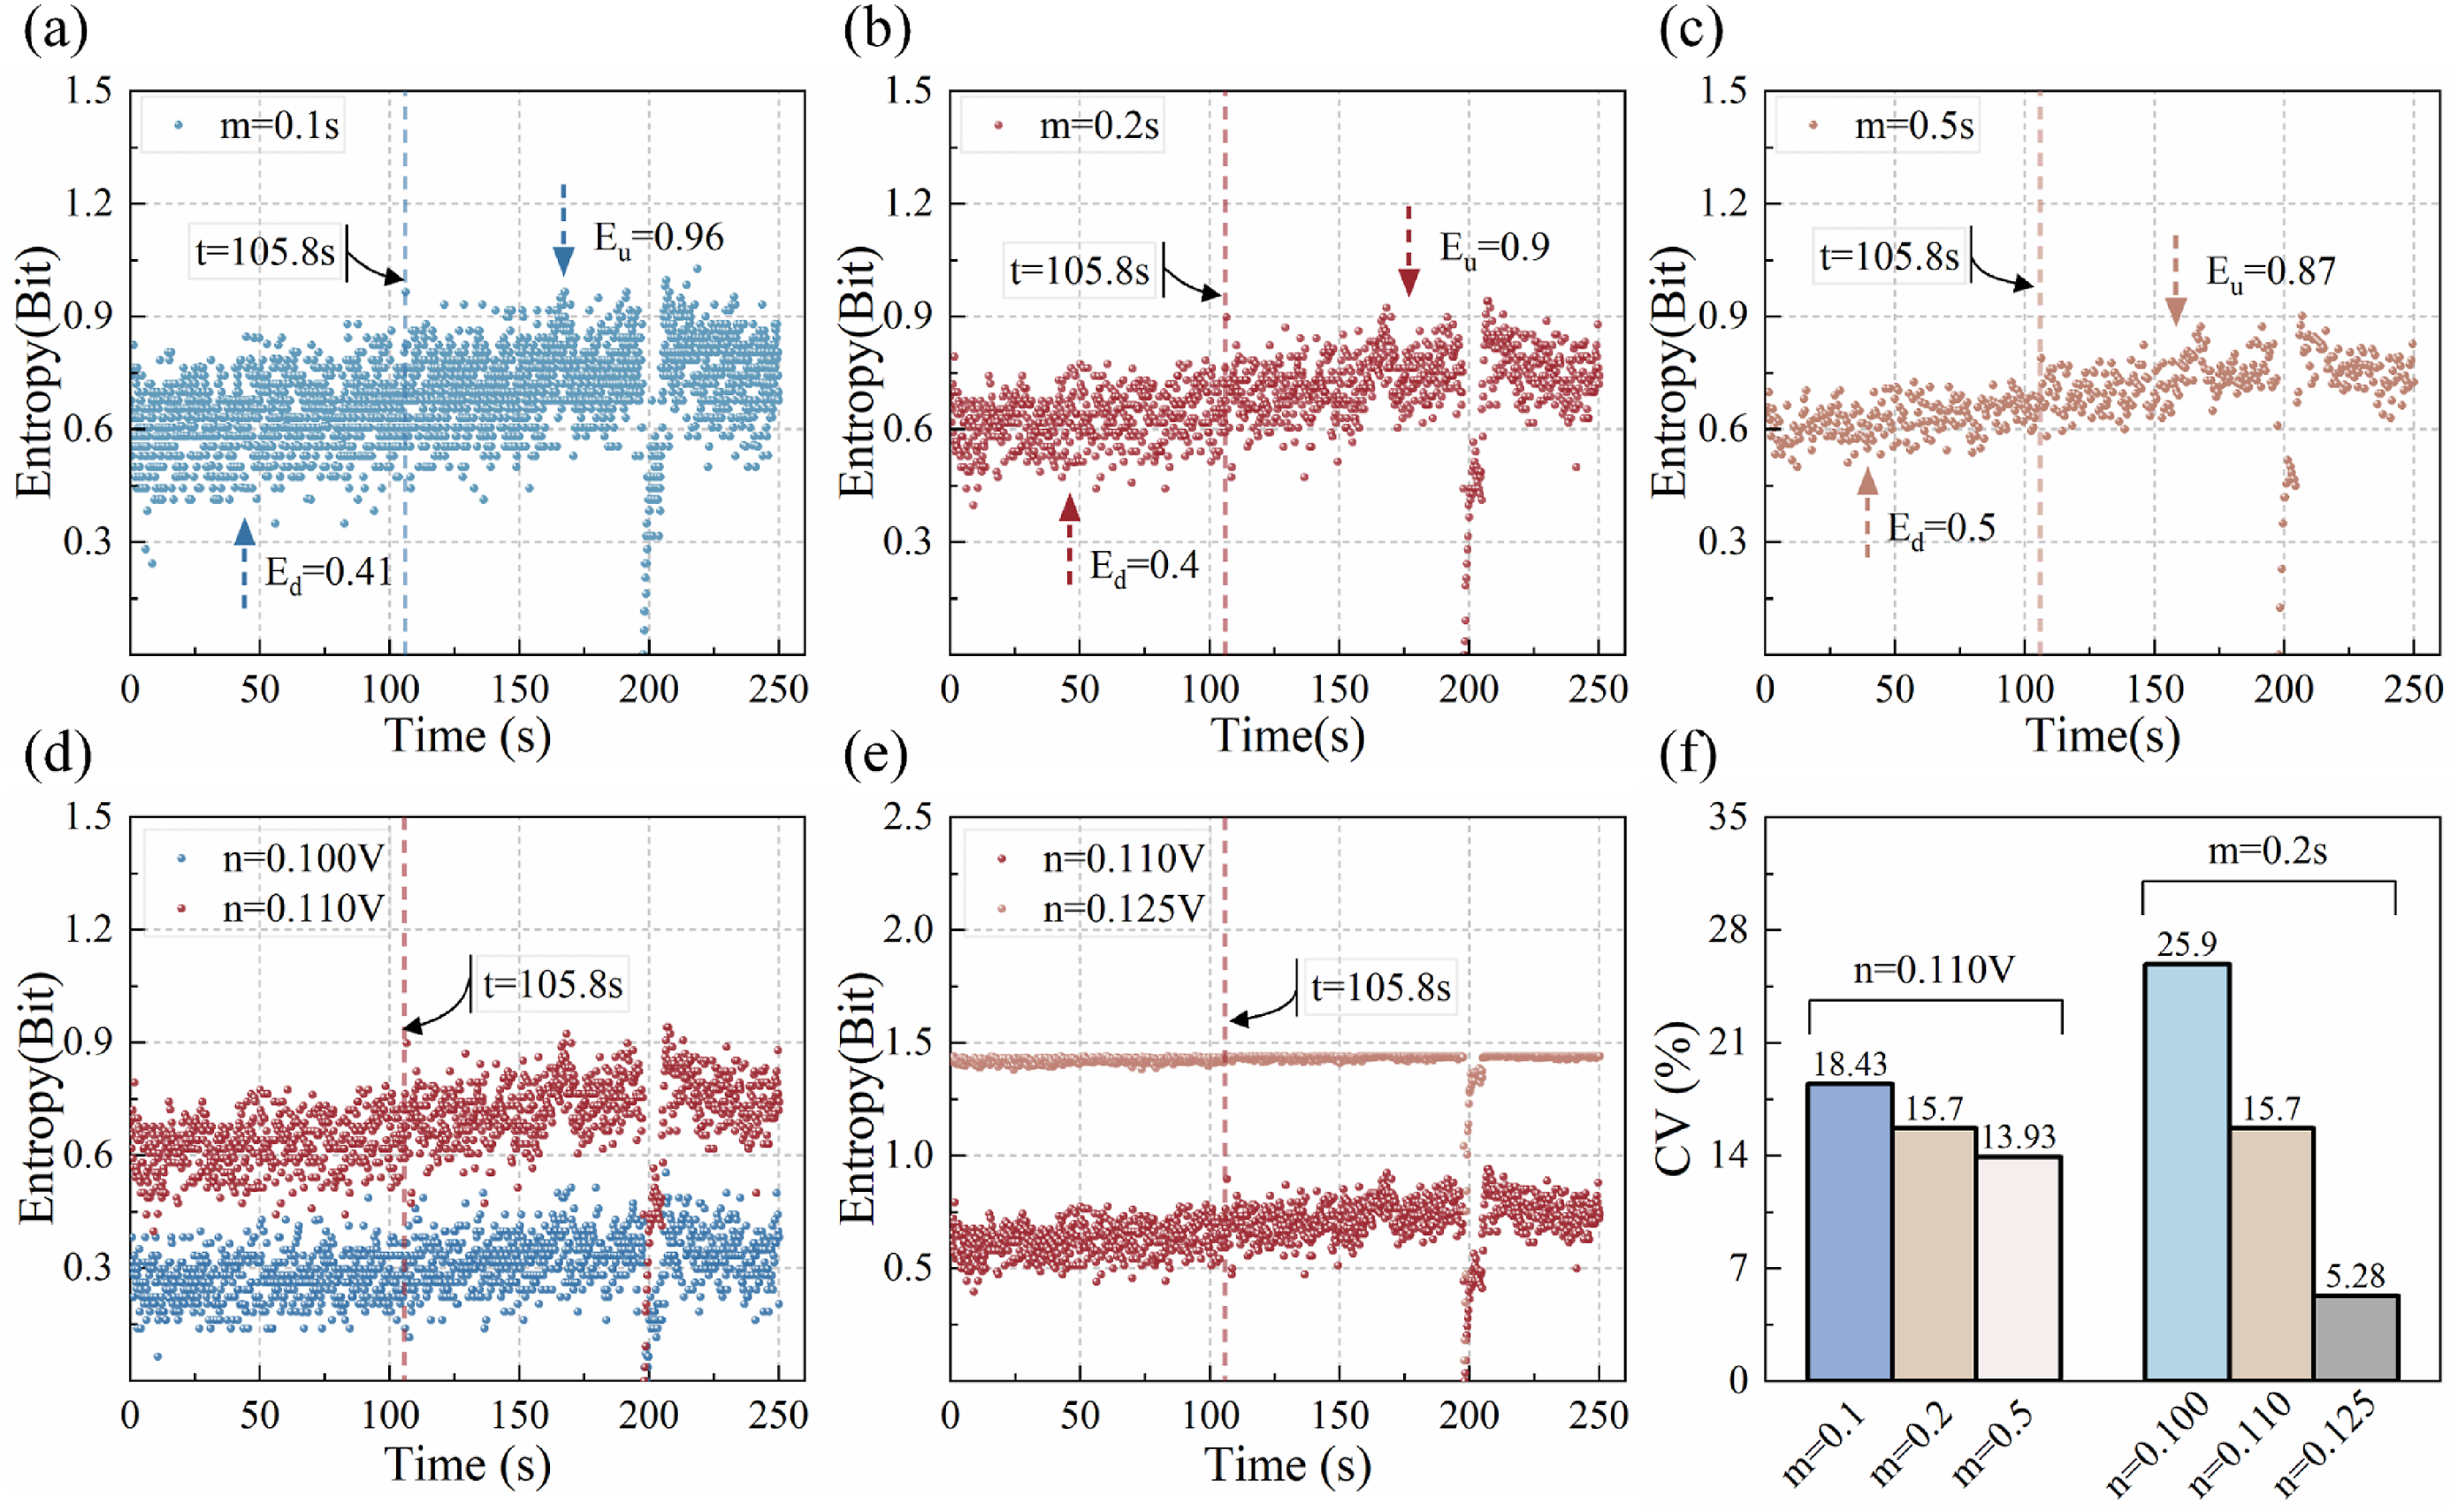
After dividing the AE waveform into m time periods, the choice of the bin width used to create the histogram is also very important for the results of the Shannon entropy calculation. A reasonable selection can result in a dense histogram, which optimizes the results of the Shannon entropy calculation. In the previous section, the bin width was selected according to Sturges’ rule, and the result was ideal. In order to study the effect of bin width on the Shannon entropy analysis of yarn stretch fracture behavior, on the basis of dividing the AE signal amplitude into 0.1 window widths, three different bin widths (i.e., 0.1 V, 0.11 V, and 0.125 V) are used, that is, the amplitude range is divided into 10, 9, and 8 bins, respectively, to calculate the Shannon entropy value of the whole process of yarn stretch fracture, and the results are shown in (d) and (e). It can be seen that the different choices of bin widths have a great influence on both the trend and the value of the evolution of Shannon entropy. It is clear that the Shannon entropy increases considerably with decreasing bin width due to denser histograms obtained at smaller bin widths. In addition, the decrease in bin width increases the computation time of Shannon entropy. Figure 7(f) shows the CV of the Shannon entropy distributions calculated using different bin widths. It is clear that the CV value is smaller as the bin width increases. This indicates that the Shannon entropy values calculated for the whole process of yarn stretch fracture for a large bin width (0.125 V) are very similar and cannot identify the internal behavioral characteristic changes of yarn stretch fracture. In summary, the selection of window width and bin width has an important influence on the Shannon entropy analysis of yarn tensile fracture behavior, and a reasonable window length should be determined according to the monitored process, while when selecting the bin width, the bin width should be selected according to the amplitude range and the corresponding rules.
Influence of external noise on Shannon entropy analysis of tensile fracture behavior
The AE signals induced by internal deformation of yarn during stretch fracture are relatively weak and have low signal-to-noise ratios, making the noise have a significant effect on the AE data. In this study, we use two improved wavelet transforms (Figure 8(a)) as previously described to reduce the noise in the AE data during yarn stretch fracture and explore the effect of external noise on the Shannon entropy analysis of stretch fracture behavior. (a) Threshold function (b) improved method I denoised signal and original signal (c) improved method II denoised signal and original signal (d) Shannon entropy change before denoising (e) Shannon entropy change after denoising in method I (f) Shannon entropy change after denoising in method II.
The conditioning factors for the two improved wavelet methods are set as
In Figure 8(d), the Shannon entropy values of the original 45/55 AE data that has not been denoised are shown. In Figure 8(e) and (f), the Shannon entropy distributions of the original AE signals after they have been denoised by Method I and Method II are shown. Compared with the undeniated Shannon entropy distribution, the three stages of the internal state Shannon entropy value preprocessed by method I denoising are easier to distinguish, and the trend of change is more obvious, while the Shannon entropy denoised by method II is not easy to distinguish the three stages. For the overall entropy value distribution characteristics, the original data show a more concentrated distribution than the denoised data, with a distribution range of [0.45, 0.90]. While the entropy value distribution of denoised data is more discrete than the original data, where the distribution range of denoised data of method I is [0.30, 0.90], and the entropy value distribution range of denoised data of method II is [0, 0.90]. It can be seen that the external noise has a certain effect on the state of the whole process of yarn stretch breakage. The method with a good denoising effect (Method I) can analyze the yarn stretch fracture behavioral characteristics more effectively, and the method with a bad denoising effect will affect the identification of the key behavioral characteristics of the whole process. On the other hand, no denoising pre-processing does not affect the Shannon entropy to analyze the internal micro-behavioral features of the yarn. This suggests that, despite the presence of environmental noise, the uncertain variation of AE waveforms mainly originates from the internal microstructural changes of the material, and the Shannon entropy analysis of yarn tensile fracture behavior is universal and applicable.
Analysis of mechanical properties during the whole process of yarn stretching
The tensile fracture behavior of yarn is a direct representation of the mechanical properties of yarn. After understanding that Shannon entropy can effectively characterize yarn tensile fracture behavior from internal state changes, we will discuss the relationship between Shannon entropy values and yarn mechanical properties. In this section, the mechanical properties of yarns are firstly evaluated directly through traditional mechanical property tests, and then the mechanical properties of different yarns are analyzed through Shannon entropy by analyzing the internal state changes at different stages of the whole process of yarn tensile fracture.
In this study, ROTOR60/40 (TC, 12 s), ROTOR45/55 (CVC, 12 s), and SIROW60/40 (TC, 12 s) were selected as specimens. Among them, ROTOR60/40 (TC, 12 s) and ROTOR45/55 (CVC, 12 s) were polyester-cotton blended yarns with two different blending ratios, and SIROW60/40 (TC, 12 s) was a polyester-cotton blended yarn with terry treatment on the surface of ROTOR60/40. In order to maintain the consistency of the tests, the conditions of the mechanical property tests were kept the same as in the previous studies.
Figure 9(a) shows the stress-strain curves of the three blended yarns. It can be found that the moduli of elasticity of ROTOR 45/55, ROTOR 60/40, and SIROW 60/40 are 0.09, 0.15, and 0.14, respectively. The magnitude of the modulus of elasticity indicates the degree of difficulty of deformation of the yarns under small loads, which reflects the rigidity of the yarns. The comparison shows that the modulus of elasticity of 60/40 is higher than that of 45/55. Therefore, 60/40 blended yarn has more rigidity. This is easily understood as 60/40 contains a higher amount of polyester and polyester fibers have higher elasticity. The difference in modulus of elasticity between SIROW60/40 and ROTOR60/40 is not significant, suggesting that the terry treatment did not alter the fiber composition and overall structure of the yarns. The tangent line method was used to determine the yield points A1, A2, and A3 of ROTOR 45/55, ROTOR 60/40, and SIROW 40/60. In the plastic deformation stage after the yield point, ROTOR 60/40 increased at a faster rate of increase to the maximum stress Fmax = 5.01 N. Comparatively, ROTOR 45/55 reached the maximum stress at a slower rate of increase (Fmax = 4.39 N). This indicates that blended yarns with high polyester content are less plastic, and blended yarns with high cotton content show better plasticity. It is noteworthy that the growth rate of SIROW40/60 is basically the same as that of the untreated terry. However, the terry-treated yarns took longer to reach the same degree of deformation and had a higher maximum stress (5.8 N) compared to the untreated yarns. This indicates that the terry treated blended yarns have better plasticity. Since the fineness of the three different materials is the same, the maximum tensile force at which the yarn breaks is its breaking strength, and the breaking strength of ROTOR 60/40 is greater than that of ROTOR 45/55, which indicates that ROTOR 60/40 has a better tensile strength. In addition, the terry treatment significantly increased the breaking strength of the yarn. (a) Tensile mechanical curves of three blended yarns (b), (c), (d) variation of Shannon’s entropy value at tensile rupture for ROTOR45/55, SIROW60/40 and ROTOR 60/40.
The AE signals of three polyester-cotton blended yarns were collected during the whole stretching process and analysed using Shannon entropy in order to investigate the relationship with the mechanical properties of the yarns. Under the setting of 0.2 s window width and 0.11 V box width, the entropy distributions of the three blended yarns are shown in Figure 9(b)–(d). The entropy values of ROTOR45/55 are mainly located at [0.45, 0.90], ROTOR60/40 at [0.20, 0.60], and SIROW60/40 between [0.10, 0.45]. Overall, ROTOR45/55 has the highest entropy value and SIROW60/40 has the lowest, indicating that polyester fibers are more crystalline and regular, reducing systematic disorder. The Terry treatment made the yarn flatter and tighter and reduced the entropy value. However, the entropy values of the yarns with different blending ratios showed an increasing trend, reflecting the increase in internal structural disorder, which led to a decrease in the overall strength of the yarns.
It is clear from the above study that the three stages of the entropy value change curve correspond to the stages of elasticity, plastic deformation, and fracture, and we compare and analyze the differences in the mechanical properties of the three blended wires from each stage. In stage 1, the entropy values of the three blended yarns have a small increase. However, ROTOR45/55 has a larger increase, ROTOR60/40 has a more stable change in entropy value, and SIROW60/40 with terry surface treatment is the most stable. This indicates that the internal structure of the polyester-cotton blended yarn containing more polyester content (ROTOR 60/40) is less prone to deformation when subjected to stretching and is relatively more rigid, and the terry treatment gives the yarn better rigidity. At stage II, although the Shannon entropy of the three blended yarns increased by about 0.3 bit, the rate of increase was different. Among them, ROTOR 45/55 increased at a smaller rate, and ROTOR 60/40 reached the maximum entropy in a shorter time. The entropy value fluctuates and changes up and down, although there is an increasing trend in the blended yarn after terry treatment. Compared with ROTOR55/45, ROTOR60/40 undergoes rapid irreversible deformation of the internal structure when subjected to force and has poorer plastic properties. This indicates that polyester/cotton blends with higher cotton content have relatively better plasticity, and the internal structure of ROTOR60/40 is more stable after terry treatment. In stage III, the entropy at break point of 60/40 blended yarn was lower than that of 45/55 blended yarn, and the entropy at break of 60/40 blended yarn after terry treatment was lower. The higher entropy value during the whole stretching process of the blended yarn reflects the greater disorder of the internal structure of the yarn, which is more easily damaged, and therefore the 45/55 blended yarn has a lower tensile strength.
As mentioned earlier, the results of the mechanical property analysis of the three stages of the entropy change curve are consistent with the results of the conventional mechanical property test. During the whole process of yarn stretching, the increasing Shannon entropy indicates the transformation of the internal state of the yarn from ordered to disordered. The Shannon entropy analyzes the degree of disorder of the internal state at different stages of the whole process of yarn stretching, which intuitively reveals the mechanical properties of different yarns. At the initial stage of yarn stretching, the entropy value is low and stable, which usually indicates that the yarn has good rigidity. As stretching proceeds, the entropy value gradually increases and the yarn strength gradually decreases. The rate and magnitude of entropy increase at this stage can provide information about mechanical properties such as plasticity; for example, a high entropy increase rate means poor plasticity.
Conclusion
In this study, the tensile fracture behavior of the whole process of stretching was analyzed at the microscopic level using Shannon entropy and compared with the results of the AE amplitude parameter and the two time-frequency analyses. In addition, the effects of the two parameters and external noise on the feature information of the whole process of yarn stretching extracted by Shannon entropy were explored. Finally, based on the characteristics of entropy change during the whole process of stretching, the differences in mechanical properties of different yarns were analyzed. The results of this study are summarized as follows: (1) The Shannon entropy is better than the AE amplitude at showing how the internal state changes during the whole process of stretching yarn. This is true for both SWT and FSWT analyses. During the whole process of yarn stretching, the Shannon entropy value ranges from low and stable to rapidly increasing, reaching a peak and then suddenly decreasing. This coincides with the elasticity, plasticity, and fracture stages of the tensile strength test. What’s more, the evolution curve of Shannon entropy can also keenly capture the changing characteristics of the internal structure of the yarn, such as the breakage of the internal fibers. (2) The entropy change curves visually reveal the mechanical properties of different yarns. A low and stable entropy value at the initial stage indicates good yarn stiffness. During the stretching process, the entropy value rises gradually, reflecting the irreversible deformation of the fibers. The rate and magnitude of change in the entropy value provide information about the ductility and plasticity of the yarn. The degree of sudden change in the entropy value as the stretch approaches the breaking point reflects the tensile strength of the yarn. (3) Window width and box width have an important effect on the tensile fracture behavior of yarn, and a reasonable choice of window width and box width can characterize the tensile fracture behavior more effectively. Shannon has good applicability and can extract the weak signal at a low signal-to-noise ratio without denoising the original signal of AE.
In this paper, the effectiveness of Shannon entropy monitoring the state of the whole process of yarn stretching is verified, which provides a solid theoretical foundation and practical guidance for the quality assessment of yarn, optimization of yarn performance, and research and development of new yarns. Future research can be devoted to the development of a real-time Shannon entropy monitoring system. However, in the fast-paced textile production environment, achieving this goal faces many challenges, such as accurate, high-frequency data collection and processing.
Footnotes
Declaration of conflicting interests
The author(s) declared no potential conflicts of interest with respect to the research, authorship, and/or publication of this article.
Funding
The author(s) disclosed receipt of the following financial support for the research, authorship, and/or publication of this article: The Special Support Plan for High-Level Talents in Zhejiang Province: the Provincial Ten Thousand Talents Plan; 2023R5212, the Science and Technology Department of Zhejiang Province; 2024C01124 and the Science and Technology Plan of Zhejiang Province; 2024SJCZX0027.