
Abstract
Piezoelectric needle selectors, as key weaving components in the jacquard knitting process of knitting machinery, are widely used in textile equipment. Accurate diagnostic procedures for needle selector drive faults are crucial to ensure the normal operation of the equipment. However, traditional vibration diagnosis methods cannot detect weak periodic signals, resulting in low accuracy of monitoring results. To address this issue, this paper proposes an adaptive stochastic resonance (SR) method based on an improved generative adversarial network (IGAN). Firstly, in order to solve the problem of difficulty in obtaining stochastic resonance parameters, SR is combined with IGAN, and IGAN provides the optimal SR parameters. Secondly, a soft threshold residual attention mechanism and residual network were introduced in the GAN network, and multiple generators were utilized to alleviate the problem of model collapse, in order to adapt to the actual working environment. In addition, due to the large amount of data, it is recommended to use feature parameters for training to improve the efficiency of model training. Finally, through a typical vibration data, the influence of different parameter quantities on the training accuracy of the model was studied, and the superiority of the proposed model compared to other models and the stability of the model under different environmental influences were explored. The results show that this method can effectively detect weak periodic signals of the needle selection driver, effectively alleviate the problem of model collapse in different environments, and is superior to existing methods in terms of accuracy and stability.
Keywords
Introduction
Electronic needle selectors play a key driver role in the jacquard work of knitting machines. There are two main types of needle selectors: electromagnetic needle selectors and piezoelectric needle selectors. In the textile industry, the piezoelectric needle selector is a key device that is used to control the selection and movement of needles during the weaving process. This device utilizes the properties of piezoelectric materials to move the needles by applying a voltage to achieve high precision and efficiency in weaving. Piezoelectric needle selector has the characteristics of rapid response, low heat generation, small volume, suitable for multi-way needle selection and fast response requirements, so most high-end textile equipment more than the use of piezoelectric needle selector, as a jacquard needle driver, in the selection of the needle hook into the loop process, its performance is related to the quality of jacquard knitting production. Nowadays, piezoelectric needle selectors are widely used in all kinds of looms, including spinning and weaving machines, for the production of various textile materials. As a result, the problem of malfunctioning piezoelectric needle selectors is becoming more common and is being paid more attention to. The working mechanism of the needle selector is generally a one-way controller to send jacquard knitting instructions to the needle selector, the needle selector drives the cutter head to act on the jacquard needles, to control the jacquard needles whether to participate in the loop, so as to realize the jacquard knitting control. In the process of knitting, once the needle selector action is abnormal, it will lead to wrong flowers, fabric holes and other defects, and even machine failures such as needle collision, needle breakage and so on. The abnormal operation of the needle selector is generally due to the gradual failure of the piezoelectric chip and transient failure, transient failure refers to the drop of the drive parts leading to abnormal needle selection, often easy to find, but the gradual failure of the needle selector, such as the piezoelectric chip crystal aging, breakage of the weak cyclic signal is difficult to be found. Troubleshooting of piezo needle selectors is crucial in the textile industry. Companies need to conduct regular equipment inspection and fault analysis to ensure production continuity and high product quality. At the same time, as technology continues to advance, the need for fault detection of piezoelectric needle selectors will become more significant in the future.
For the mechanical fault diagnosis of weak periodic signals, there are some detection methods, which are usually categorized into two major types: cycle detection based on signal decomposition techniques and cycle detection based on resonance techniques. Signal decomposition techniques are usually applied when the target signal is non-stationary and strongly disturbed. 1 Traditional fault diagnosis methods are difficult to overcome the strong noise background interference, resulting in low diagnostic accuracy. Moreover, it is difficult to ensure high accuracy when detecting weak periodic signals, 2 and it is difficult to effectively extract the periodic components. 3 The stochastic resonance (SR) technique is widely used in signal processing, and its core concept is to enhance the target weak signal by random noise, thus strengthening the potential weak fault characteristics. Achieving an optimal stochastic resonance response depends on the best choice of nonlinear system parameters and noise intensity. In the current development of stochastic resonance, a number of different parameter selection methods have been proposed by researchers. Mi et al. 4 developed a gene transcription regulation model driven by a combination of multiplicative Gaussian noise and additive Lévy noise, which helps to obtain optimal stochastic resonance by tuning the noise parameters to obtain genetic information. Zhang et al. 5 presented two single-parameter-tuned SR models to optimize the output of SR by numerical simulations with different potential well parameters, noise intensity, signal frequency and damping ratio, which were fully investigated. Previous studies are usually based on experience and understanding by providing a set of system parameters and adjusting them appropriately when needed. However, this approach makes it difficult to obtain the optimal system parameters to achieve the desired SR response.
In order to obtain the optimal system parameters, there have also been several studies devoted to combining SR and machine learning. Chen et al. 6 proposed a hybrid training algorithm for threshold neural networks using adaptive stochastic resonance to provide the algorithm with suitable generalization capabilities. Shao et al. 7 trained a robust neural network that can recognize the raw data converted by the SR system into a special SR characteristic of the nonlinear waveforms. Yu et al. used 8 stochastic resonance with tracking the rhythms of subthreshold pacemakers to significantly improve signal detection by broadening the optimal noise intensity range for subthreshold signals. Although these studies have combined machine learning techniques with classical SR theory, they are limited to integration at the mechanism level and have not yet been practically applied in the field of fault diagnosis.
Considering the capability of machine learning techniques in data mining and nonlinear fitting, this paper proposes to uncover the correlation features between vibration signals and SR parameters through neural networks. 9 Thereby, an adaptive SR method is constructed so that the system will automatically generate the optimal SR parameters given the vibration time series. 10 For the fault diagnosis of needle selector tip based on neural network method, there are two urgent problems to be solved. On the one hand, labeling a large amount of data is an extremely difficult task; on the other hand, it is difficult to collect data of the cutterhead in all operating states for training due to the excessive amount of data. To address these problems, Generative Adversarial Network (GAN) is proposed as an adaptive tool to obtain the optimal SR parameters, and this network model provides a new training mode which is able to expand the training samples under small sample conditions, and generates close to the real value by utilizing unlabeled samples for network training. Prediction results. In the current research, GAN has been applied in some fields. Guo et al. 11 proposed a graphical generative adversarial network model, which maps the real data to the potential space by adding an encoder to improve the training efficiency and stability for anomaly detection in dynamic networks; in the field of fault diagnosis, Zhang et al. 12 pre-processed the data through the feature pre-extraction mechanism based on the wavelet transform, and combined the limited number of labeled samples and the large number of unlabeled samples with a large number of labeled samples. In the field of fault diagnosis, Wang et al. 13 preprocessed the data through a feature pre-extraction mechanism based on wavelet transform, and sent a limited number of labeled samples and a large number of unlabeled samples to the GAN model to achieve fault diagnosis of high-precision gearboxes.
From the results of the above studies, GAN shows some advantages in fault diagnosis, especially applied to unlabeled and small-sample machinery fault diagnosis. 14 However, in the actual training process, there are some problems, among which, the more prominent is that GAN is prone to training instability and generator crash during the actual training process leading to a decline in the quality of the generated data. 15 To address this problem, this paper utilizes the soft-threshold residual attention mechanism in combination with residual networks and employs multiple generators to improve the GAN in order to prevent the model from crashing, instability and other problems. 16
In this paper, an improved generative adversarial network (IGAN) combined with SR technique is proposed to detect the fault signals of the needle selector actuator to accomplish the fault diagnosis scheme of the needle selector tip. The main contents are organized as follows: Firstly the basic theoretical knowledge of SR and IGAN is introduced in detail. Secondly, the formulas for the characteristic parameters of the signals are provided as well as the implementation process of the adaptive SR based on IGAN. Finally the results of fault diagnosis are presented, the influence of the number of feature parameters on the diagnostic accuracy is analyzed, and the superiority of the proposed IGAN model over other GANs as well as the stability under the influence of different environments are investigated.
Theoretical background
Piezoelectric needle selector working principle and failure form
Piezoelectric needle selector uses the inverse piezoelectric effect of piezoelectric ceramics, under the action of the voltage signal, the piezoelectric cantilever beam end bending, driven by the needle selector head swing, control jacquard needles to participate in the knitting, so as to realize the jacquard knitting control. Piezoelectric needle selector is characterized by rapid response, low heat generation and small volume, which is suitable for multi-way needle selector and fast response requirements, and therefore is widely used in jacquard knitting of various circular weft machines.
In the piezoelectric needle selector, the oscillation of the piezoelectric ceramic sheet up and down the cantilever beam is controlled by adjusting the loading of the electrodes to drive the cutter head to complete the jacquard action. As shown in Figure 1(a) is an actual photograph of the needle selector in a circular weft machine. However, in practice, due to the high frequency of the piezoelectric needle selector, it is prone to weak failure characteristics such as aging of the crystals and peeling of the adhesive layer of the piezoelectric ceramic sheet as shown in Figure 1(b). The gradual accumulation of these failure problems may lead to the needle selector head swinging out of place, reduced jacquard force, reduced operating frequency and unstable operation, which in turn causes quality problems such as flower needle, wrong flower and fabric holes in the fabric. Piezoelectric needle selector (a) Needle selector in circular weft machine (b) Needle selector damage and aging schematic diagram.
The piezoelectric crystal of the driver is aging due to long time working, the middle cement layer is peeling off, the cutter head is stuck, and the swing is not in place, etc. In Figure 2(a), ① shows the motion sketch of the needle selector in the normal state, In normal operation, the cutter head of the needle selector drive swings up and down and the cutter head is able to strike the appropriate position, and ② shows the situation that the cutter head is not in place due to the aging of the piezoelectric wafer of the piezoelectric selector, and the corresponding time-frequency diagram of the sampled electrical signals is shown in Figure 2(b)①②, and the blue line represents the characteristic spectrum of the electrical signal in the normal state, but the specific frequency magnitude is the same in the frequency domain. The blue line in the figure represents the characteristic spectrum of the electrical signal under the state of head swing not in place, and the red line represents the characteristic spectrum of the electrical signal under the normal state, the overall trend of the spectrum in the frequency domain of the two states is the same, but the size of the specific frequency is different, the characteristic frequency of the electrical signal generated by the equivalent circuit under the asymptotic failure state is relatively small, and the amplitude of the signal generated by the impact of an external force and the characteristic frequency is slightly reduced. Therefore, it is difficult to distinguish whether or not a failure occurs by the electrical signal in this weak failure state. (a) Schematic diagram of the fault characteristics of the needle selector (b) Signal waveforms of the driver for different fault conditions.
Figure 2(a)③ shows the dislodgement of the needle selector drive member, and its corresponding time domain diagram is Figure 2(b)③, which does not have a sudden change in the electrical signal generated by the impact in the time domain.
Figure 2(a)④ shows a Situation where the cutter head is jammed. Its corresponding time domain diagram is shown in Figure 2(b)④. When the cutterhead of the piezoelectric needle selector is stuck between the teeth and grooves of the baffle plate or the free end of the driver and the hinged part of the cutterhead assembly are stuck, the cutterhead and the baffle plate will not collide at this time, and therefore, there is no sudden electrical signal generated by the impact in the time domain. As can be seen from Figure 2(b)④, when the cutter head is stuck between the teeth of the baffle plate, the amplitude of the oscillation of the piezoelectric ceramic internal signal is small.
In summary, the weak periodic signal in the gradual failure operating state of the piezoelectric needle selector is not easy to detect. Since there are few measurement points to monitor the vibration of the needle selector drive in the needle selector drive monitoring, and these gradual failure failure characteristics are gradually accumulated over time, it is usually difficult to timely and solve. Therefore, there is an urgent need for an effective and stable detection method to detect these weak cyclic signals to complete the fault diagnosis of the needle selector driver.
IGAN-based stochastic resonance method
Aiming at the problem that the weak periodic signals of the piezoelectric needle selector asymptotic failure are difficult to detect, which leads to some of its fault characteristics being difficult to be found, it is proposed to use the stochastic resonance method to strengthen the weak fault signals.
Stochastic resonance
In stochastic resonance systems, the principle is to enhance the weak periodic signal by noise, thus improving the detection performance of weak fault features and thus enabling fault diagnosis.
17
The dynamics of a nonlinear system can be described by the Brownian equation of motion as in equation (1). A bistable system consisting of weak periodic signals and Gaussian white noise excitations constitutes an overdamped stochastic resonance model.
18

Generative adversarial network
The basic block diagram of GAN is shown in Figure 3, GAN consists of two neural networks, generator (G-Net) and discriminator (D-Net), using random noise as the input to the generator, random samples similar to the real samples are generated by the G-Net, and then the D-Net receives the data generated by the G-Net to discriminate, and if the D-Net correctly determines the data, then the G-Net needs to be adjusted If D-Net judges correctly, it needs to adjust the parameters of G-Net to make the fake data more real, and if D-Net judges incorrectly, it needs to adjust the parameters of D-Net to enhance the accuracy of its judgment and prevent the same error from occurring next time.
21
Thus these two neural networks form an antagonistic process, which ultimately makes the fake data generated by G-Net more realistic and difficult to discriminate, while D-Net is able to distinguish between real and fake data more accurately.
22
Schematic diagram of generative adversarial network structure.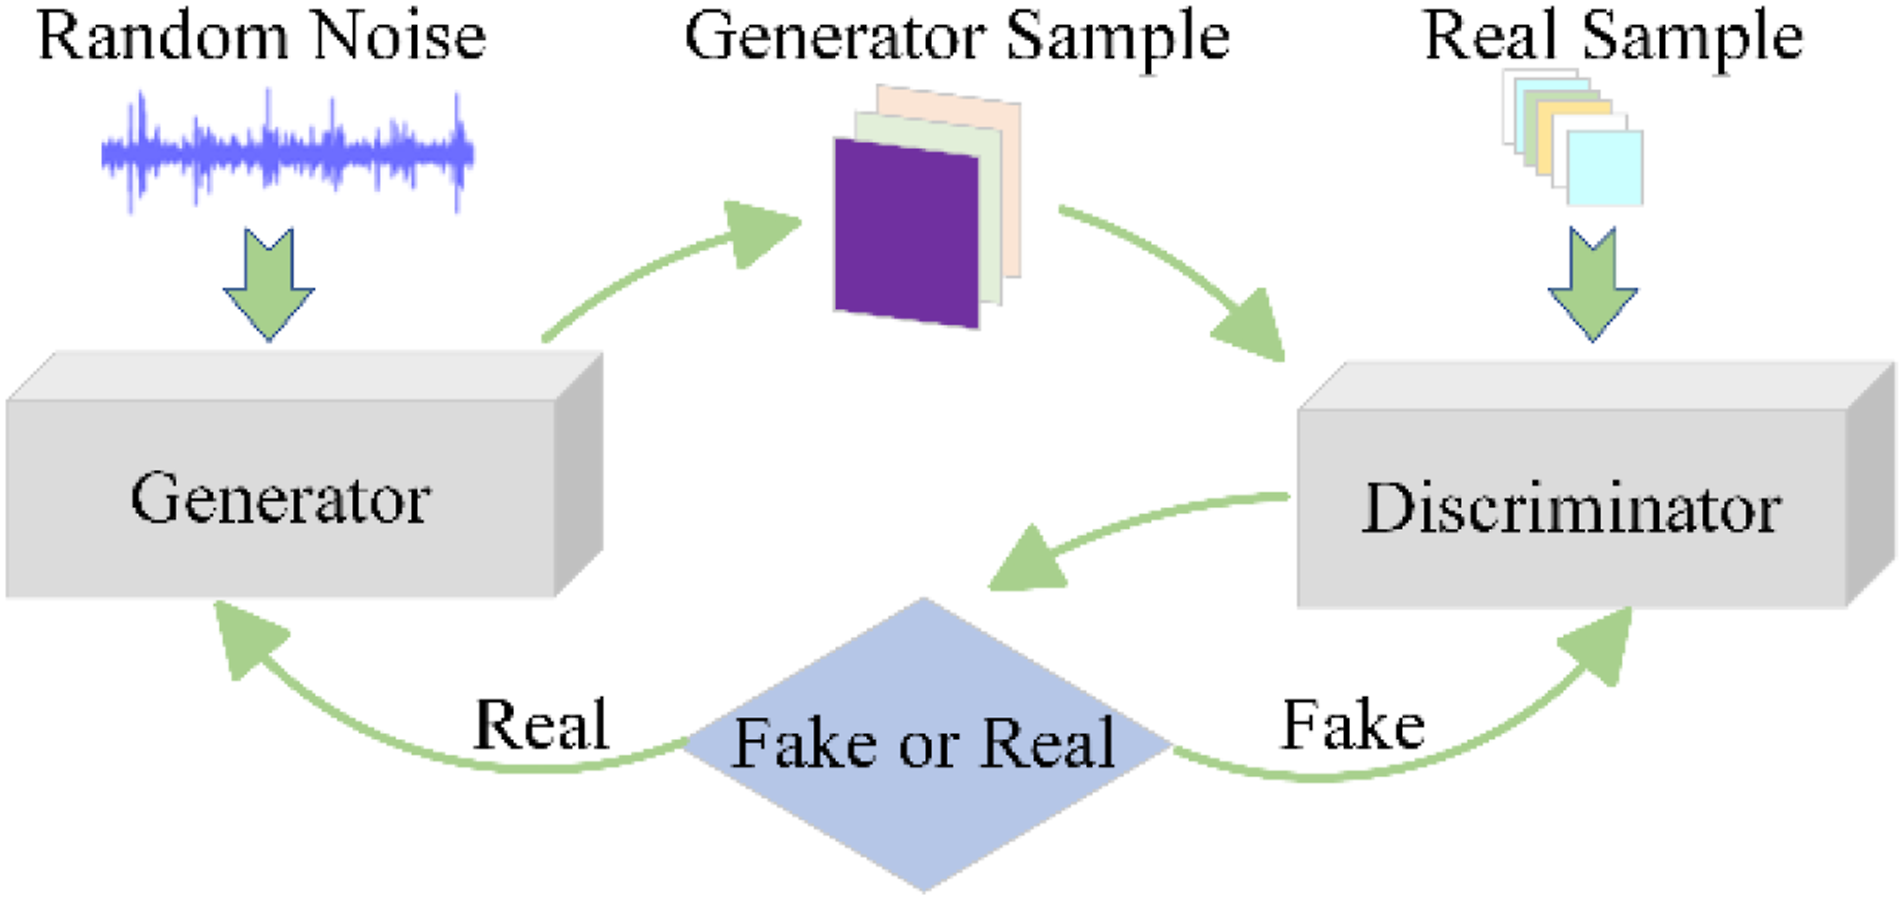
The training of a GAN can be reflected by an optimization equation as equation (2).

However, the GAN model is prone to training instability, generator crash and other problems that lead to degradation of the quality of the generated data in the process of practical application, by reviewing the relevant literature, this paper introduces the residual attention mechanism based on soft threshold and residual network, which is described in detail in detail below.
Improved generative adversarial network (IGAN)
To improve the performance and stability of the model, we introduce a residual attention mechanism based on soft thresholding.
23
Soft thresholding is a nonlinear transformation method used in signal processing, which works by applying a threshold to the signal that has been softened to remove the unwanted parts and retain the desired parts.
24
This method maintains the important features of the signal and at the same time reduces the noise in the signal. The self-learning process of thresholding is shown in Figure 4. Soft threshold residual attention mechanism self-learning process.
In order to solve this problem that GAN neural networks are prone to gradient vanishing and gradient collapse during training, the use of residual learning is proposed to simplify the training of deep networks.
The basic formula for the residual network is expressed as equation (3).

Conventional convolutional neural networks are first convolved and then batch normalization (BN) and activation functions are added.
25
In order to enhance the training efficiency and performance of the residual network, a pre-activation module is introduced, and in this study, full pre-activation of the residual connections is considered, and the basic module of the residual network is shown
26
in Figure 5 Basic modules of residual networks.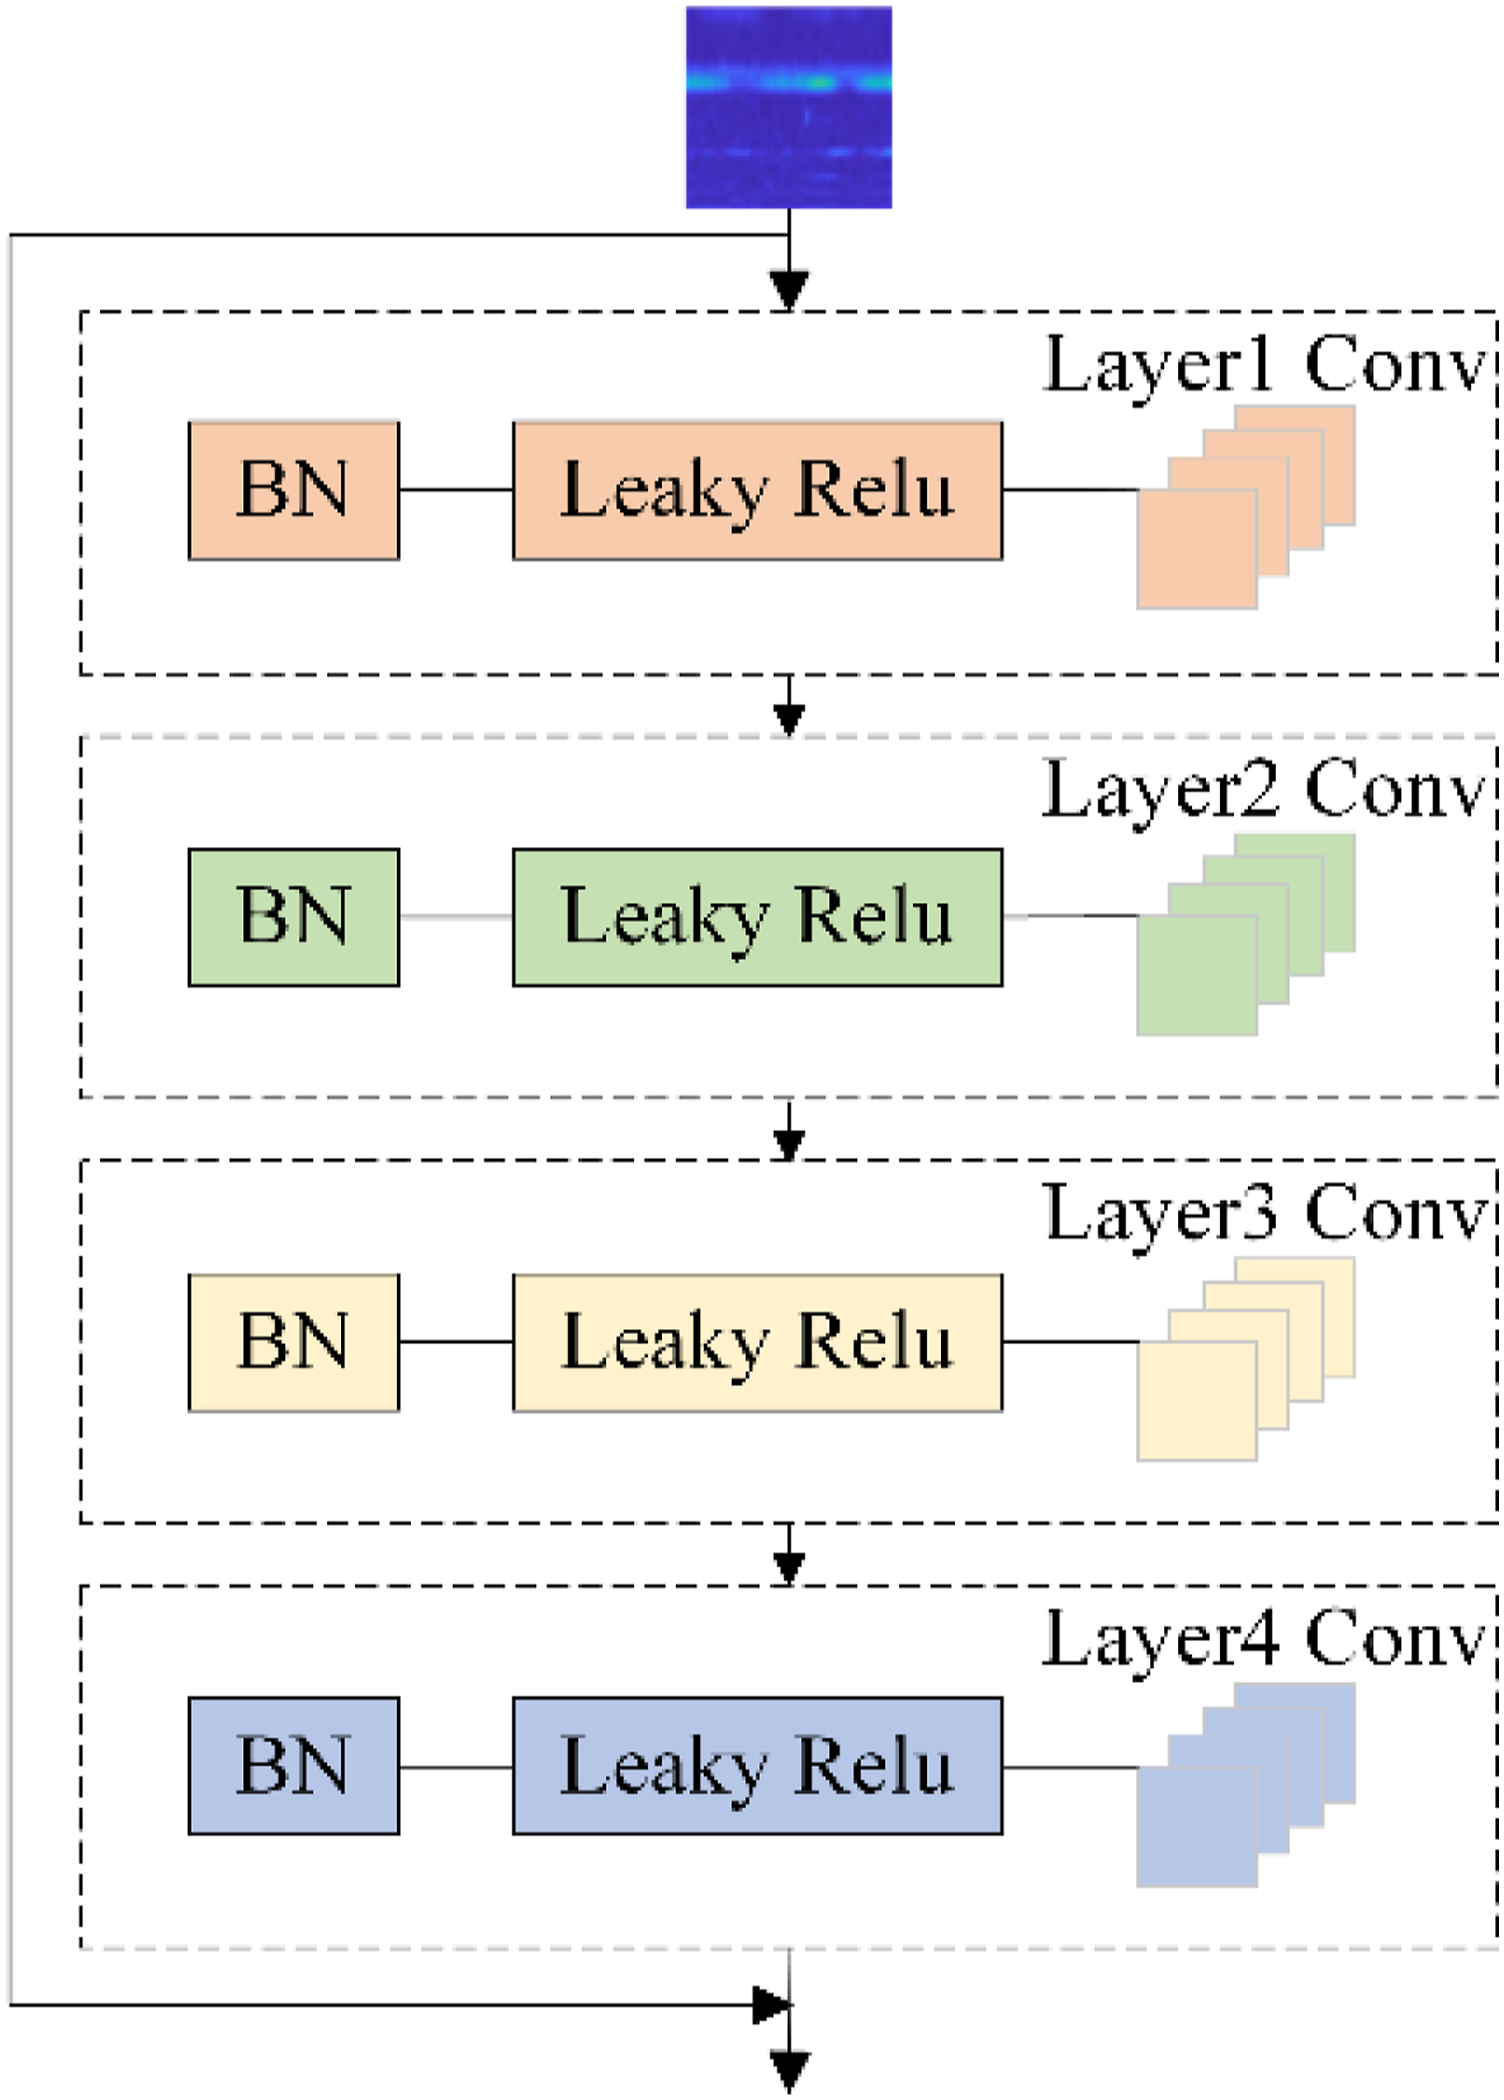
The improved GAN model (IGAN), whose structure is shown in Figure 6, uses an independent alternating training pattern to train two network models during the IGAN training process. In this Situation, during the training process of the G network, multiple sub-generators are fed into the original target signal with noise to generate false samples, and these false samples are labeled as real samples, and at the same time, the parameters connecting to the D network are not updated but are used to pass the error information. When the error is passed to the G network, the parameters of the G network are updated to complete the training. After the training is completed, new fake samples are generated based on the new G network and the training of the D network is performed. After the training of D network, its parameters can be shared with the connected D network. By performing this process repeatedly, the independent rotation training mode of IGAN is realized. It is characterized by the fact that D tries to distinguish samples from multiple sub-generators rather than just from a single G. This approach helps alleviate the problem of G collapse and increases the diversity of generated samples. Block diagram of the basic structure of IGAN.
A residual network is used instead of the original convolutional layers in the G and D networks to improve network training. This residual network uses a fully pre-activated structure, which is different from other residual networks. The residual network allows the gradient to flow directly between the layers, which alleviates the problem of vanishing gradients, speeds up convergence, and improves the stability of training. In addition, residual networks allow deeper layers to be constructed without compromising performance, which is crucial for GANs, as they often require large and complex networks to generate more realistic signal data.
In addition, introducing soft-threshold residual attention into G and D allows them to capture trustworthy samples from a wide range of different patterns, which speeds up information acquisition and improves the performance of G and D. By introducing soft-threshold residual attention into the network, the learning and representation capabilities of the model can be enhanced and the performance of G and D can be improved, as well as the robustness of the model, its sensitivity to random perturbations can be reduced, its generalization ability can be improved, and its adaptability to new data can be enhanced.
Methods
Calculation of target signal characteristic parameters
In the fault diagnosis system, the appropriate choice of parameters a
1
, b
1
,M is crucial for generating the SR response. The nonlinear system of parameters a
1
, b
1
, M inducing SR’s x(t),can be expressed as equation (4).
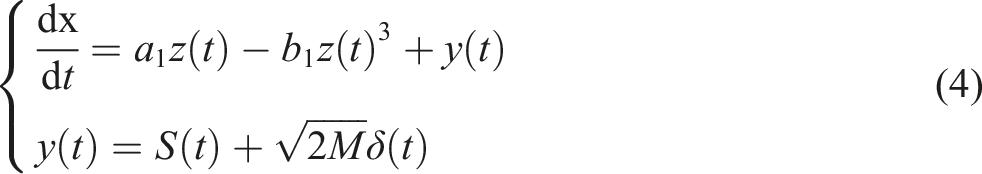
Since it is difficult to obtain the optimal SR response by traditional SR parameter selection methods, the generation of reliable parameters a 1 , b 1 , M using IGAN is the focus of this study, and in this study we utilize the game process between G-Net and D-Net to train the optimal SR parameters.
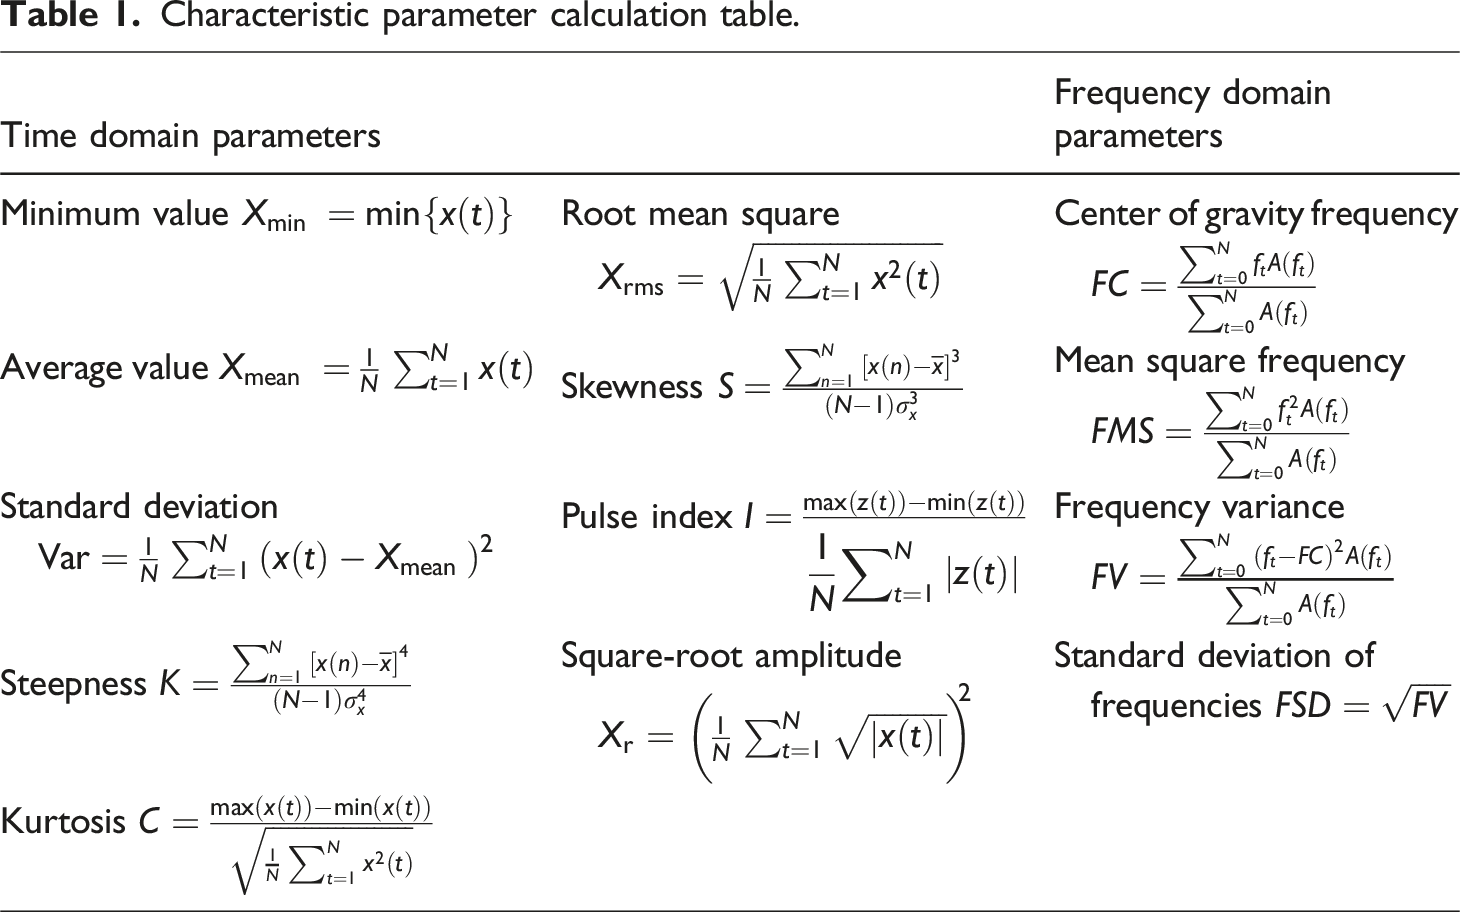
Characteristic parameter calculation table.
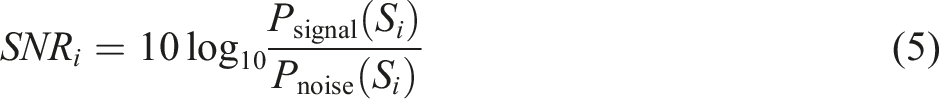
In this paper, we continue the classical signal-to-noise ratio (SNR) metric to evaluate the effect of stochastic resonance, and the signal-to-noise ratio (SNR) can be described as equation (5).
27
Fault diagnosis of IGAN based stochastic resonance methods
After calculating the feature parameters of the real sample and inputting them into G-Net, G-Net will produce three outputs, that is, the bistable system parameters a 1 , b 1 and the noise intensity M, which interact with the noisy vibration signals y(t) corresponding to the 10 input feature parameters to form the SR phenomenon according to equation (1) and realize the fault feature extraction.
The fault diagnosis process of the adaptive SR method realized by IGAN is shown in Figure 7. Firstly, the vibration signal data of the needle selector tip is collected, and in order to grasp the characteristics of the signal data, the time-domain and frequency-domain parameters of each vibration signal data are calculated, and then Gaussian noise sequences are added to the vibration signal data, and each set of data is processed by the SR system, and the optimal SR parameters (a
1
, b
1
, and M) are calculated, and the (SNR, K, C, and I) are calculated accordingly. Combining the optimal SR parameters (a
1
, b
1
, and M), each noisy simulated data corresponds to 14 characteristic parameters as shown in equation (7). Block diagram of SR-IGAN structure.
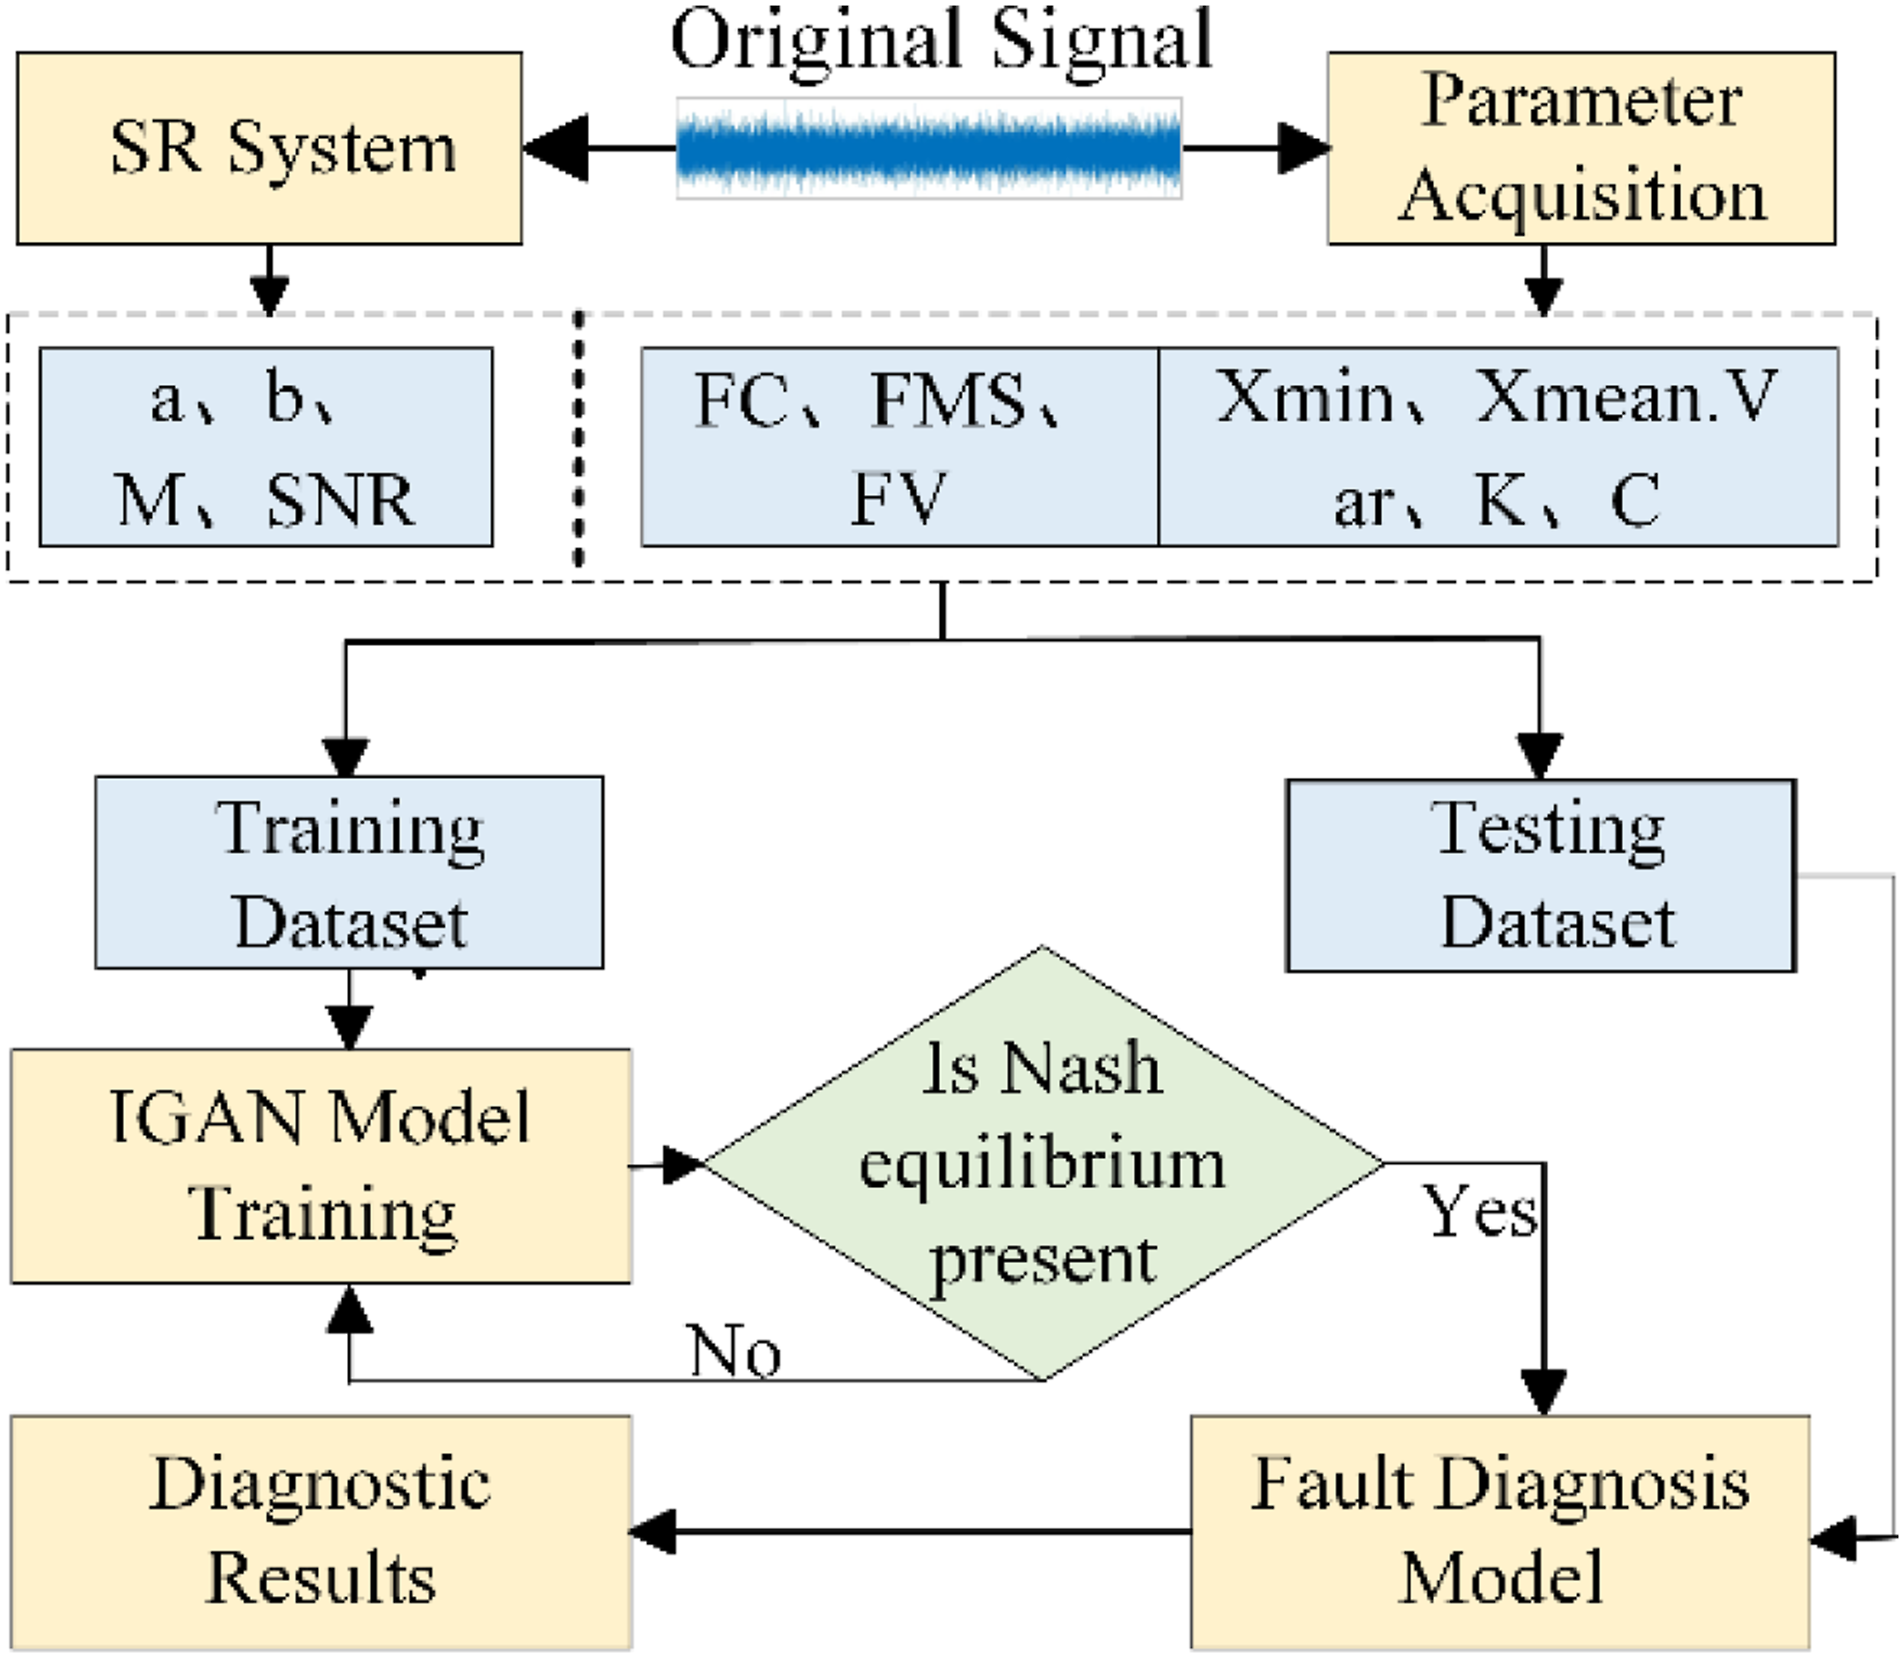
The data is divided into two parts, one as a training set and the other as a test set. At this point, the real samples for inputting into the IGAN network are made. All the samples are normalized before training, and then the training set is input into the IGAN network for training. After completing the IGAN training, the test set is input into the generated network weight file, and the G-Net can adaptively generate a set of SR parameters in response to the noisy signals, so as to stimulate the nonlinear system to produce SR phenomena for periodic extraction and fault diagnosis.
In order to better evaluate the performance of the proposed method, the binary cross entropy is used as the loss function, denoted as equation (8).
Results and discussion
The vibration health detection based on the inverse piezoelectric effect in textile machinery is currently in the exploratory stage, there is no relevant dataset, in order to analyze the feasibility and accuracy of the proposed method in the diagnosis of the needle selector head fault, A needle selector failure test platform was built, as shown in Figure 8, for obtaining the original fault signal data. Specific steps are as follows: first of all, through the signal generator to generate a square wave signal, the output of the square wave through the power amplifier output 250 V, 100 Hz signal, and then use the signal to drive the failure of the needle selector drive work, and finally through the oscilloscope to observe the piezoelectric ceramic piece of the inverse piezoelectric effect generated by the voltage signal.
29
Needle selector failure test Bench.
The time-frequency diagram of the vibration signal is shown in Figure 9(a), and the vibration data are generated by the electrical signal inside the vibration of the piezoelectric needle selector. The vibration signal may have strong coupling characteristics between components and large vibration noise, in order to better analyze the effectiveness of the proposed method in fault diagnosis, Gaussian white noise with intensity 1 is added to the simulation data, and the time and frequency domain results of the mixed signal are shown in Figure 9(b). The strong noise completely drowns out the periodic fault characteristics.
30
This vibration data is used as the target signal to be processed in this section. Normal time-frequency diagram of the needle selector (a) Time-frequency diagram of the original vibration electrical signal (b) Time-frequency diagram of the vibration electrical signal mixed with noise.
Effect of sample feature parameters on SR response
In the real fault diagnosis application of the pinpoint selector, in order to obtain the optimal SR parameters by IGAN, some real samples are firstly applied to input the IGAN adversarial network for training, and in this study, 13 feature parameters of the mixed noise in Figure 9(b) are selected to create the real samples. Therefore, the SR response of the model will be affected by the input samples, and the effect of the number of feature parameters of the original noise signal on the SR response will be investigated in this section. The effect of the time-domain parameters of the original noise on the SR response is investigated first; followed by the effect of the frequency-domain parameters and the combination of frequency-domain and time-domain parameters on the SR response.
Signal to noise ratio under different feature parameters.

Figure 10 shows the corresponding SR waveforms and spectrograms for different parameter Situations, where (a) represents the time-frequency plot of the SR response for parameter Situation 1, with a peak amplitude of 0.225 V; (b) represents the waveform and spectrogram of the SR response for parameter Situation 2, with a peak amplitude of 0.208 V; and (c) represents the time-frequency plot of the SR response for parameter Situation 3, with a peak amplitude of 0.305 V. The results are shown in Figure 10. SR waveforms and spectrograms corresponding to different parametric Situations (a) Time-frequency plot of SR response for parametric Situation 1 (b) Time-frequency plot of SR response for parametric Situation 2 (c) Time-frequency plot of SR response for parametric Situation 3.
The results show that the network accuracy is poor when the time-domain parameter (Situation 1) and the frequency-domain feature (Situation 2) are used as inputs to the G-Net, respectively. Compared with the frequency domain feature parameters, the time domain features can improve the network accuracy. The time-domain parameters can well describe the local features of the original vibration signal and better represent the original signal. However, the frequency domain parameters reflect the statistics of the original signal on a longer time scale, so it is difficult to distinguish the local features of the signal. The best prediction results can be obtained by the network after considering both time and frequency domain characteristics (Situation 3).
The results show that only the time or frequency domain features cannot accurately describe the signal with noise, and the optimal SR can only fully extract the noisy signal features to input to the G-Net in order to better extract the fault features and achieve the best fault diagnosis results.
Comparison of the accuracy of SR-IGAN network models
The proposed method will be analyzed and validated by the collision data signal of the needle selector tip with noise in Figure 9(b). In order to prove the effectiveness of the proposed SR-IGAN method compared to other methods in extracting fault features, the SR-BP neural network is used as a comparison to test the effect of different sample sizes on the network accuracy. As shown in Figure 11. The network accuracy is evaluated based on the same validation set, and the accuracy rate is used as a criterion to evaluate the effectiveness of the two methods during the validation process. Fault diagnosis accuracy of two methods with different sample sizes.
The network accuracies of SR-IGAN and SR-BP gradually increase with the increase of sample size, and the accuracy of IGAN-based network is significantly higher than that of BP-based network from the overall point of view. IGAN can expand the samples with smaller sample size. IGAN can expand the samples with smaller sample size, although given few real samples, G-Net can generate data close to the real samples, which makes the network training more accurate. However, the smaller the sample size for BP’s network, the lower the prediction accuracy. This shows that IGAN has a clear advantage in obtaining optimal SR parameters with fewer samples. Figure 12 shows the time-domain plot and spectrogram of the optimal SR response based on predicted SR parameters by IGAN and BP networks under 1000 training samples. Figure 12(a) shows the signal plot of the optimal SR response of SR-BP, (b) shows the spectrogram of this signal with a vibration amplitude of 0.301 V; (c) shows the signal plot of the optimal SR response achieved by SR-IGAN, and (d) shows the spectrogram of this signal with a vibration amplitude of 0.325 V. The results show that the SR-IGAN method is more likely to achieve a higher accuracy than the other algorithms with less data, and can take full advantage of the fewer samples. Accuracy and can fully utilize the noise of fewer samples to extract fault features. Therefore, our proposed SR-IGAN method is more suitable for the fault diagnosis of needle selector tips than the SR-BP method. Optimal SR response for IGAN and BP implementations (a) Time-frequency plot under optimal SR response for BP implementation (b) Time-frequency plot under optimal SR response for IGAN implementation.
Stability of IGAN compared to other network models
In the actual fault diagnosis work, the stability of the model is crucial, if the model has the problem of unstable collapse, it will have a great impact on the whole needle selector fault diagnosis, therefore, in order to further validate the stability and superiority of the proposed model, a section of a typical dataset is used to validate the superiority of the IGAN model compared to other known GAN variants. From the introductory section, it is clear that generator modal collapse is the main factor for the training instability phenomenon of the GAN network during the training process. Modal collapse refers to the generator not being able to capture all the features or types in the dataset when generating the samples, which leads to a lack of diversity and richness in the generated samples, thus affecting the accuracy of the overall fault diagnosis. If the generator has a modal collapse problem, the number of modalities in the generated samples will be significantly reduced, that is, the generated samples will be relatively homogeneous or lack diversity. The final results generated will become less accurate because there is no guarantee of the diversity of the data generated, which will result in unreliable results for the entire experiment. Therefore, in practical evaluation, by observing the number of recovered modalities in the generated samples, it is possible to determine whether the GAN has a modal collapse potential.
The number of restored modes for different models under the same conditions.

The results show that under the same training samples, the performance of SR-DCGAN is more unstable, and the number of recovered modalities reaches only 212, while SR-WGAN and SR-InfoGAN are more stable, and the number of recovered modalities reaches 324 and 304, respectively. The proposed SR-IGAN method performs the best, and the number of recovered modalities reaches a high level of 378 under the condition of 400 training samples. The proposed method is therefore superior to the above methods. In this experiment, these results clearly demonstrate that IGAN effectively mitigates the modal collapse problem of the model. In order to make the experimental results more intuitive and obvious, a histogram comparing the recovered modal counts of different GANs under the same condition samples is produced, and the results are shown in Figure 13. Therefore, compared with other network models, the SR-IGAN model has better stability and is more suitable for use in fault diagnosis in real factory production. Modal recovery number for different network models.
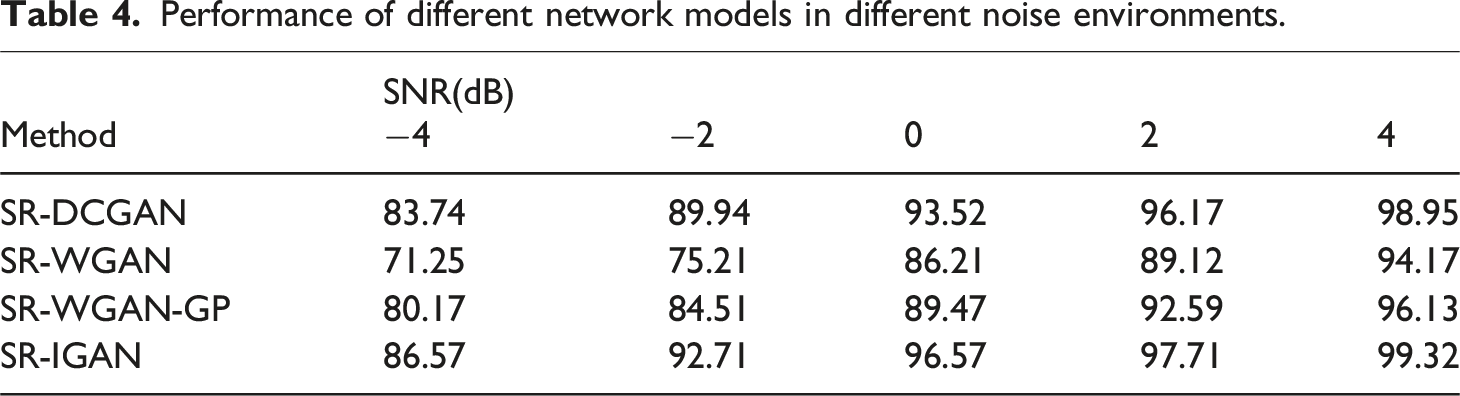
Environmental noise is an important factor that affects the stability of network models, and in order to investigate the stability of SR-IGAN networks in environments with different signal-to-noise ratios, a set of experiments was designed in this study. The SR-IGAN model was trained in environments with different degrees of signal-to-noise ratios and evaluated for the quality of the generated samples as well as the model stability. The signal-to-noise ratio is set to - 4 dB, - 2 dB, 0 dB, 2 dB and 4 dB, and the performance of the proposed model is compared under these five signal-to-noise ratio environments.
Performance of different network models in different noise environments.

Performance of different network models in different noise environments.
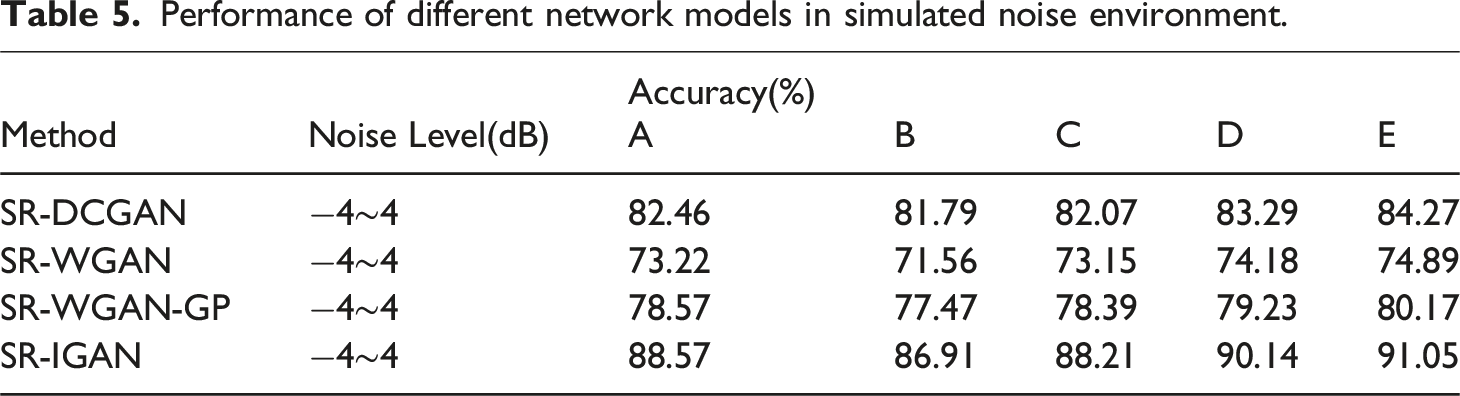
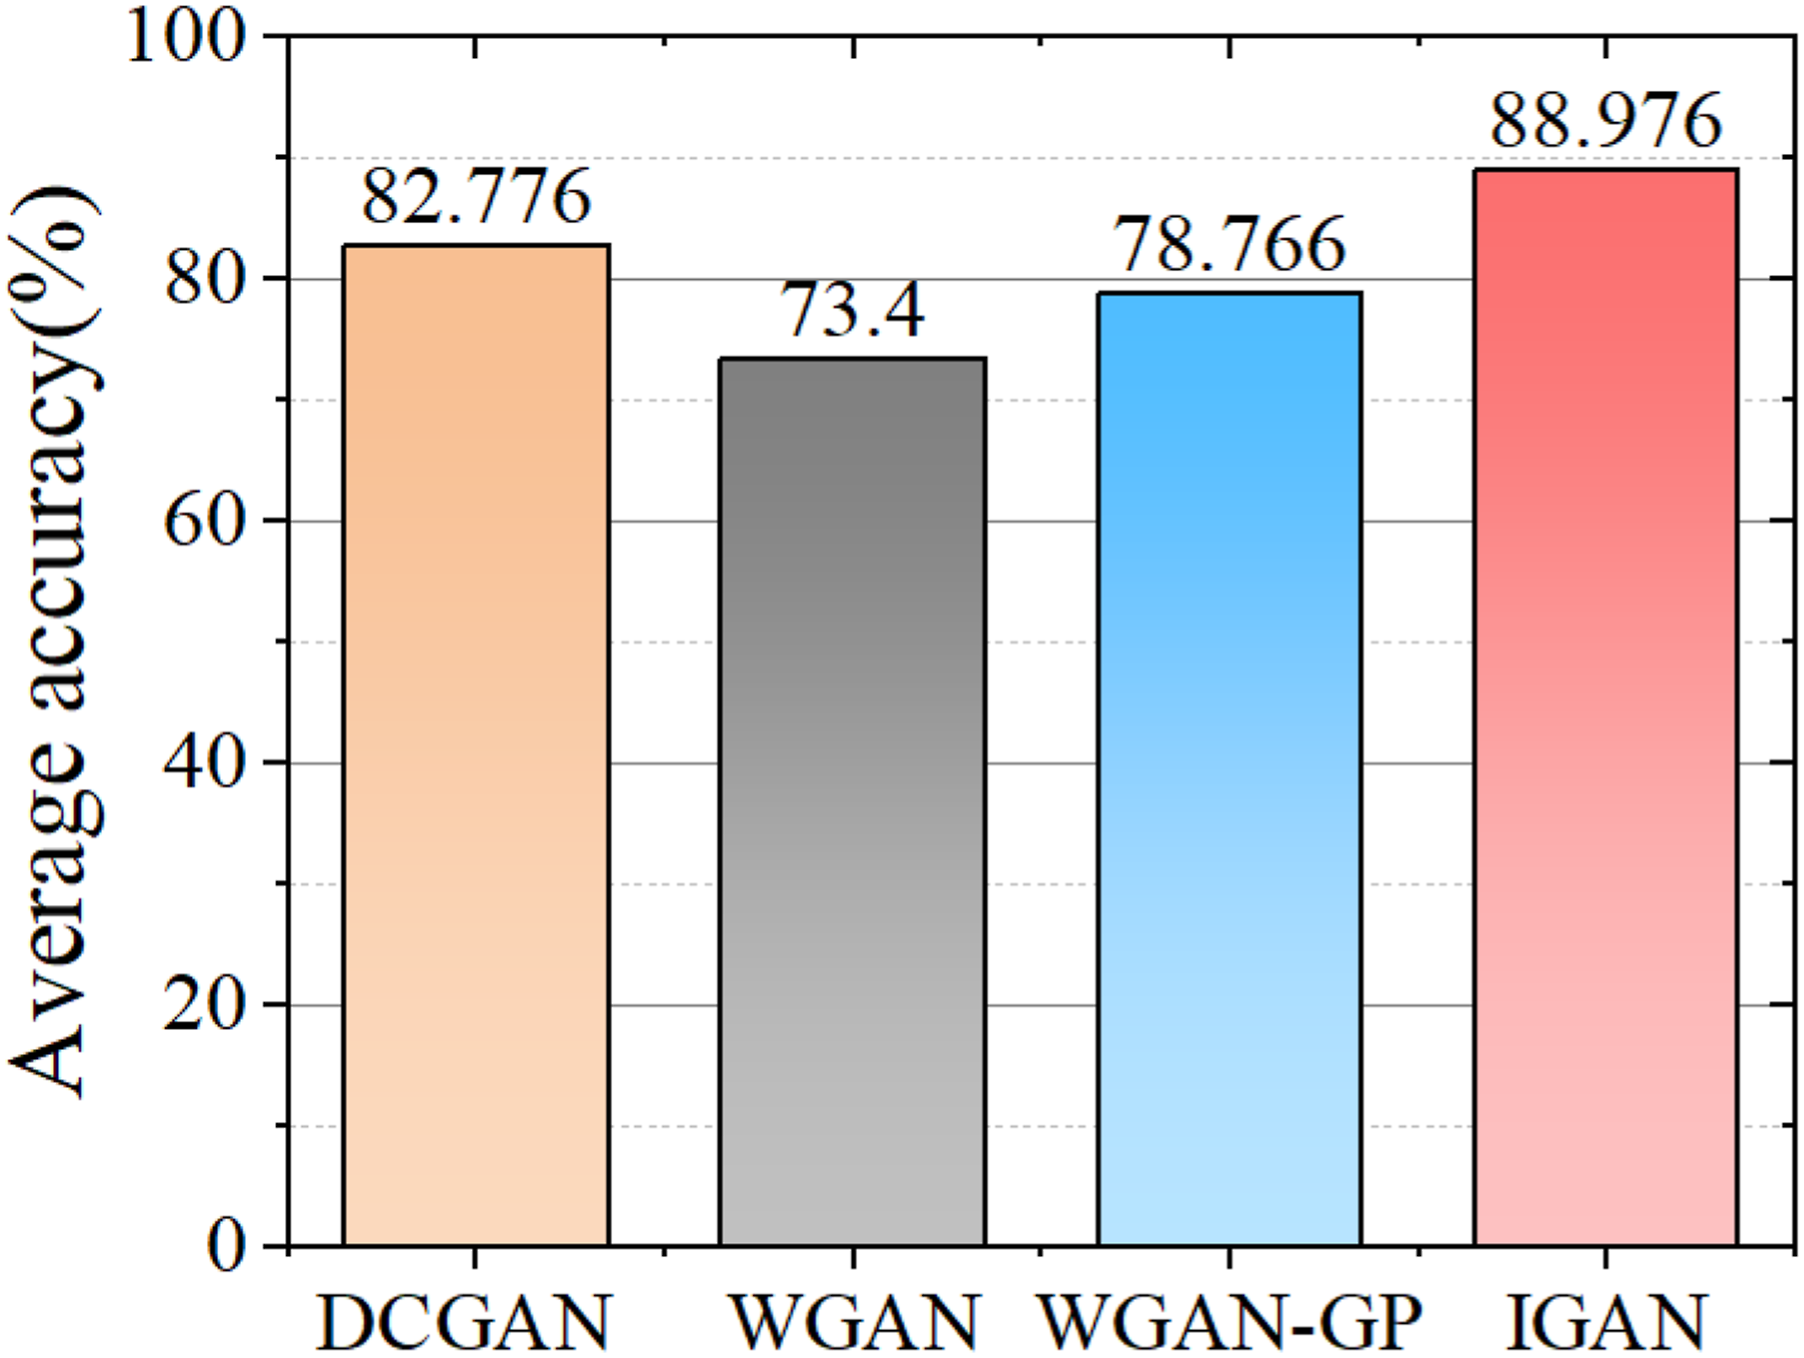
Since the SNR values in the working environment of the workshop are not fixed in the actual factory tests, in order to more realistically test the stability and accuracy of the proposed model in the actual factory production environment, we selected the SNR band of −4 dB ∼ 4 dB as the base frequency, and simulated a SNR environment with changing values through the random noise generated by equation (9) to train the model.

Performance of different network models in simulated noise environment.
Comparison of the accuracy of different network models in different signal-to-noise ratio environments.
Conclusion
In order to improve the accuracy of needle selector drive part fault diagnosis, an adaptive stochastic resonance method based on improved generative adversarial network is proposed in this paper. The method applies SR technique to extract weak periodic fault features from strong noise, and solves the problem that the optimal SR parameters are difficult to obtain by generative adversarial network, at the same time, in order to solve the problem of unstable operation caused by the collapse of the generator of the GAN during operation, an adaptive SR model based on IGAN is proposed. The stability and superiority of the method are verified through simulation experiments and field data analysis. The main conclusions are as follows. (1) The experimental results comparing the effects of different numbers of parameters on the model show that the network model works best when the number of time-domain and frequency-domain parameters are considered at the same time, and the SNR of SR output reaches 7.79 dB. (2) Under the conditions of different numbers of real samples, the proposed adaptive SR-IGAN method has higher accuracy than the traditional algorithm, and the accuracy rate reaches the highest 95.3% when the real samples are 1000. And compared with other models combining GAN and SR, the SR-IGAN model is more stable, and the number of recovered modalities reaches 378 under the condition of 400 training samples. Overall presents the superiority of the SR-IGAN method. (3) In the environment of different signal-to-noise ratio strengths as well as the fluctuating signal-to-noise ratio environment that simulates the actual working environment of a factory, our model shows strong stability and accuracy when compared with other models. Under the fixed SNR environment, the model achieves an accuracy of 99.32% with a high SNR (SNR = 4 dB) and maintains a high accuracy of 86.57% with a low SNR (SNR = −4 dB); under the fluctuating SNR environment, our model achieves the highest average accuracy of 88.91%.
In conclusion, compared with previous methods, IGAN is faster, more accurate, and more stable, so it can make the fault diagnosis work more efficiently and more stably in the actual textile engineering environment, and can be adapted to different environments. However, our method is only in the laboratory stage, and we have not yet made the actual software that can be applied to the production, in the future work, we will continue to delve into this work, which still needs a lot of experiments and work, including the network to adapt to the operating environment and other aspects still need to be improved.
Footnotes
Acknowledgments
The authors would like to thank the Director, Longgang Research Institute, Zhejiang University of Technology for permission to publish this research work. The authors would also like to thank Yubao Qi, Laihu Peng for their technical support in the research work.
Declaration of conflicting interests
The author(s) declared no potential conflicts of interest with respect to the research, authorship, and/or publication of this article.
Funding
The author(s) disclosed receipt of the following financial support for the research, authorship, and/or publication of this article: Special Support Program for High-level Talents in Zhejiang Province, (2023R5212). Zhejiang Province “Sharp Soldier Leader + X” R & D Public Relations Program (2024SJCZX0027).