
Abstract
The aesthetics and functionality of honeycomb woven assemblies qualifies them for a range of applications expanding across home textiles, fashion, functional apparels, and technical products. Researchers have explored honeycomb assemblies with the focus on shrinkage, sound absorption, thermal conductivity, and heat protection properties analysis via variation in their cell sizes. However, very minimal research is found on analysis of honeycomb woven fabric assemblies’ thermal comfort characteristics by employing different weft insertion sequence and materials (cotton and stretchable yarns). This study reflects the thermal conductivity, dry fluid transmission (air permeability), wet fluid transmission (moisture management), and stiffness attributes of twelve stretchable honeycomb woven assemblies consisting of single ridge, double ridge, and brighton honeycomb weave structures along with different weft sequences of cotton and Type 400 (T-400) stretch yarns. Characterization data showed that single ridge honeycomb structure supports the highest dry fluid transmission property; however, brighton honeycomb offers the highest heat retention property. Double ridge honeycomb highlights the capability of the highest wet fluid transmission property, and brighton honeycomb has immense stiffness. Statistical analysis (ANOVA) also showed that honeycomb structures, weft yarn sequence and material have a statistically significant impact on thermal conductivity and fluid transmission behaviors with p-values less than 0.05.
Keywords
Introduction
The comfort of a fabric assembly is explained as the compatibility of respective fabric with the human body providing pleasant thermo-physiological, psychological, and sensorial comfort.1,2 It is crucial for a fabric assembly to manage moisture transfer from the human body to the surrounding environment.3,4 Thermal attributes of a fabric include dry fluid transmission property which allows the air to pass on from the fabric, wet fluid transmission property describing the fabric’s ability to transfer the moisture and thermal resistance exhibiting the ability of a fabric to trap the heat within its fibers, yarns, or layers.5–7 The aforementioned properties, and hence fabric comfort and durability, are influenced by the fabric structural parameters (warp and weft yarn type, size and fiber content, warp and weft thread density, weave structure, and warp and weft crimp due to weave interlacing). The impact of fabric structural parameters on woven fabric comfort attributes has been extensively researched. 8 The following section is devoted to providing a critical review of the previous work and identifying the research gaps in the area of honeycomb woven structures that directed undertaking this research.
Investigated findings report that honeycomb structures were lighter, more comfortable and have a significant impact on thermal protection performance. 9 Salama et al., explored honeycomb weave designs regarding their thermal characteristics, and impact of different cell sizes on their sound and moisture absorption properties to reveal how honeycomb weave structure influences different performance parameters. Honeycomb woven samples of different areal densities were developed and their thermal insulation, water vapor permeability, air permeability and abrasion resistances were analyzed. These were compared with bed covers which were made from reversible weft backed structures. Honeycomb woven samples contained higher thermal insulation than reversible weft backed structure. Water vapor permeability was found to be equal. It was found that thermal conductivity of the developed structures could be improved by using bulky filaments yarns as weft. 10 Linen honeycomb woven samples have been made to analyze fabric’s shrinkage percentage after laundering in pure water. Results showed that as warp and weft density or linear density of yarns increases the shrinkage percentage of linen honeycomb woven samples also increases in both warp and weft direction. It was also noticed that shape and structure of the fabric’s cross section also affected the shrinkage properties. 11 Honeycomb woven samples of different weave repeat, and warp density could work for sound absorption properties by using hollow polyester yarn as warp and weft. Small weave repeat, smaller cell area and higher bulk density results in higher sound absorption properties. Moreover, sound absorption properties can be increased by having higher warp density. 12 Yang et al., developed square and hexagonal honeycomb-based structures to analyze their thermal conductivity. Results showed that inclination angle affected heat transfer rate, square honeycomb structure showed higher heat transfer rate as compared to hexagonal structure. 13 Honeycomb based structure was developed using linear cellular alloy for heat sink applications. Heat transfer rate was analyzed and compared with stochastic cellular metal honeycomb-based structure. Laminar flow was observed and heat losses at entrance and exit were well characterized. It was also showed that innovated structure provided heat loss at half of the pressure drop than from the compared structure. 14 Skin effect of honeycomb structure was analyzed, and an explicit analytical model was utilized based on equilibrium equations and results showed that the skin effect holds an impact on stiffness distribution, mostly at the edges of the respective structure. 15 Xiao et al., worked on analysis of air resistance, thermal conductivity, water absorption, vapor transmission rate of honeycomb woven fabrics. For comparison there was two-dimensional plain-woven fabric. Honeycomb woven fabric showed higher air permeability, water absorption and low thermal conductivity as compared to plain woven fabric. 16 Chen et al., developed 12 honeycomb woven samples using polyethylene terephthalate/fully drawn yarn, polyethylene terephthalate/drawn texturing yarn and carbon fiber. Weft densities of samples were 60/80/100, and air permeability, thermal resistance, water absorption, vapor transfer rate was studied. Results showed that comfort properties were highly affected due to weft densities and elastic yarn whereas carbon fibers that were used showed immense increase in modulus. 17 Tang et al., developed elastic honeycomb woven structure and compared with non-elastic woven structure. The elastic honeycomb woven structure was manufactured by using cotton yarn as warp and elastane cotton yarn as weft using air-jet loom. Results showed that elastic honeycomb structure contained higher energy absorption rate, as compared to non-elastic honeycomb structure. 18 DM Baitab et al., developed six honeycomb woven structures using single ridge, double ridge and brighton honeycomb weave designs having two different picking sequences (single and double pick). Thermal resistance, wet fluid management capabilities and air permeability were determined. Results showed that single ridge double pick samples with minimal interlacements and big cell size showed highest air permeability and thermal resistance respectively. Double ridge structures with higher interlacements showed higher overall moisture management capability whereas Brighton honeycomb showed less overall moisture management than double ridge. 19
Honeycomb structure’s previous studies have highlighted their significance for sound absorption, thermal resistance, and shrinkage properties. To the best of authors’ knowledge, no significant research was found related to the analysis of comfort characteristics of honeycomb woven structures using different weft yarn material (cotton and stretch yarn) and sequence. Moreover, research in the area of elastic/stretchable woven honeycomb structures also finds a huge gap. To address this research area, twelve 12 honeycomb fabrics were formed considering two variables; namely honeycomb weave structure (single ridge, double ridge, and Brighton) and weft yarn sequence (four levels). The influence of the two variables on their fabrics’ comfort attributes were performed, and respective results were analyzed. One-Way ANOVA statistical analysis was also performed to check the statistical significance of the results.
Materials and methods
Materials
Cotton yarn having a linear density of 29.5 Tex was used for the study. The single yarn breaking load of sized yarn and unsized yarn was 334 cN and 280 cN respectively. In addition to cotton yarn as weft, T-400 yarn was also used in weft direction. The T-400 yarn is an inherently elastomeric yarn having superior stretch and recovery attributes. Moreover, T-400 is known for its softness, wicking ability, durability, wrinkle resistance, thermal regulation, and elasticity without spandex. It is a bicomponent of side-by-side type (PET [Polyethylene terephthalate] and PTT [Polytrimrthylene Terephthalate]). Both yarns were purchased from a commercial supplier, and the yarn attributes were validated through in house testing. Cotton yarn was prepared by a local textile industry in Pakistan; however, the T-400 yarn was produced by a Chinese company. Before sampling and characterization yarns were stored under standard temperature 20±5oCand relative humidity of 60 ± 5%. The T-400 was employed as an alternative to spandex as the spandex/lycra is not easy to weave. T-400 does not consist of conventional polyurethane chains which although provide stretch but work negatively for comfort attributes and also make weaving difficult. The stretch in T-400 develops because of filament coils development as the two components (PET/PTT) shrink differently upon heat treatment. Cross-sectional views and other phases of T-400 yarn are shown in Figure 1.20–22 The linear density of T-400 yarn was 37 Tex, while its breaking load was 5N and the elongation at break was 25.41%. T-400 fiber/yarn cross sections.
Development of honeycomb assemblies
Weave notations and 3D views of honeycomb structures.

Design of experiment.

The sampling pathway has been highlighted in Figure 2, starting from the single end sizing of the dyed cotton yarn towards weaving. Woven fabrics comprises of two distinctly oriented yarns termed as warp and weft yarns. Warp yarns are running in the longitudinal direction, and they suffer from severe stresses during weaving on loom, hence sufficient strength is needed for warp yarns. For this, the sizing was done for warp yarn on the Single end sizing machine. For sizing the warp yarns, 7% PVA (Polyvinyl alcohol) as a sizing agent was used. After sizing, single end warping was done to a parallel sheet of warp yarns to form the warp beam with the required number of yarns. Finally, woven honeycombs were fabricated on a sample weaving machine with the warp density of 68 ends per inch and weft density of 68 picks per inch, for all samples given in Table 2. Sampling pathway.
After the fabrication of the woven samples, desizing process was carried out by the hot water in Jigger machine. The samples took 48 h to get dry properly. De-sized samples are shown in Figure 3. Microscopic views of developed woven honeycomb samples.
Physical parameters of fabricated specimens.

Characterizations
Summary of testing methods.

Results and discussion
Dry fluid transmission
Dry fluid transmission, also known as air permeability (AP) is one of the most considerable tests when it comes to fabric comfort testing.
24
There are several factors on which air permeability depends, for example warp and weft densities of a fabric. The weave structure is another factor on which air permeability depends and it is the second most major factor after areal density of the fabric.
25
The yarn count with the type of raw material used is also another factor due to which air permeability gets affected. Figure 4 below shows air permeability of the woven samples which contains single ridge [SR-C, SR-T, SR-CT (4:4), SR-CT (8:8)], double ridge [DR-C, DR-T, DR-CT (4:4), DR-CT (8:8)] and Brighton honeycomb [BH-C, BH-T, BH-CT (4:4), BH-CT (8:8)] weave designs. However, the error bars display standard deviation from the mean (similar is for all graphs of results). Air permeability of woven assemblies.
As far as single ridge honeycomb category is considered, SR-C showed highest air permeability of them all as it contains lowest warp and weft densities hence making the fabric less dense than rest of them and letting the air to pass through itself easily and giving the peak highest. Then SR-CT (8:8) showed higher air permeability peak as it contains less warp and weft densities just after the sample SR-C making weave structure of the fabric a little open giving space to air to pass through. After SR-CT (8:8) it was SR-CT (4:4) and at last SR-T had its peak lowest of them all as it contained the highest areal density making fabric highly dense and interlaced of them all hence not allowing the air to pass through itself easily thus giving its peak smallest. 26 In double ridge honeycomb category, DR-C showed highest air permeability because of loosely packed structure as its areal density is lowest, after that DR-CT (8:8) showed higher air permeability as it contained a little bit smaller cover factor after the sample DR-C. Then DR-CT (4:4) showed next higher air permeability and at last DR-T showed least air permeability as it contained the highest areal density as compared to rest of the samples hence barely allowing air to pass through thus giving its peak at lowest. Sample BH-C showed highest air permeability due to open weave structure and least cover factor. BH-CT (8:8) gave second highest air permeability, BH-CT (4:4) gave third highest while BH-T gave lowest air permeability due to highly tight weave structure just because of highest areal density thus making sample tightly packed with minimum spaces for air to pass through. 27
Thermal conductivity
Thermal conductivity is a crucial fabric thermal comfort property test which is frequently conducted to analyze the heat insulation and transportation properties of woven assemblies. 28 There are three major categories in this test one is bending whose units are (gf. mm/rad), the second one is compression, and its units are (gf/mm3) and last one is thermal conductivity with units (W/m.K). Thermal conductivity is known as the transfer of heat through the fabric. Bending rigidity is known as how much a fabric gets mold when a certain force is applied to it hence thicker fabric less bending rigidity. Compression is known as how much a fabric gets condensed when load is applied onto it so higher areal density fabric gets less compress and vice versa.
Thermal conductivity (Figure 5) displayed that in the vicinity of single ridge honeycomb group, SR-C showed higher thermal conductivity as it is less compact and contained less interlacement points. SR-CT (8:8) was next which showed higher thermal conductivity as it contained relatively less areal density than SR-C making sample’s structure quite open.
29
After that SR-CT (4:4) showed higher thermal conductivity while SR-T showed least thermal conductivity as it is highly dense and tightly packed structure among them all. Sample DR-C and BH-C revealed high thermal conductivity due to less areal density and loose structure while sample DR-T and BH-T gave least value of thermal conductivity as the samples contained fewer empty spaces due to compact weave structure. It can also be observed that thicker fabrics showed low thermal conductivity as compared to thin fabrics.
30
Thermal conductivity of woven assemblies.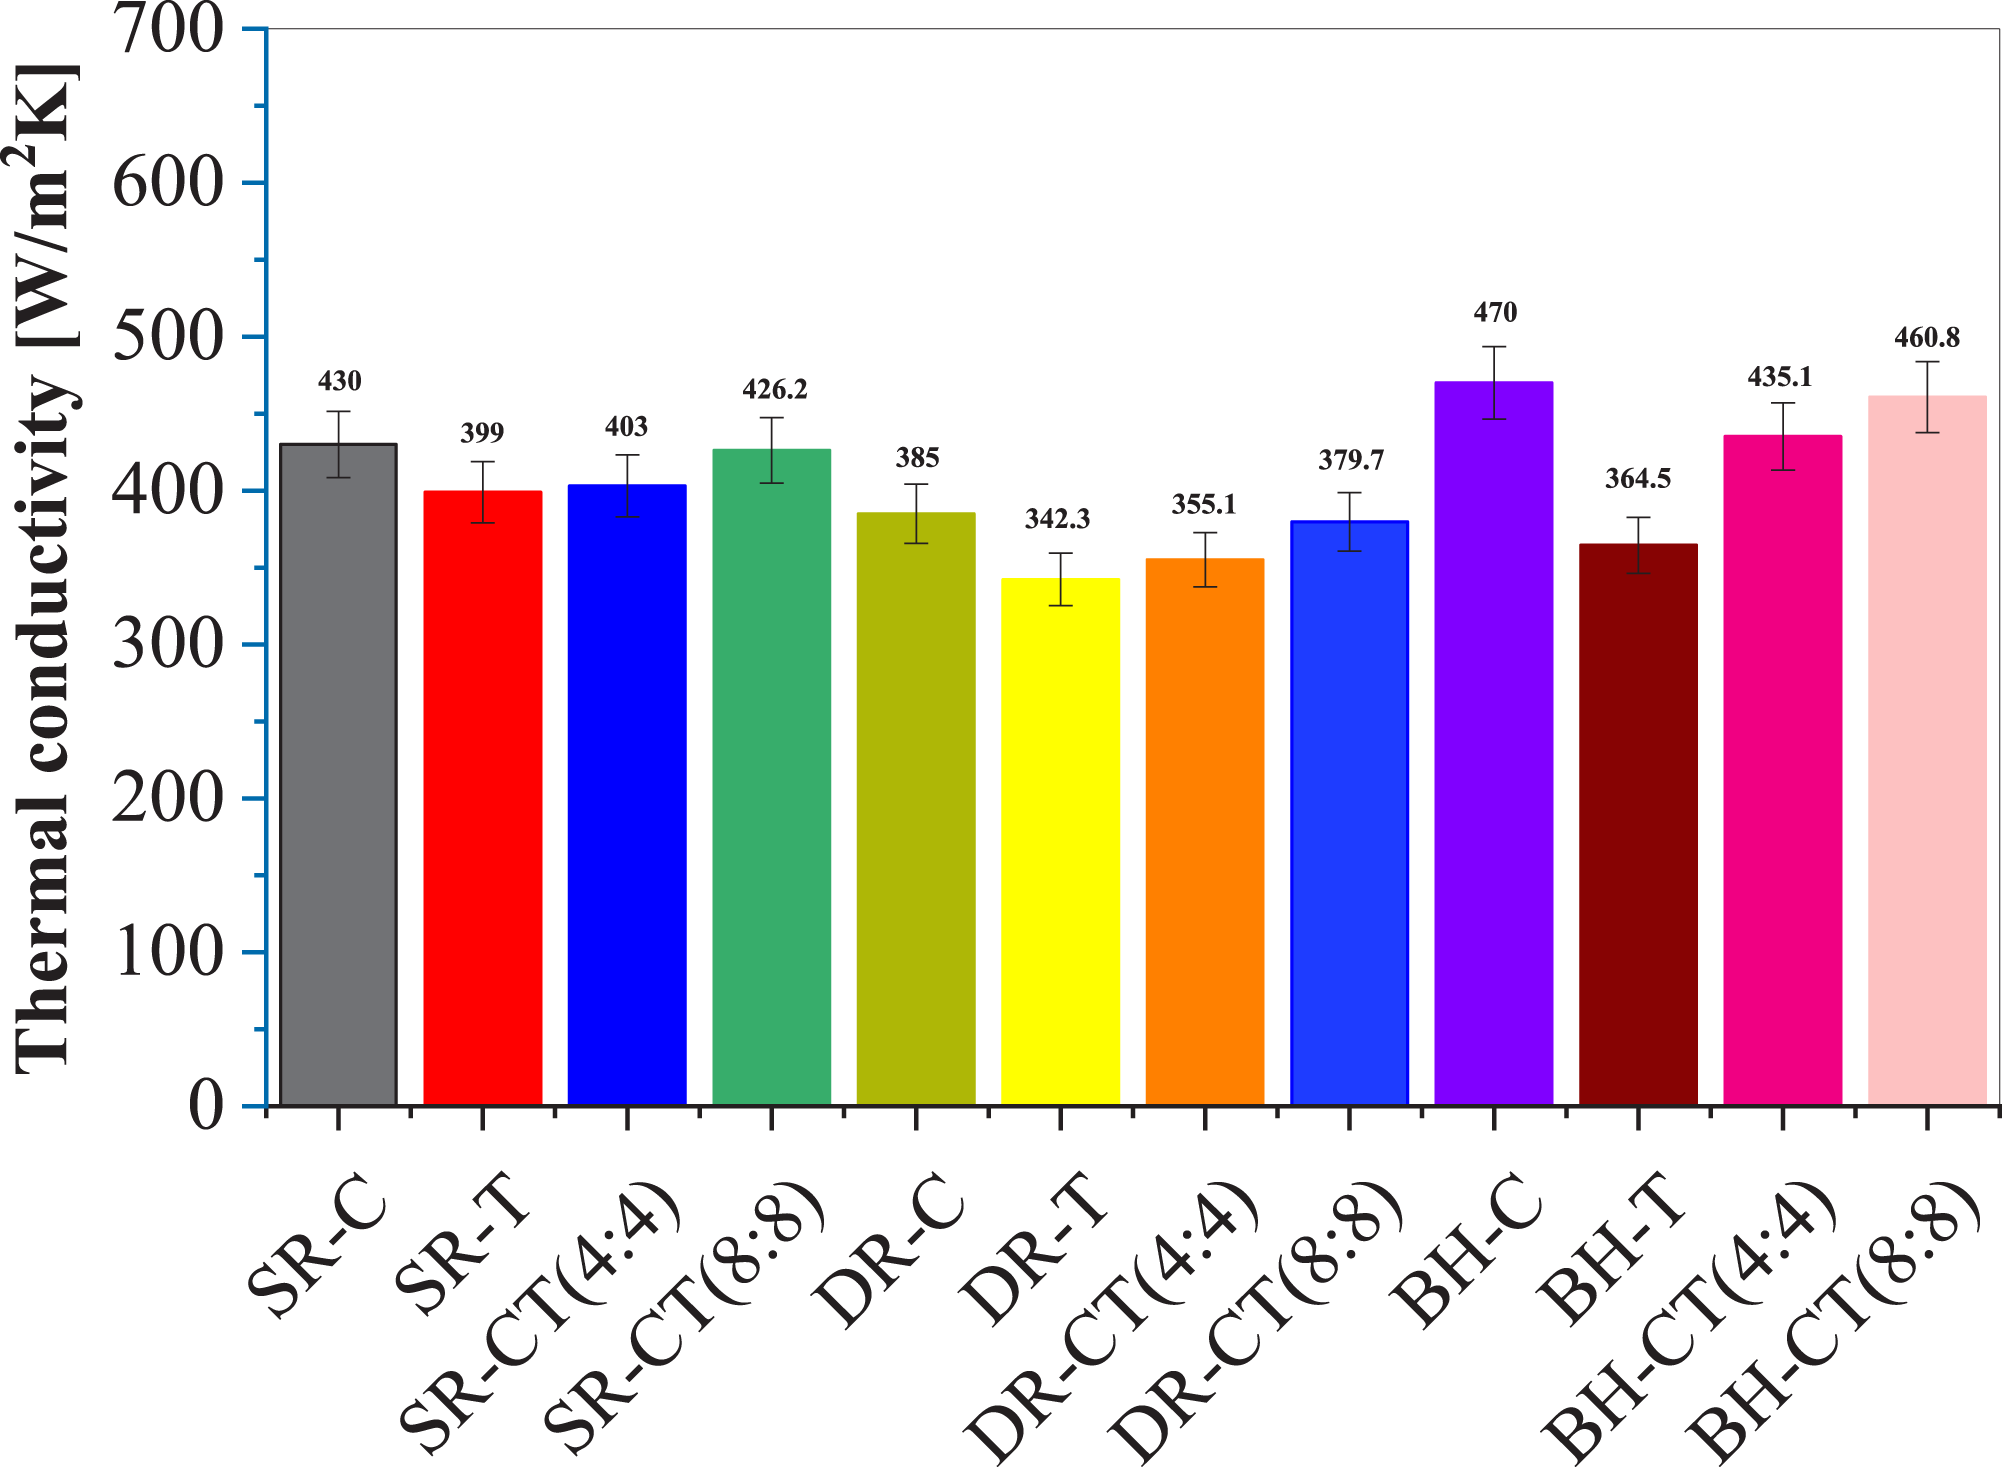
Compression results (Figure 6) revealed that samples containing cotton like SR-C, DR-C, BH-C exhibited highest values of compression due to least compact structures although BH-C sample gave highest value of them all due to longer float length of the structure making less interlacements in the weave structure. Samples containing 100% T-400 like SR-T, DR-T, BH-T gave lowest value of compression as areal density was much high making fabric tighter and compact while sample BH-T gave highest value due to longer float length in its weave structure which is not in case of single and double ridge honeycomb weave structure.
31
Compression of woven assemblies.
Bending results (Figure 7) showed that SR-C revealed highest bending peak as it contained least areal density making fabric least compact and least dense hence gave higher bending peak, whereas SR-T showed least bending behavior as it was having highest areal density making fabric weave structure immensely tight and compact thus not showing easy bending behavior as compared to others. Likewise single ridge samples, double ridge samples category also showed same behavior, here sample DR-C revealed highest bending value due to immense loose structure just because of least areal density while sample DR-T showed lowest bending due to most compact fabric structure as its warp and weft densities were highest of them all making fabric sample stiff. Brighton honeycomb group also showed that sample BH-C was highest in bending while sample BH-T was lowest due to loose and compact behavior respectively.
32
Bending of woven assemblies.
Overall wet fluid transmission capability
Wet fluid transmission, also known as overall moisture management capability (OMMC) is a comprehensive evaluation method aimed for assessing the fabric ability to manage moisture effectively. 33 This testing process involves multiple parameters and tests to determine how well the fabric can absorb, transport, and evaporate moisture. OMMC testing helps manufacturers and researchers understand the moisture management capabilities of woven fabrics, guiding the development of materials suitable for various applications. Three categories come under OMMC which are absorption rate, spreading speed and wetting time.
In Figure 8 wetting time top and bottom results displayed that SR-C showed the highest peak from all of them as it contained the least warp and weft densities hence taking longer time to get wet. SR-CT (8:8) was the next one which showed its peak highest as it contained less areal density than SR-C. At number third SR-CT (4:4) showed its bar highest and lastly SR-T showed its peak at lowest because amongst them it contained highest warp and weft densities into the sample bringing yarns closer making weave structure compact hence taking less time to get wet properly.
34
Wetting time of woven assemblies.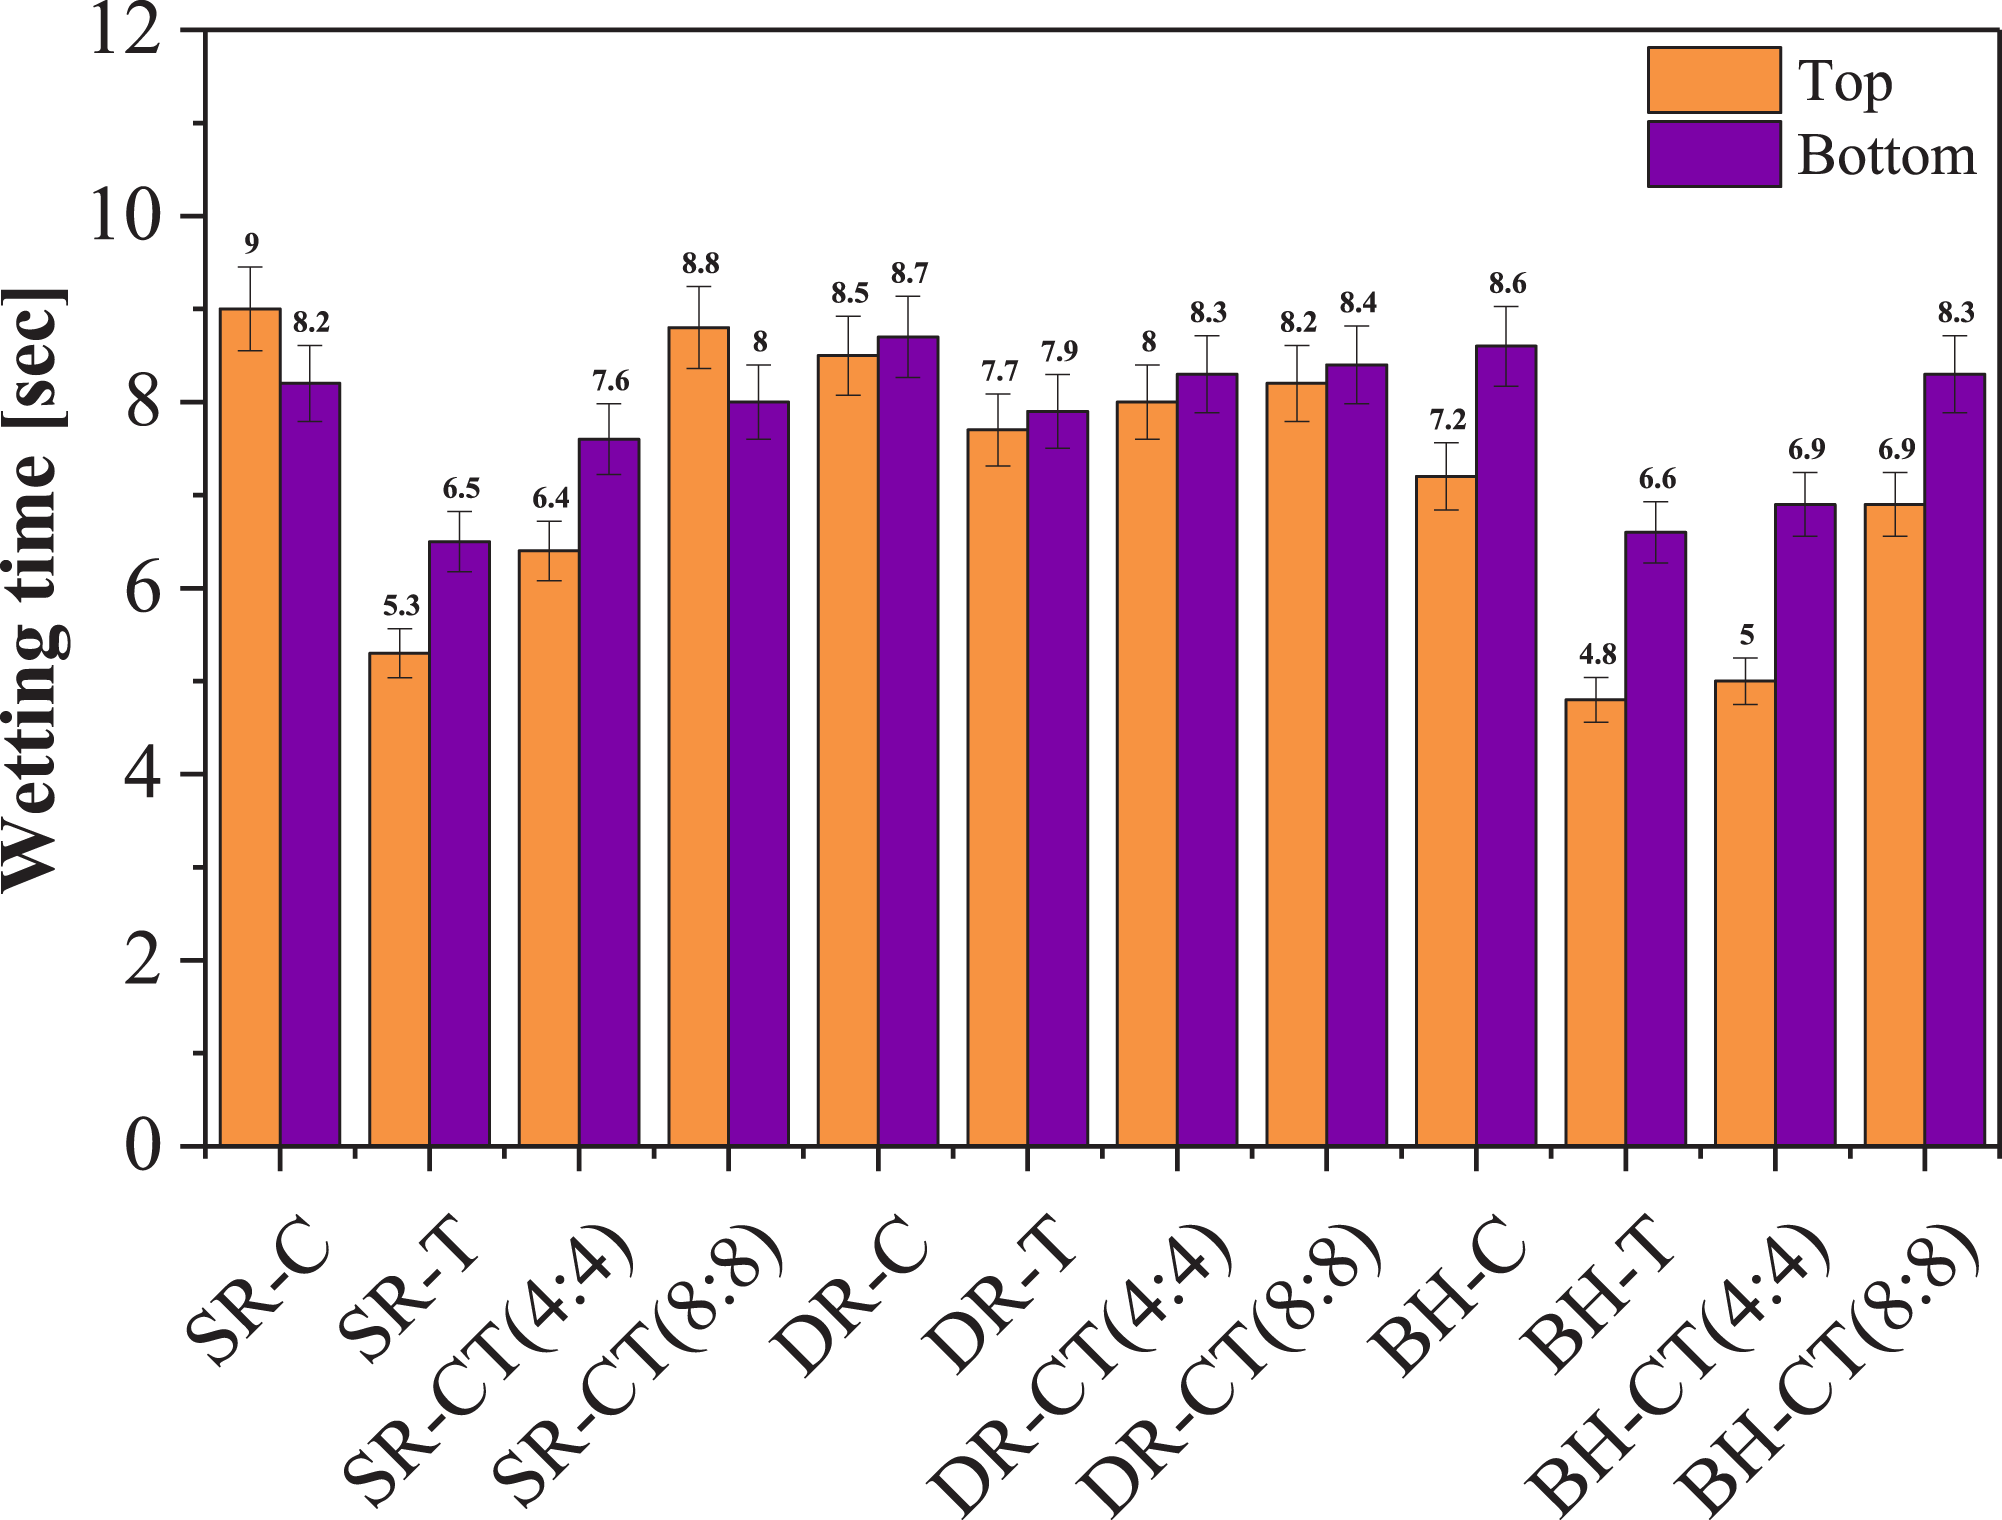
In Figure 9 of the spreading speed results, SR-T showed the highest spreading speed due to the highest warp and weft densities making structure compact, thus allowing moisture to spread efficiently. Then there was SR-CT (4:4) SR-CT (8:8) close to each other as they both contained nearly equal areal densities hence taking almost equal time to spread the moisture in the fabric sample. At last, there was SR-C sample which showed least spreading speed due to least warp and weft densities into it hence less opportunity was there for SR-C to quickly spread the moisture among the fabric that is why it stood last.
35
Spreading speed of woven assemblies.
Figure 10 showed that SR-T contained the highest absorption rate as it contained the highest warp and weft densities hence more opportunity of absorbing moisture. After SR-T, SR-CT (4:4) showed higher absorption rate as it contained higher areal density next to SR-T hence making sample compact and bringing yarns closer to each other hence absorbing moisture. Then it was SR-CT (8:8) and at last SR-C was there which showed least absorption rate as it was containing least warp and weft densities within it thus less chances of moisture to get absorbed. In double ridge honeycomb case, DR-T showed highest peak for absorption rate as it contained highest areal density allowing moisture to get absorbed. After sample DR-T, DR-CT (4:4) showed the highest peak among them all as after DR-T DR-CT (4:4) was having higher warp and weft densities hence showing its peak higher next to DR-T. At number third DR-CT (8:8) showed highest bar due to having warp and weft densities higher at third position and at last DR-C was having its peak at lowest as least number of warp and weft densities were there in DR-C sample making less opportunities for moisture to get absorbed. Absorption rate of woven assemblies.
Overall moisture management capability was also carried out of all these samples apart from this wetting time, absorption rate and spreading speed. In Figure 11 OMMC index results showed that all the samples that contained cotton in them showed good overall moisture management capability as compared to those samples which only contained T-400 within themselves. As cotton contains a property of nicely absorbing moisture so where it is having blend with T-400 so at that place work of absorption was done by cotton and releasing moisture into the environment was done by T-400 synthetic material.
27
OMMC index of woven assemblies.
All the samples with the 4:4 picking sequence for examples SR-CT (4:4), DR-CT (4:4) and BH-CT (4:4) showed highest values amongst them as there is blend of both yarns so they did great work of managing the moisture within themselves after that sample SR-CT (8:8), DR-CT (8:8) and BH-CT (8:8) showed higher value of OMMC and at last sample with T-400 for example SR-T, DR-T and BH-T showed least value of them all as T-400 consist poor property of absorbing moisture within itself but it consist quiet well property of evaporating the moisture into the environment but it loses just because of poor quality of absorbing the moisture hence showing least value in the graph.
Stiffness
Stiffness testing of woven fabrics is necessary for evaluating their suitability and performance across different applications. The stiffness of a fabric directly influences its drape, handle, and overall behavior, thus playing a crucial role in determining comfort and wear ability. Fabrics that are excessively stiff may compromise wearer comfort, while those with appropriate stiffness levels offer better flexibility. Furthermore, stiffness testing serves as a key indicator of a fabric’s durability, and helps to assess its resistance to creasing, and deformation over time. Figure 12 showed that in the category of single ridge honeycomb samples SR-T showed the highest stiffness as it was having highest warp and weft densities within it hence making it difficult to get bend or mold as structure got compact and tight. SR-CT (4:4) contained the highest areal density after SR-T sample so it was having highest value of stiffness right after SR-T sample. It can also be related to that more the fabric thickness, the higher its stiffness.
15
Stiffness characteristics of woven assemblies.
At third position sample SR-CT (8:8) showed highest value and at last sample SR-C showed least stiffness value as it contained lowest warp and weft densities in the fabric and having least interlacement making it least dense sample as compared to rest of them. In the category of double ridge sample DR-T showed the highest value of stiffness as it was having highest areal density making structure highly dense thus becoming highly stiff. Then DR-CT (4:4) sample was stiff as it was having higher areal density right after the sample DR-T. At the very next position there was sample DR-CT (8:8) and at last sample DR-C showed least value of stiffness as it was having least areal density, and it was least compact and tightly packed structure thus sample DR-C got mold easily as compared to rest of the samples. 36 As far as Brighton honeycomb samples are concerned so BH-T showed highest value of stiffness, then it was BH-CT (4:4), BH-CT (8:8) and BH-C respectively as these samples were not having much areal density and not quite compact and dense relatively to the sample BH-T thus they gave smaller value.
Statistical data analysis
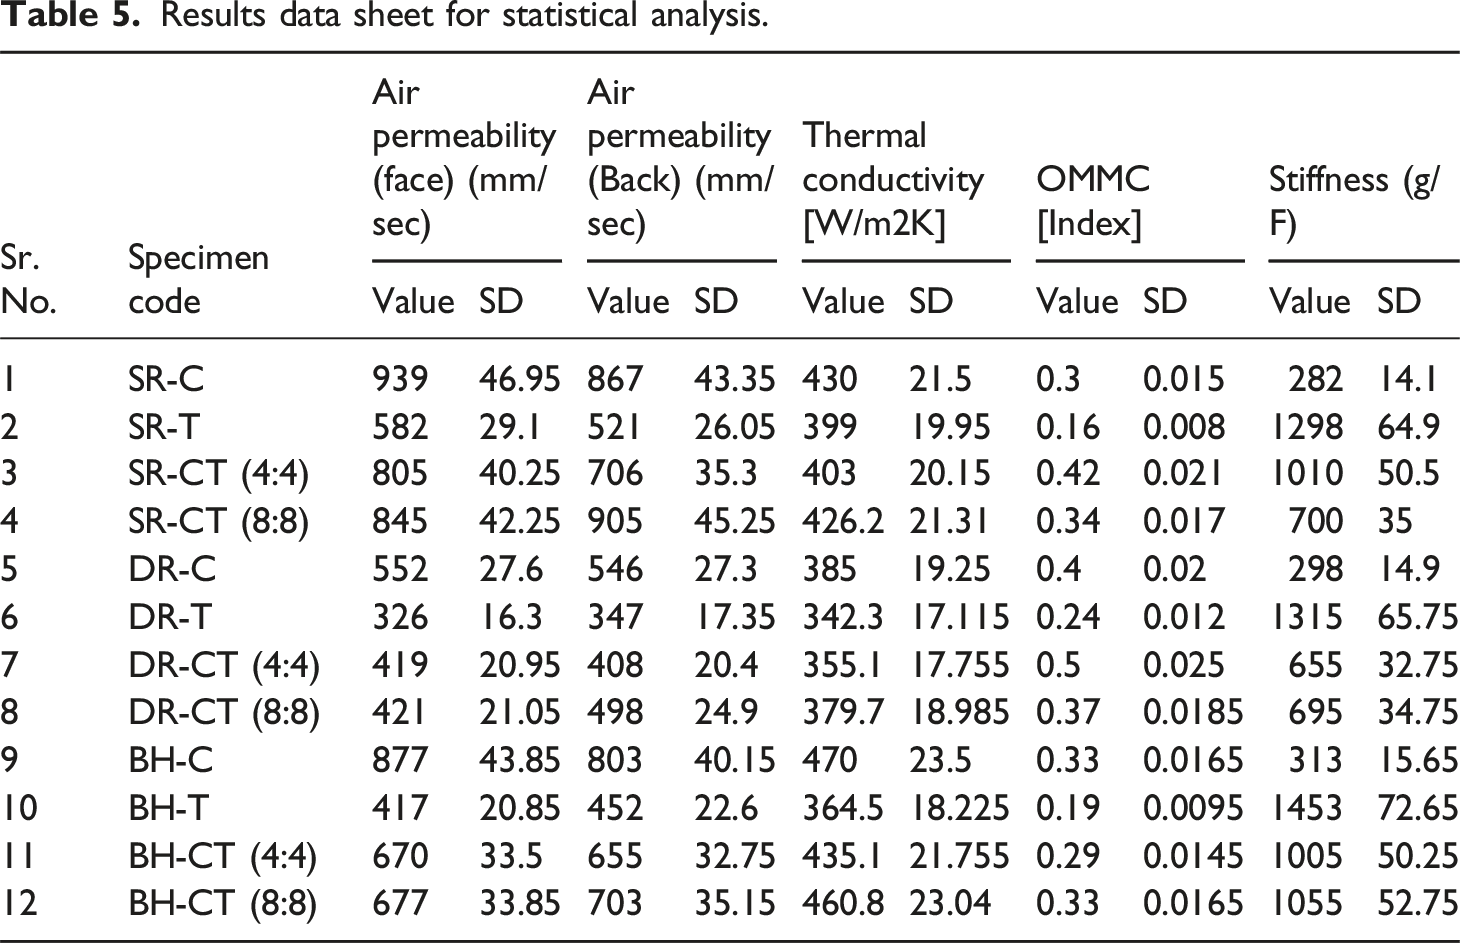
Results data sheet for statistical analysis.
Analysis of variance results.
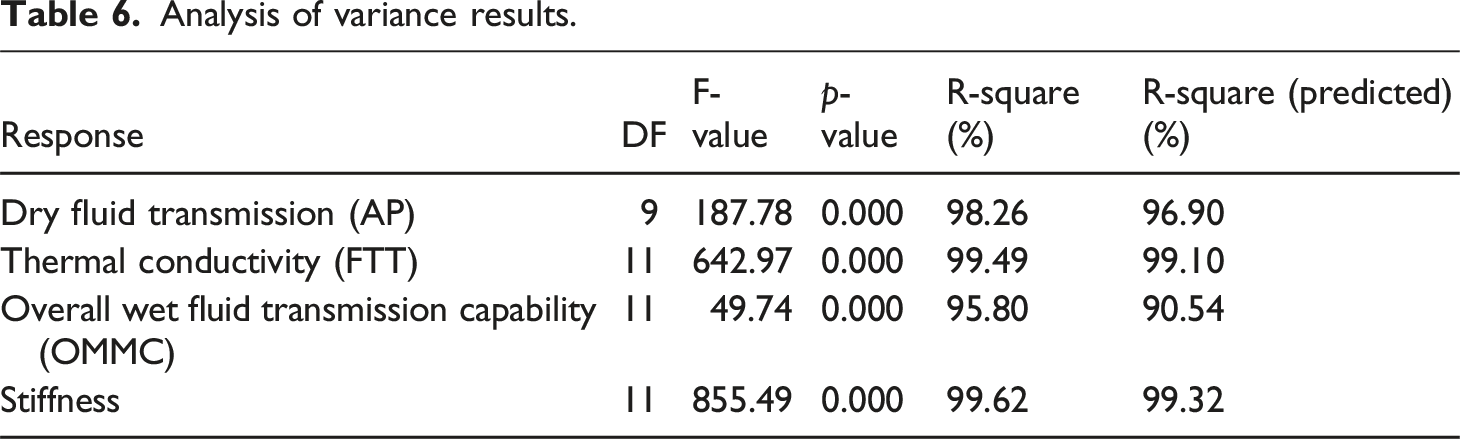
Figure 13 highlights the characterization trends in a pictorial form depicting the performance comparison of all specimens simultaneously. BH-C specimen was found to be the best performer in terms of dry fluids transmission owing to open spaces in structure, that’s why thermal conductivity was found to be lower as more porosity allowed heat to pass through. Employing elastomeric T-400 yarn shifted thermal properties of honeycomb structures towards winter applications where lower conductivity is desired to provide warmth feeling. Stiffness also exhibited an elevating trend in T-400 structures; however, such stiffness will not cause ergonomical issues owing to inherently better stretch and recovery properties of T-400 yarn. Interval plot of (a) Dry fluid transmission (b) thermal conductivity (c) overall wet fluid transmission (d) stiffness.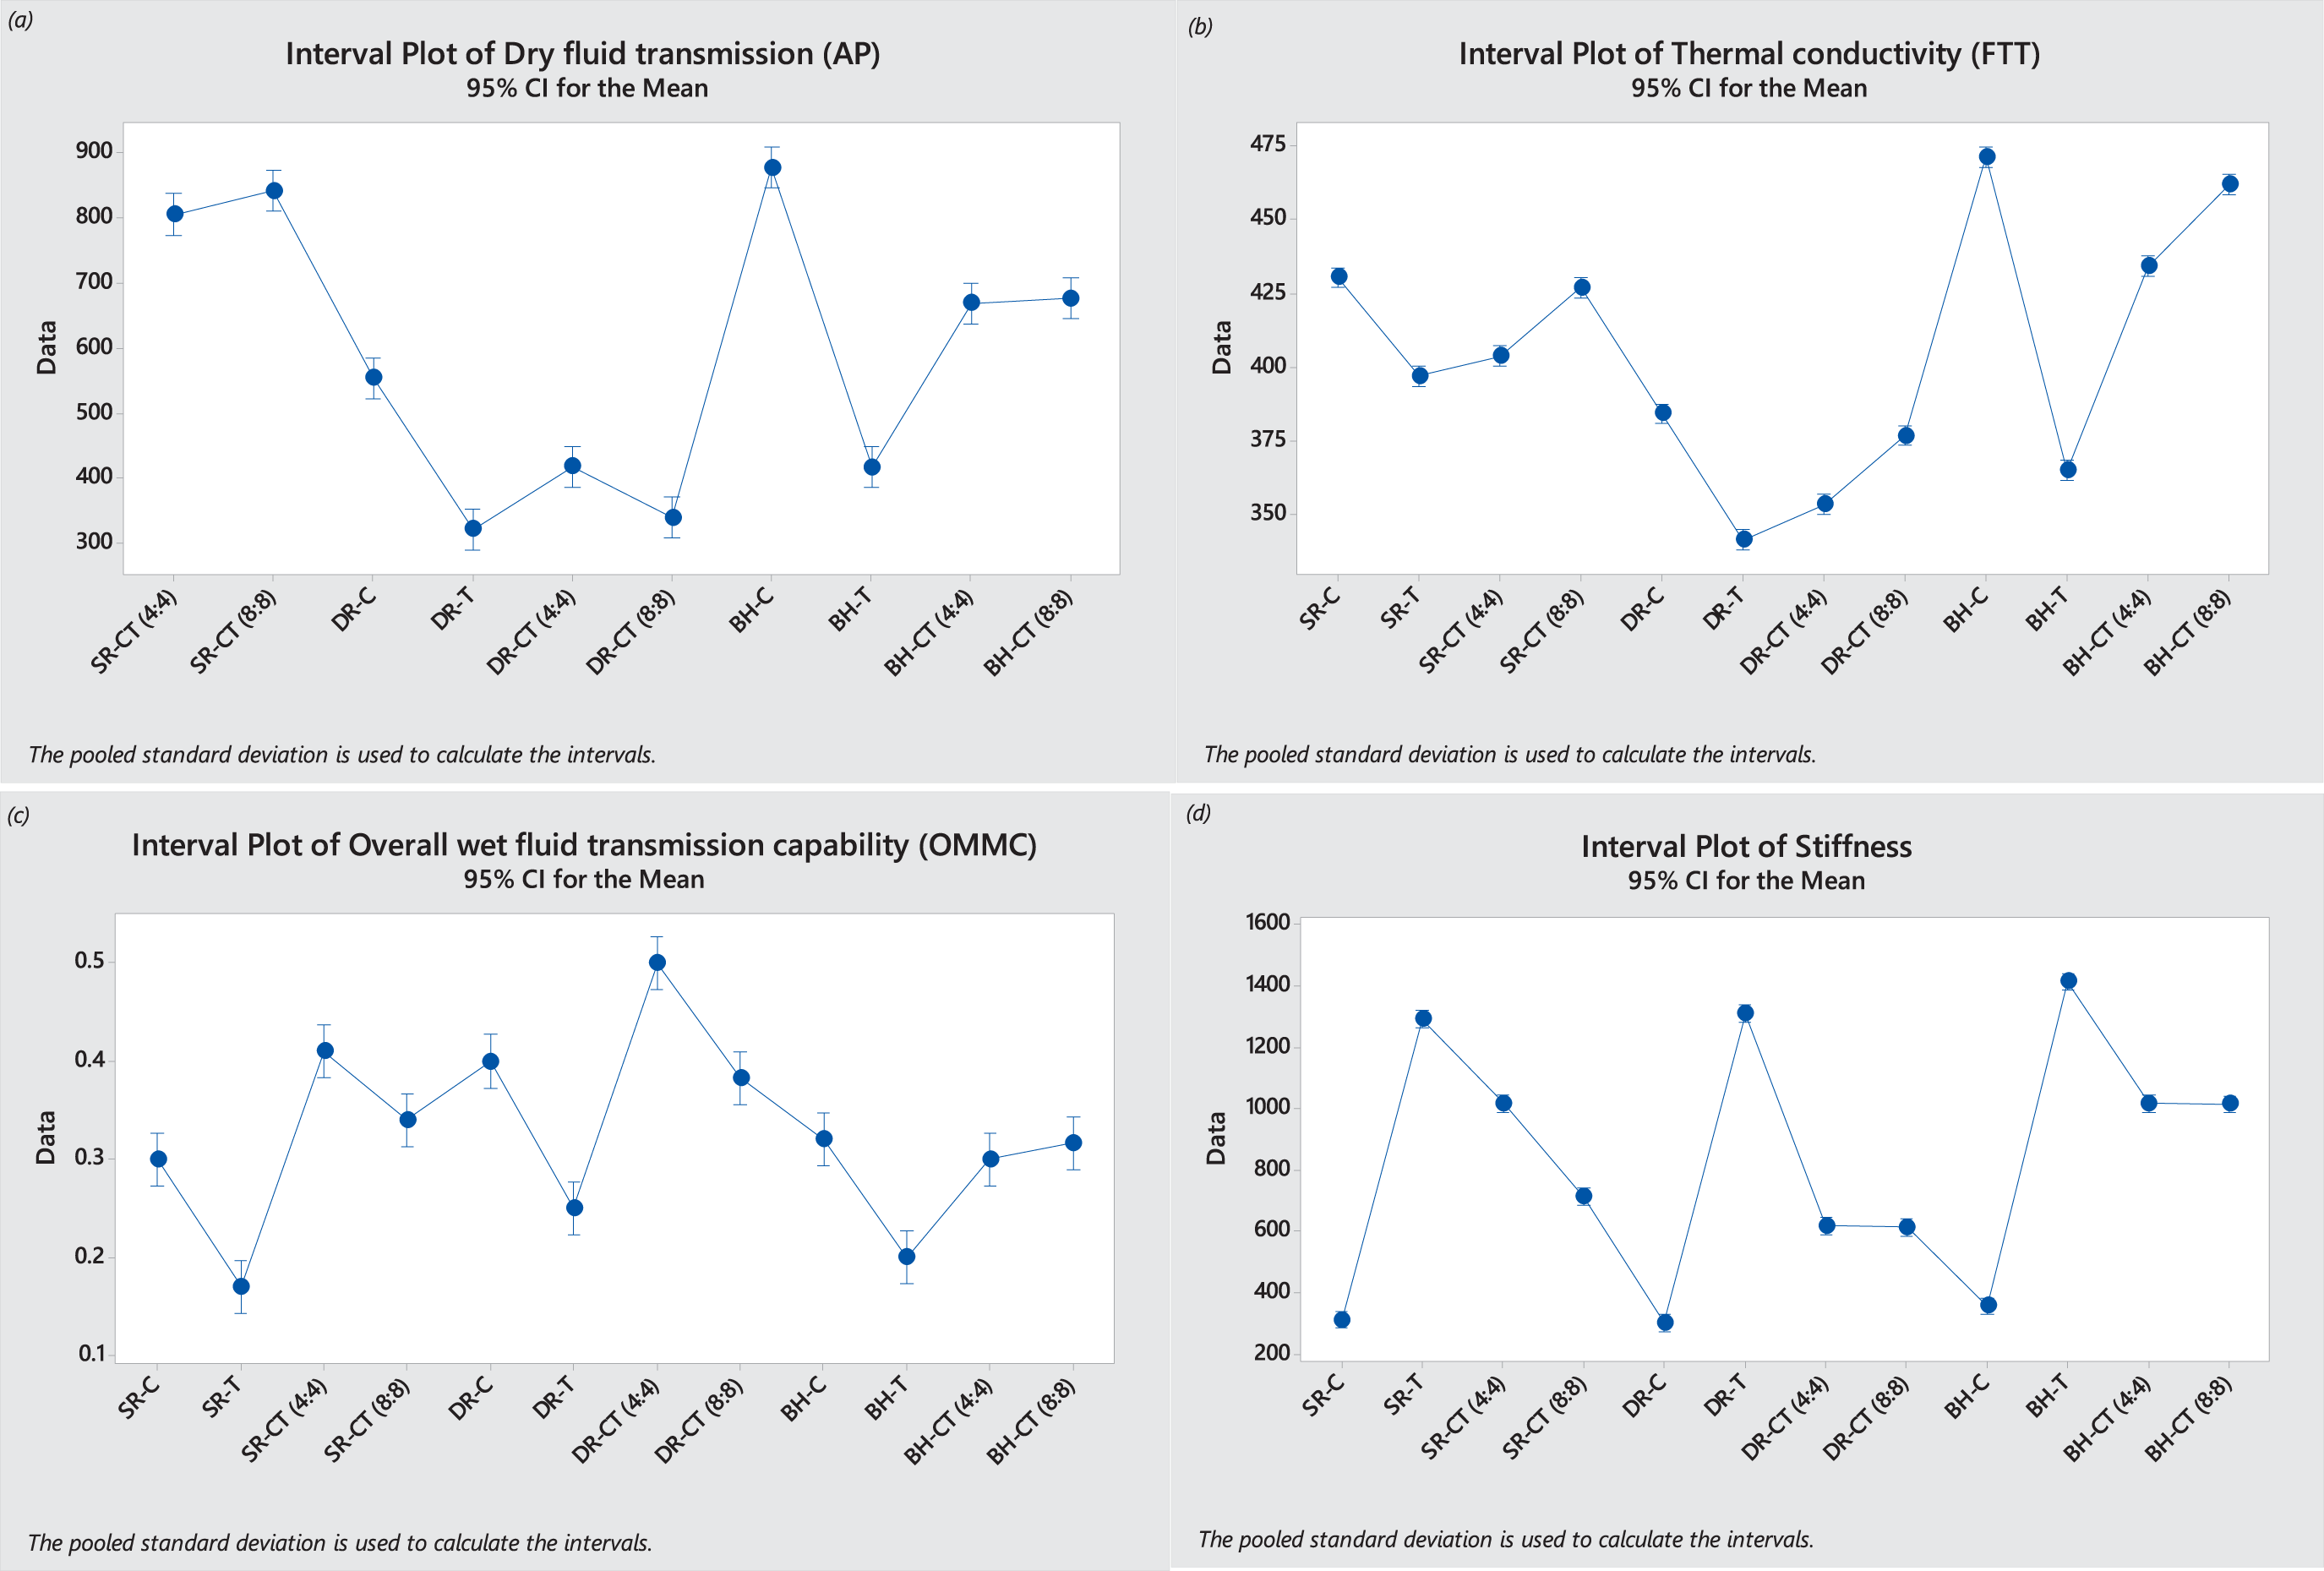
Conclusions
This study presented a novel methodology for engineering stretchable honeycomb structures offering unique thermal comfort attributes via structural variation and employing some unique elastomeric yarns. The developed fabrics could have successful applications in stretchable woven garments (breathable pajamas, body conforming shirts, and comfy wear etc.) requiring adequate thermal comfort properties which are not possible using conventional spandex yarn. Dry fluids transmission analysis showed that samples having 100% T-400 in them have the least air permeability due to the highest number of ends picks per inch. While samples containing 100% cotton showed the highest air permeability as least number of ends and picks per inch were there making more structural pores for dry fluids transmission. Sample SR-C showed highest AP due to open and loose structure and sample DR-T showed lowest AP due to compact fabric structure. FTT results revealed that thermal conductivity was highest in sample BH-C as there were a smaller number of interlacements among the fabric and making the fabric structure loose while in sample DR-T, an opposite phenomenon was observed as it had highest areal density making fabric compact. OMMC index data revealed that sample SR-T has lowest OMMC index due to absence of cotton hence facing difficulty in absorption of moisture while sample DR-CT (4:4) showed highest OMMC index as cotton and T-400 both were present plus its optimized float length also helped for moisture handling. The BH-T specimen was found highest in terms of stiffness due to its tight and compact structure while sample SR-C showed least stiffness due to least number of interlacements and ends picks per inch in the sample making its structure loose. Statistical analysis also proved the significance of input parameters by showing p-values <0.05 with r-square values higher than 95% for all studied thermal attributes. Whereases thermal conductivity and fabric stiffness had an exceptional r-square values of above 99% proving the reliability of statistical model.
Footnotes
Declaration of conflicting interests
The author(s) declared no potential conflicts of interest with respect to the research, authorship, and/or publication of this article.
Funding
The author(s) disclosed receipt of the following financial support for the research, authorship, and/or publication of this article: This work was supported by the Higher Education Commission, Pakistan (GCF-063).