
Abstract
Gas sensors based on ZnO nanocomposites have been widely investigated for the detection of various gases. However, few studies have reported electrospun ZnO for NOx gases, especially NO (nitrogen monoxide), due to its high tendency for oxidation upon contact with air. The development of gas sensors that operate at temperatures below 300°C is challenging for metal oxide gas sensors, as decreasing the temperature can lead to lack of sensitivity and very long recovery times. In this study, the operating temperature was improved to 200°C while achieving a high response to a low concentration of 0.5 ppm gas, with recovery times of 572s and 105s for NO and NO2 (nitrogen dioxide), respectively. Detecting NO and NO2 at low ppm and ppb levels is a major demand and challenge for the development of metal oxide-based gas sensors, especially for health monitoring portable sensors. This study focuses on the design and performance of a NOx gas sensor based on ZnO nanofibrous material with precise structural optimization. The study optimizes the precursor for electrospinning without using any additives. The sensing materials proportion were optimized by changing the ratio of ZnAc:PVA in the precursor of electrospinning solution. Choosing ZnAc:PVA = 1.5 as the optimum precursor for synthesizing ZnO nanofibers resulted in the highest response of 27 and 16 (Ohm/Ohm) for 0.5 ppm NO and NO2, respectively, at 200°C and relative humidity of 50%. Additionally, reproducible sensors were developed, which is crucial for mass production. This remarkable sensitivity in low concentration indicates that the design of material structure and the control of zinc acetate amount in the electrospun solution has great practical applications to detect both gases.
Introduction
Gas sensors have undoubtedly emerged as indispensable components across numerous applications, spanning from our daily lives to critical sectors such as medicine and environmental monitoring.1,2 Amongst gas sensing mechanisms, semiconductor gas sensors offer exceptional sensitivity and selectivity.1–4 Central to the success of semiconductor gas sensors is the complex interplay between material composition and structural design. These two matters jointly dictate the ability of the sensor to detect target gases with precision and reliability. Zinc oxide (ZnO) as a semiconducting material has gained attention in gas sensing owing to its remarkable optical and electrical properties.5–9 Its use is enhanced due to its distinctive properties, namely, wide bandgap, high electron mobility, and excellent chemical stability. These attributes appoint ZnO as a good candidate for gas sensing applications, as they enable effective interaction with target gases and facilitate rapid response and recovery times. 10
ZnO gas sensors are widely used in various applications due to their high sensitivity, stability, and cost-effectiveness. However, their operation at high temperatures presents certain challenges. 11 They are used to detect volatile organic compounds (VOCs) and biomarkers in exhaled breath, which can help diagnose diseases like lung cancer and asthma. For instance, they can detect nitric oxide (NO), a biomarker for asthma, and other VOCs associated with different medical conditions. 11 Moreover, ZnO sensors are employed to monitor pollutants like nitrogen oxides (NOx) in industrial environments. The World Health Organization (WHO) and the European Union (EU) have set guidelines for NO₂ levels. The annual mean value should not exceed 20 ppm (part per million), therefore, if the sensor can detect below this concentration it is approved for environmental sensing application. On the other hand, for monitoring health, the concentration of nitric oxide (NO) in exhaled breath for healthy individuals, adults, is between 5 and 25 ppb (parts per billion). 12 One of the challenges for these sensors is their high working temperature (250 to 400°C) which can be a limitation for portable and battery-operated devices. 13 In addition, prolonged exposure to high temperatures can degrade the sensor material, reducing its lifespan and reliability. 13 Some ZnO-based sensors exhibit slow response and recovery times, which can be problematic for real-time monitoring applications. 14 Researchers are actively working on addressing these issues by modifying the morphology of the sensor, doping with other materials, and exploring alternative activation methods such as light activation to improve performance at lower temperatures.
Nanofibrous structures fabricated through the electrospinning method have shown promising applications.15,16 In pursuit of improved gas sensing performance for metal oxides, researchers have explored numerous approaches, including morphology regulation,17–19 preparation methods, doping activation by external light sources, and composite materials.20,21 Various nanostructures and types of semiconductor metal oxide (SMO) sensing materials have been successfully employed to address these limitations. Among them, one-dimensional nanostructured sensing materials such as nanofibers, nanowires, and nanorods have gained significant preference for gas sensor development. This preference stems from their inherently higher surface-area-to-volume ratio, which allows for enhanced absorption of the target gas. Additionally, the broader interaction zone across the cross-sectional area enables a more pronounced modulation of electrical properties upon analyte exposure. 22
Electrospinning allows for the fabrication of ZnO nanofibers with tailored dimensions, thereby amplifying the surface area available for gas interaction. This technique not only enhances sensitivity but also provides an avenue for the selectivity of the sensor due to the special structure. 8 Electrospun gas sensors are utilized in various applications to detect a wide range of gases. These sensors are employed to monitor atmospheric pollutants such as nitrogen dioxide (NO2). They play a crucial role in ensuring workplace safety by detecting hazardous gases. Additionally, ZnO-based sensors are effective in detecting biomarkers in breath analysis, thus, they are valuable for non-invasive medical diagnostics. 23 The nanofiber morphology promotes the adsorption of gas molecules onto the surface, resulting in enhanced sensor response even at lower concentrations of the target gases. In healthcare, gases like nitrogen dioxide (NO2) and nitric oxide (NO) hold particular significance due to their implications for respiratory disorders.20,24–29 Detecting NO especially in ppb level rises a formidable challenge due to its high reactivity. 30 Consequently, gaining a deep understanding and optimizing the parameters that influence the performance of sensors designed for these gases is important. Generally, nanofibers with smaller nanograins have better sensitivity and faster response than those with larger nanograins due to the higher surface area. 31 It’s worth highlighting that nanofiber sensors offer a significant advantage in terms of reduced response and recovery times. This advantage is particularly important, as slow response and recovery times used to be a significant drawback of traditional gas sensors. This improvement can be attributed to the extensive surface area and heightened porosity of nanofiber-based sensitive materials. Unlike standard thin- and thick-film technologies that generate granular layers with densely packed nanoparticles, leading to inefficient gas transfer, electrospun sensors display a dual distribution of pore sizes, encompassing both small and large pores. This feature augments gas diffusion and increases the conductometric response of these layers. 32 The structure of as-spun nanofibers can be influenced by each step of the electrospinning process.
To enhance NO and NO2 sensing capabilities, strategies like incorporating noble metals or creating heterojunctions have been explored.3,33–36 However, less attention has been given to investigating the impact of the metal oxide ratio in the precursor and ZnO fiber-shape structure on sensitivity. In this study, we addressed this gap by manipulating the zinc acetate ratio in the precursor solution (poly (vinyl alcohol) (PVA)) used for electrospinning, resulting in ZnO nanofibers with different compositions after calcination. As the chemiresistive gas sensors mechanism is highly affected by temperature,14,37,38 sensors were tested at different temperatures. Therefore, this study presents a comprehensive exploration of the relationship between ZnO concentration, nanofiber morphology, and gas sensing performance. Additionally, by comparing the detection of NO and NO2 gases, it is revealed that 300°C is a temperature for the selectivity of NO gas. The findings not only shed light on the fundamental principles governing ZnO-based gas sensors towards NO and NO2 gases, but facilitate the design of nanofiber-based sensors for specific applications, such as healthcare.
Experiments
Materials
Poly (vinyl alcohol) (MW 89,000–98,000 g/mol, 99+% hydrolyzed) and zinc acetate dihydrate ((CH3CO2)2Zn) were obtained from Sigma Aldrich Corp (France) and used without any further processing or refining. Polyethylene glycol tert-octylphenyl ether (Triton® X-100) was purchased from Fluka.
Synthesis of ZnO nanofibers
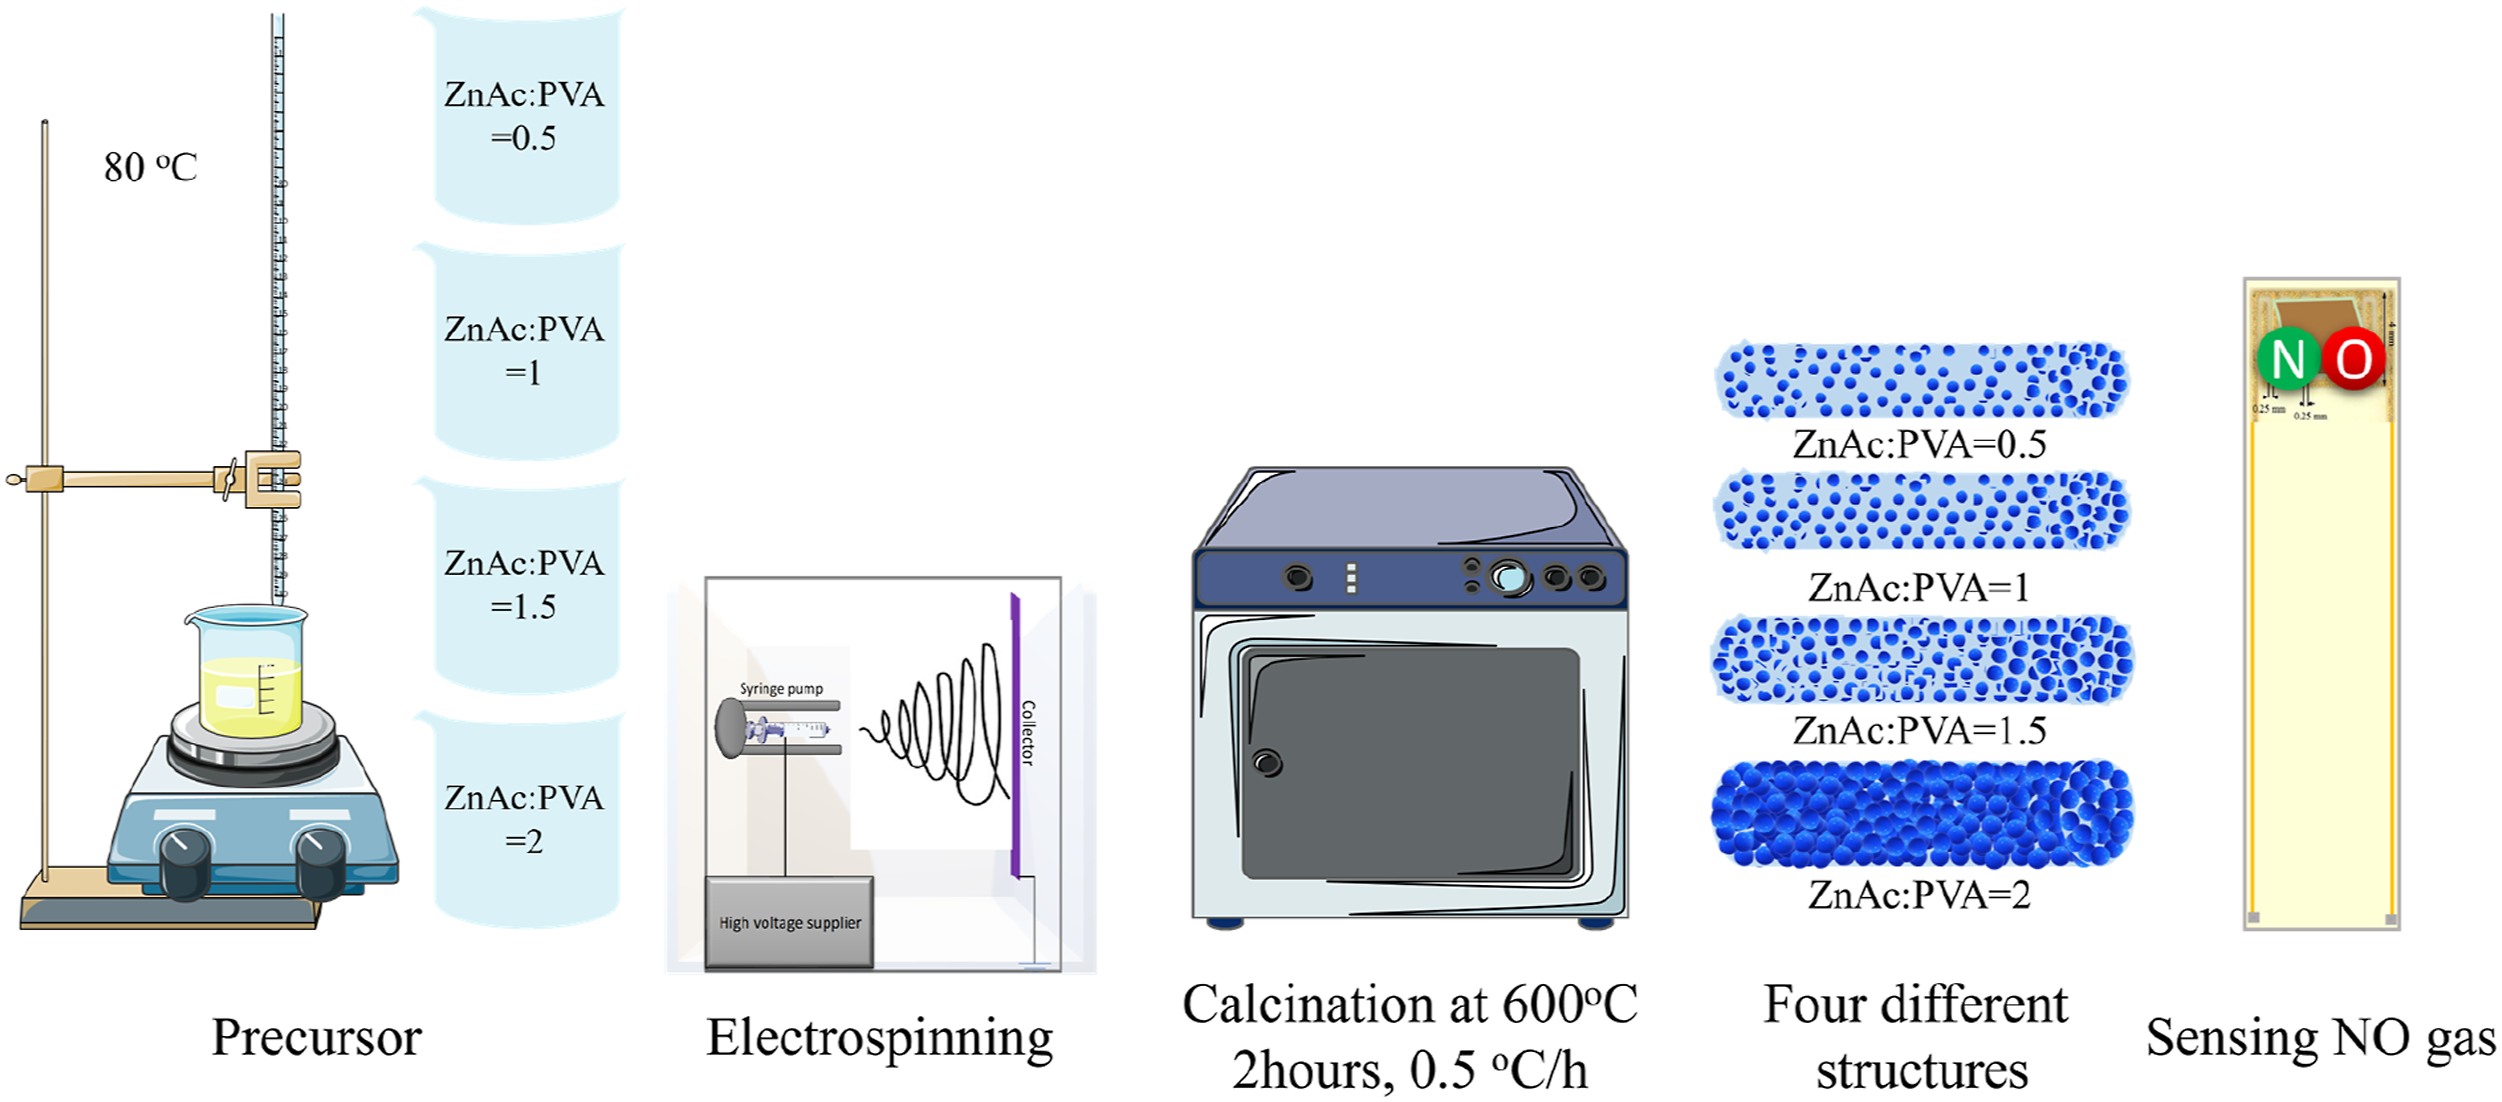
To obtain the ZnO nanofibers, zinc acetate (ZnAc) was added to polyvinyl alcohol (PVA). The steps to prepare a 3 mL solution with equal grams of PVA and zinc acetate (ZnAc:PVA = 1) are as follows. First, zinc acetate was weighed and added to distilled water. This mixture was then subjected to ultrasonic treatment until a transparent solution was obtained. Afterwards, Triton® X-100 was introduced to promote a consistent electrospinning process and stirred for a few seconds with a magnetic stirrer. Next, PVA was added to the solution and stirred for 2 h at 80°C with a speed of 300 r/min to form a viscous solution. The calculation for weighing the ZnAc and PVA was based on PVA being 15 wt%. Accordingly, varied amounts of ZnAc (corresponding to different ratios of 0.5, 1, 1.5, and 2, gr:gr) were prepared for electrospinning. The amount of ZnAc and the suitable polymer to synthesize ZnO nanofibers were not only reviewed through previous studies39–45 but also subjected to significant experimental evaluation.
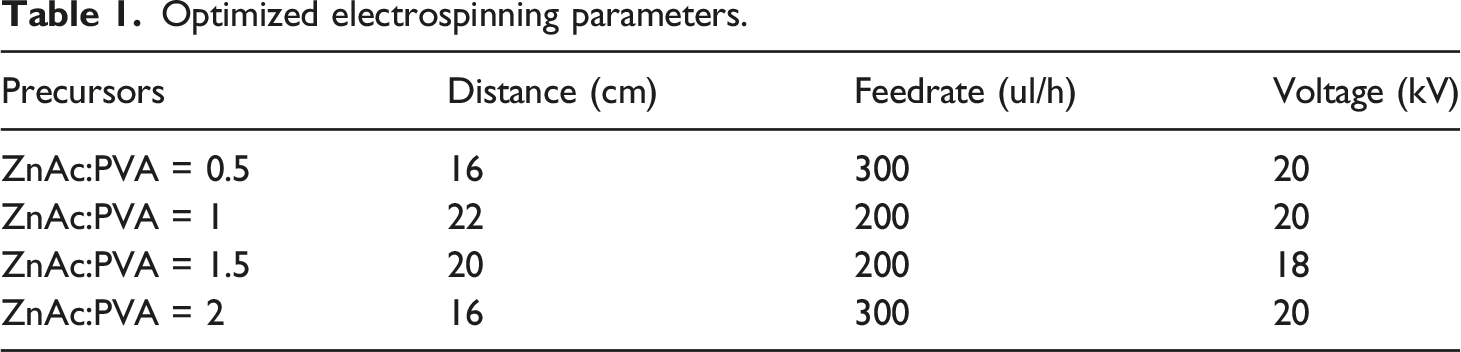
Optimized electrospinning parameters.
The obtained precursor nanofibers were collected on an alumina crucible. In the second step, as-spun nanofibers were calcined in the oven, at 600°C for 2 h with a heating rate of 0.5°C/h, to remove organic matter thoroughly. Calcination process is necessary to synthesize the ZnO. The ZnO nanofibers, regarding to their ZnAc ratio, were labeled as ZnO-0.5 (ZnAc:PVA = 0.5), ZnO-1 (ZnAc:PVA = 1), ZnO-1.5 (ZnAc:PVA = 1.5) and ZnO-2 (ZnAc:PVA = 2).
The fabrication of the samples was executed using an electrospinning cabin (Fluidnatek/LE 50, Bioinicia, Spain) and a calcination system (Nabertherm Co, 30 °C–3000 °C, Germany).
Characterization
The microstructural and morphological characteristics of ZnO nanofibers were investigated by a Scanning Electron Microscope (SEM) (Phenom ProX, ThermoFischer Scientific) and the nanofiber diameters were measured using MATLAB software. The solution behaviors were studied by viscosity (Lamy Rheology Viscometer RM100 Plus), conductivity (Mettler Toledo Seven Direct SD23) and surface tension (GBX Instrumentation Scientific 3S). Transmission versus wavenumber was studied by a Fourier-Transform InfraRed (FTIR) spectrometer (Model NEXUS). Thermal analysis were conducted by using Thermogravimetric Analysis (TGA) and Differential Scanning Calorimetry (DSC) (PekinElmer 4000 and 6000). Moreover, the phase and crystallinity of the samples were analyzed by X-ray diffraction with radiation of CuKα, (XRD, Thermo Fisher EQUINOX 3000). Finally, the BET surface area analyzer (Quanta Chrome, AUTOSORB-1) was used to determine the surface area, pore size distribution and cumulative pore volume of nanofibrous webs.
Sensor fabrication and gas sensing measurement
In order to fabricate the ZnO-based sensor, the calcinated electrospun layer was directly placed onto the interdigitated Au electrode purchased from CMAC Co, USA, with a 0.25 mm gap, situated on an Al2O3 substrate as it is depicted in Figure 1. The rear of the substrate was covered by a Pt heater. The schematic of ZnO sensor substrate.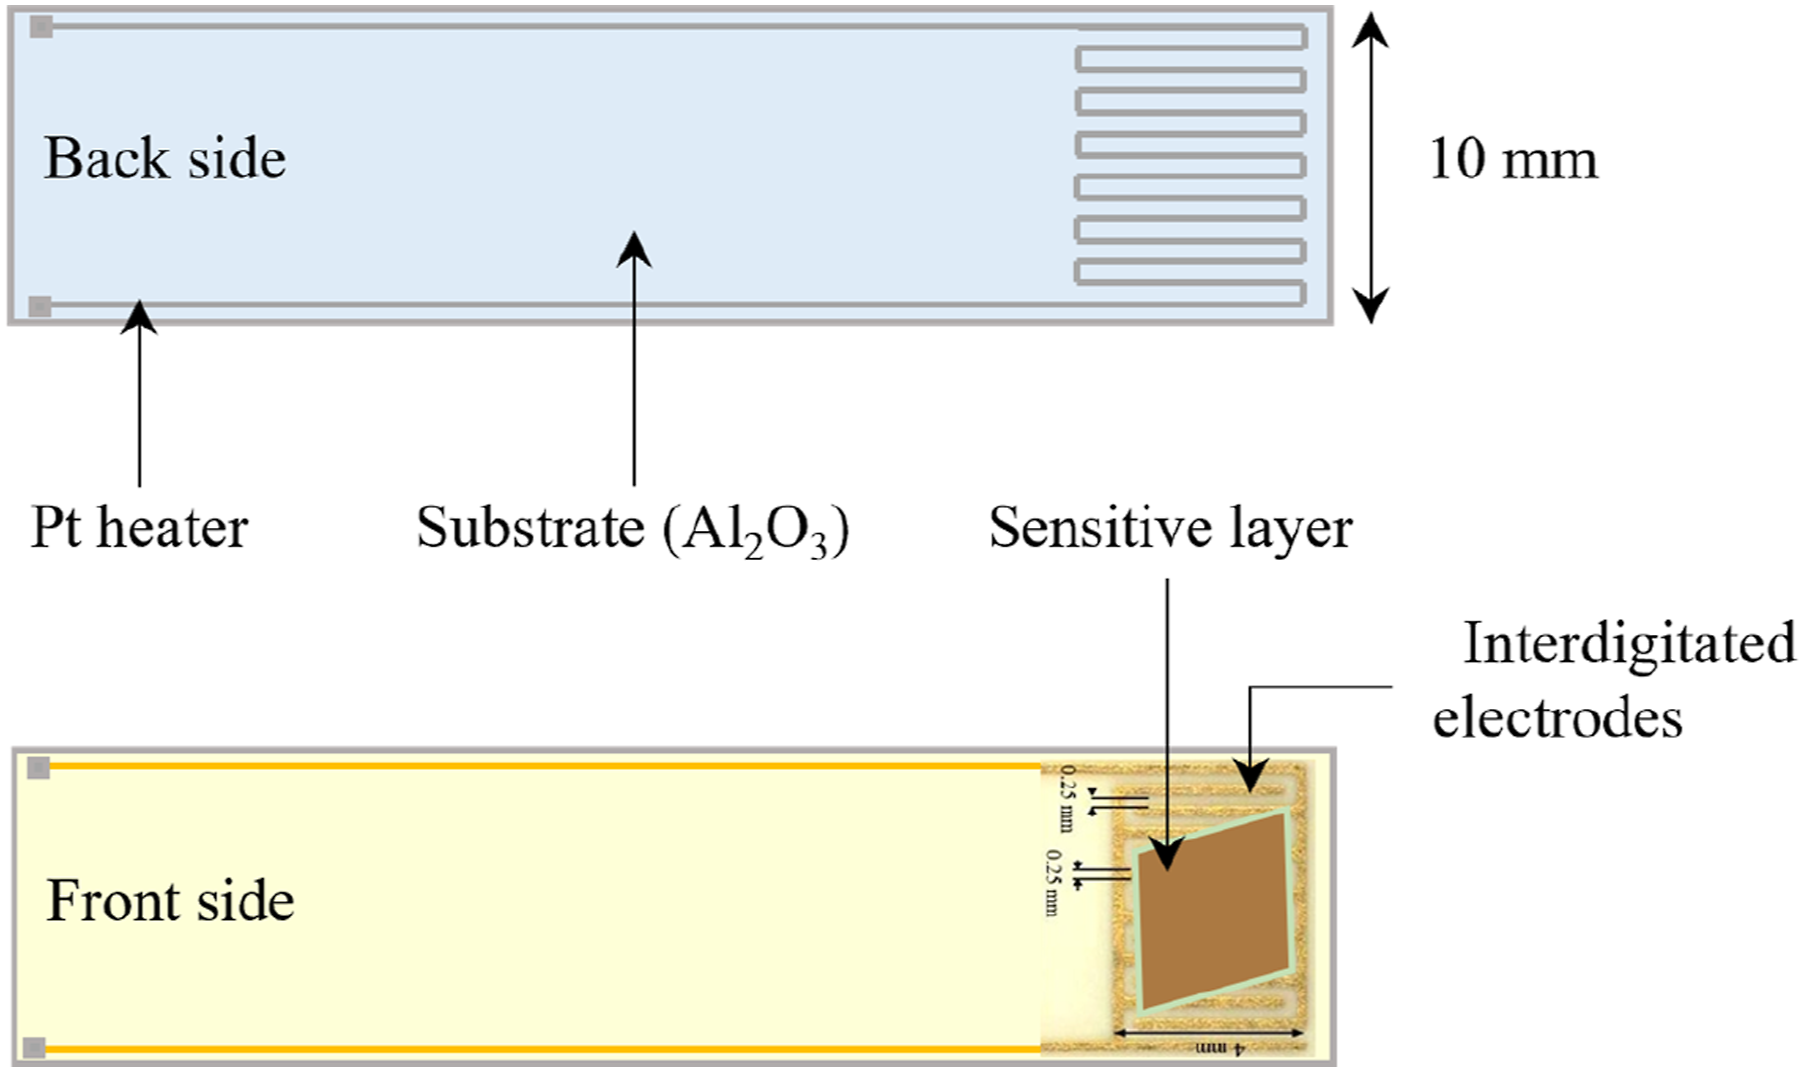
To ensure optimal adhesion, electrodes underwent a rigorous cleaning process, eliminating oil and dust with a solvent sequence of acetone, iso-propanol, and distilled water. Subsequently, heated at 120°C for 10 min, ethanol was meticulously applied to cover the sensing layer entirely. The reason was to have good nanofiber to electrode adhesivity and because of the high surface tension of water, the water droplet that fell on the nanofiber layer in drop casting damaged the layer. Therefore, ethanol was applied instead of water due to its lower surface tension. It completely covered the nanofiber layer and caused the layer to stick to the electrode. Thereafter, the heating process was carried out to dry out any extra moisture remaining on the electrode. After drying, a 110°C heating for 10 min followed. Gas sensing was evaluated with a system (Figure 2) featuring three mass flow meters controlled by a computer, a humidity-regulating bubbler, and a Teflon chamber for sensor placement. After a day of reaching the operating temperature, sensors were positioned in the chamber with inlet and outlet ports for gas circulation, ensuring controlled humidity (50% RH). Target gas concentrations were calibrated using a commercial chemiluminescence NOx analyzer (Thermo Electron, Netherlands). (a) Photo of the homemade gas sensitivity device and (b) its schematic representation.
To assess NO and NO2 sensing capabilities, four sensors, each with varying ratios of zinc acetate, were exposed to gas concentrations (5 ppm and 0.5 ppm) at temperatures ranging from 200°C to 350°C. Using a Keithly 2700 data acquisition system, DC resistance was continuously monitored. To control the temperature of the Pt heater, the following temperature function was used (equation (1)).
Sensor response, (Rg–Ra)/Ra, was calculated, along with recovery and response times. Where Ra represents the initial resistance in air and Rg is the resistance in the target gas. Response time denotes the duration for the sensor to reach 90% of its maximum response, while recovery time indicates the period to return to 90% of the original baseline signal upon gas removal.
Target gases preparation followed a specific protocol. NO and NO2 gases, at concentrations of 1000 and 100 ppm in a nitrogen (N2) atmosphere, were utilized. Volatile organic compounds (VOCs), excluding CH2O, used aqueous solutions following Henry’s law at 25°C. Formaldehyde (CH2O) at a concentration of 15 ppm was diluted in N2 for stability.
Results and discussion
Characterization and structural analysis
Electrospinning precursor and solution parameters.

To understand the proper temperature of calcination for removing PVA, TGA, and DSC of pure PVA and ZnAc/PVA nanofibers were performed. TGA analysis was applied from 25°C to 700°C with a heating rate of 10°C/min to study the thermal decomposition behavior of pure PVA and ZnAc/PVA nanofibers. The TGA result of ZnAc/PVA nanofibers is shown in Figure 3(a) in which three significant weight losses are occurring in the thermogravimetric characteristics curve. The first mass loss of 8.62% is in the range of 30 °C–120 °C. This weight loss is due to the loss of the residual water molecules or surface-absorbed water in the precursor composite fibers. It is accompanied by the first endothermic peak that appeared around 80°C in the Differential Scanning Calorimeter (DSC) curve in Figure 3(b) due to the evaporation of water. After dehydration, the second weight loss is around 50.04% occurred in the range of 120 °C–260 °C. This weight loss can be assigned to the decomposition of anhydrous Zn(CH3COO)2 into ZnO and the loss of the volatile components, including H2O, CO, and CO2. The second endothermic peak at around 115°C was detected due to the decomposition of the acetate group.
49
The third weight loss appeared in a range of 280 °C–560 °C (54.64%). This weight loss is due to the decomposition of PVA. This mass loss, however, occurs at 480°C for pure PVA. The endothermic peak value at around 255°C is close to the melting point of anhydrous zinc acetate and the exothermic peaks absorbed around 275°C in the DSC curve can be attributed to the vaporization of the acetate side chain and the main chain of PVA.
49
The results demonstrate that no weight loss occurs above 537°C, indicating the decomposition of PVA and implying that a calcination temperature higher than 540°C is required to fully decompose the zinc acetate into a pure ZnO phase. The DSC curve of pure PVA demonstrates the main chain decomposition with the first degradation at 220°C and the second at 325°C, accordingly. (a) TGA of PVA and ZnAc/PVA nanofiber, and (b) DSC analysis of PVA and ZnAc/PVA nanofiber.
The SEM images of nanofibers before and after calcination are presented in Figure 4. In addition, the atomic and weight percentage (wt%) of nanofibers after calcination are given. As is seen in Figure 4(a), after calcination, close to none of the ZnO remained in fiber form. Furthermore, by adding ZnAc in the solution, ZnO is obtained in fiber form, and by increasing the amount of ZnAc, the number of ZnO nanofiber rises. This phenomenon can be seen in Figure 4(d), (f) and (h), respectively. In Figure 5, a notable reduction in the diameter of the nanofibers occurs because of polymer and solvent evaporation after the calcination process. An observed linear relationship between the zinc acetate content and the diameter of the produced nanofibers underscores the potential for the precise control of nanometer-scale diameters by manipulating the proportion of the inorganic component within the solution. Additionally, the coherency, primarily attributed to the presence of PVA, between the nanoparticles is lost during this process. This leads to the creation of vacant spaces among the ZnO nanoparticles, in the form of fibrous structure. The diameter of nanofibers exhibits an increase with the rise in the ratio of ZnAc in the precursor. SEM images of ZnO nanofibers with a weight ratio of (a, b) ZnO-0.5, (c, d) ZnO-1, (e, f) ZnO-1.5 and (g, h) ZnO-2 in which (a, c, e, g) and (b, d, f, h) are before and after calcination, respectively. The circles specify the defects comprising electrosprays and bead formation and the arrows highlight the uniform and well-spun nanofibers. Diameter of nanofibers before and after calcination.
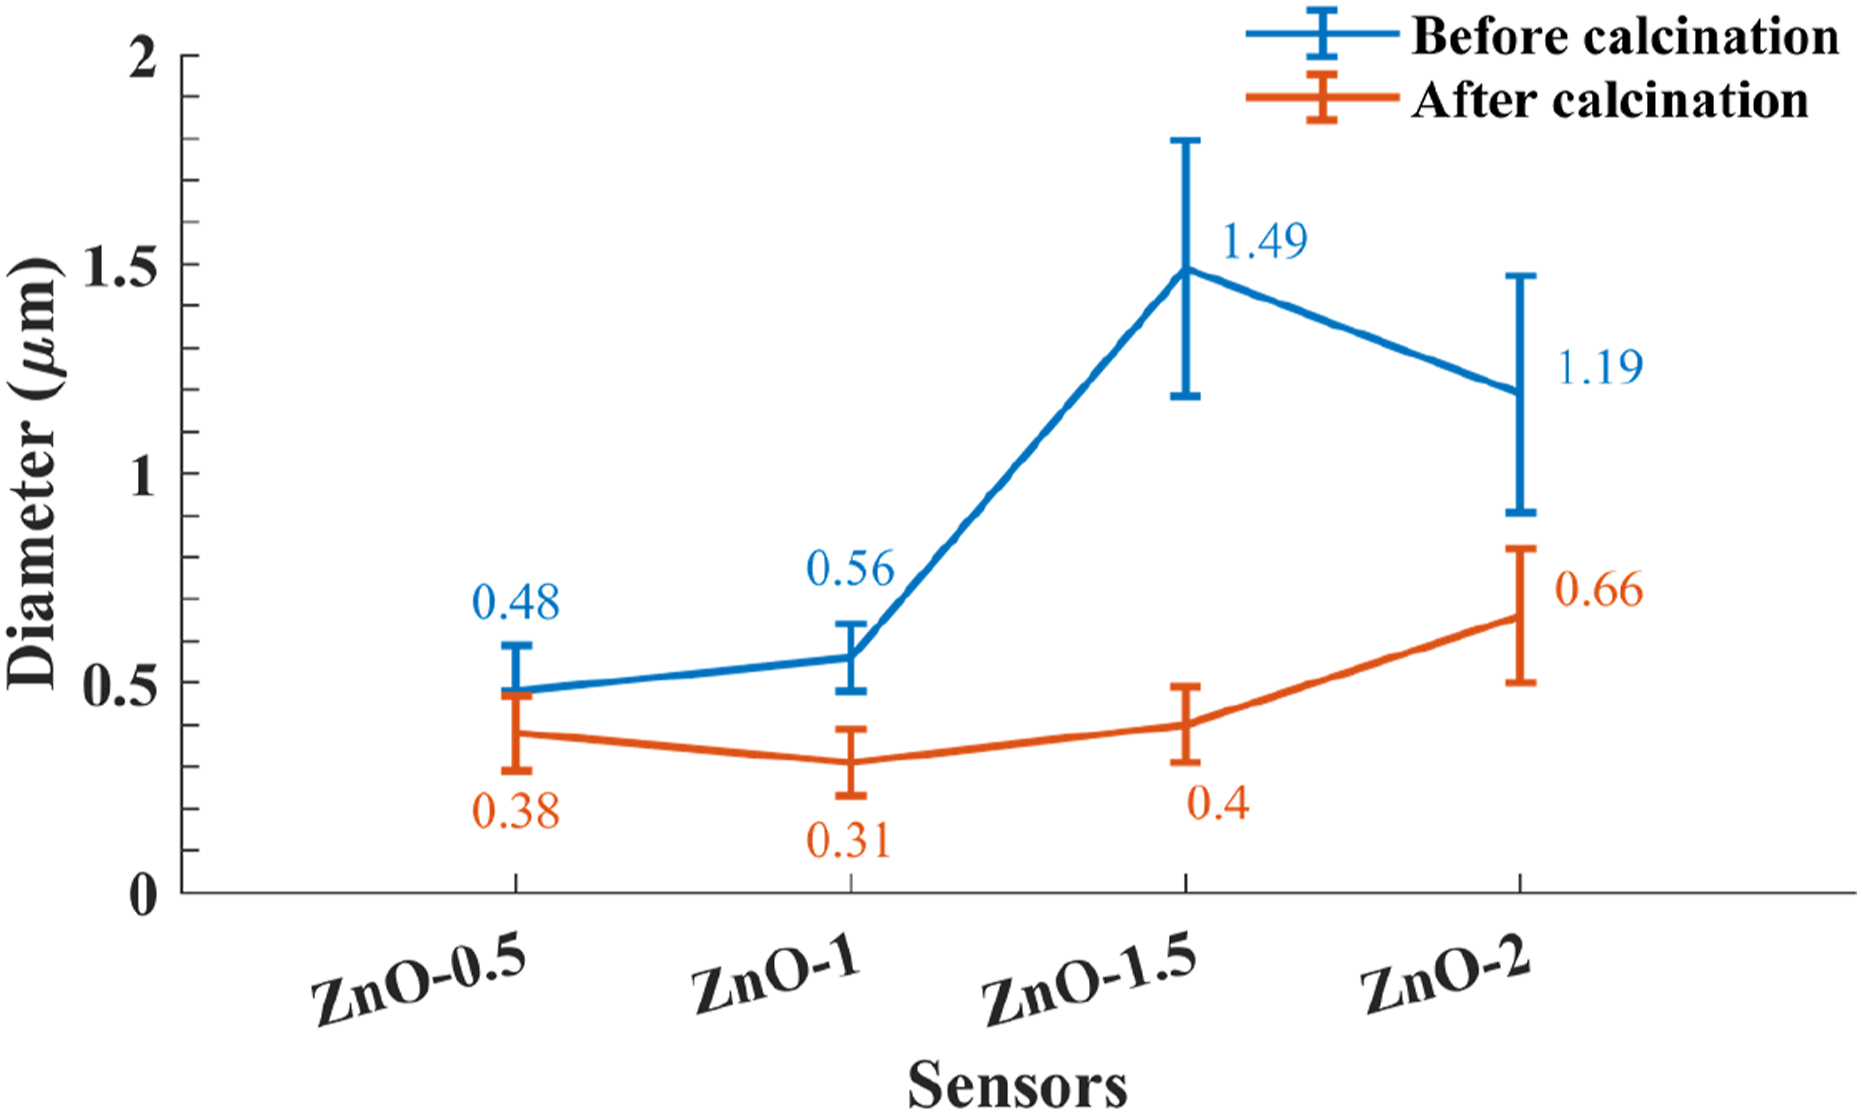
Many parameters are involved in the diameter size of the nanofibers. As it is presented in Figure 5, adding ZnAc influences the viscosity, conductivity and surface tension of the ZnAc: PVA solution. By increasing ZnAc, the diameter is enhanced, which means that viscosity directly affects the diameter. As the ZnAc increases even more, the conductivity of the solutions overcomes other parameters and causes a slight reduction in the diameter. Although conductivity rises by adding ZnAc, the viscosity of the solution increases more. Therefore, increasing the viscosity results in higher diameters.
FTIR analysis of ZnO nanofibers after calcination (Figure 6(a)) confirms that the area of the SEM image assigned to ZnO nanofibers is, indeed, rich in ZnO. ZnO possesses two transverse optical stretching modes, therefore, its IR spectrum regularly demonstrates a characteristic absorption ranging between 420 and 510 cm−1.
50
In the case of ZnO nanofiber this maximum is split into two maxima, one at 453 and the other at 455 cm−1. These observations show that ZnO was successfully synthesized. (a) FTIR spectra of ZnO-1.5 nanofibers and (b) XRD of ZnAc/PVA nanofiber before calcination and porous ZnO-1.5 nanofibers after calcination.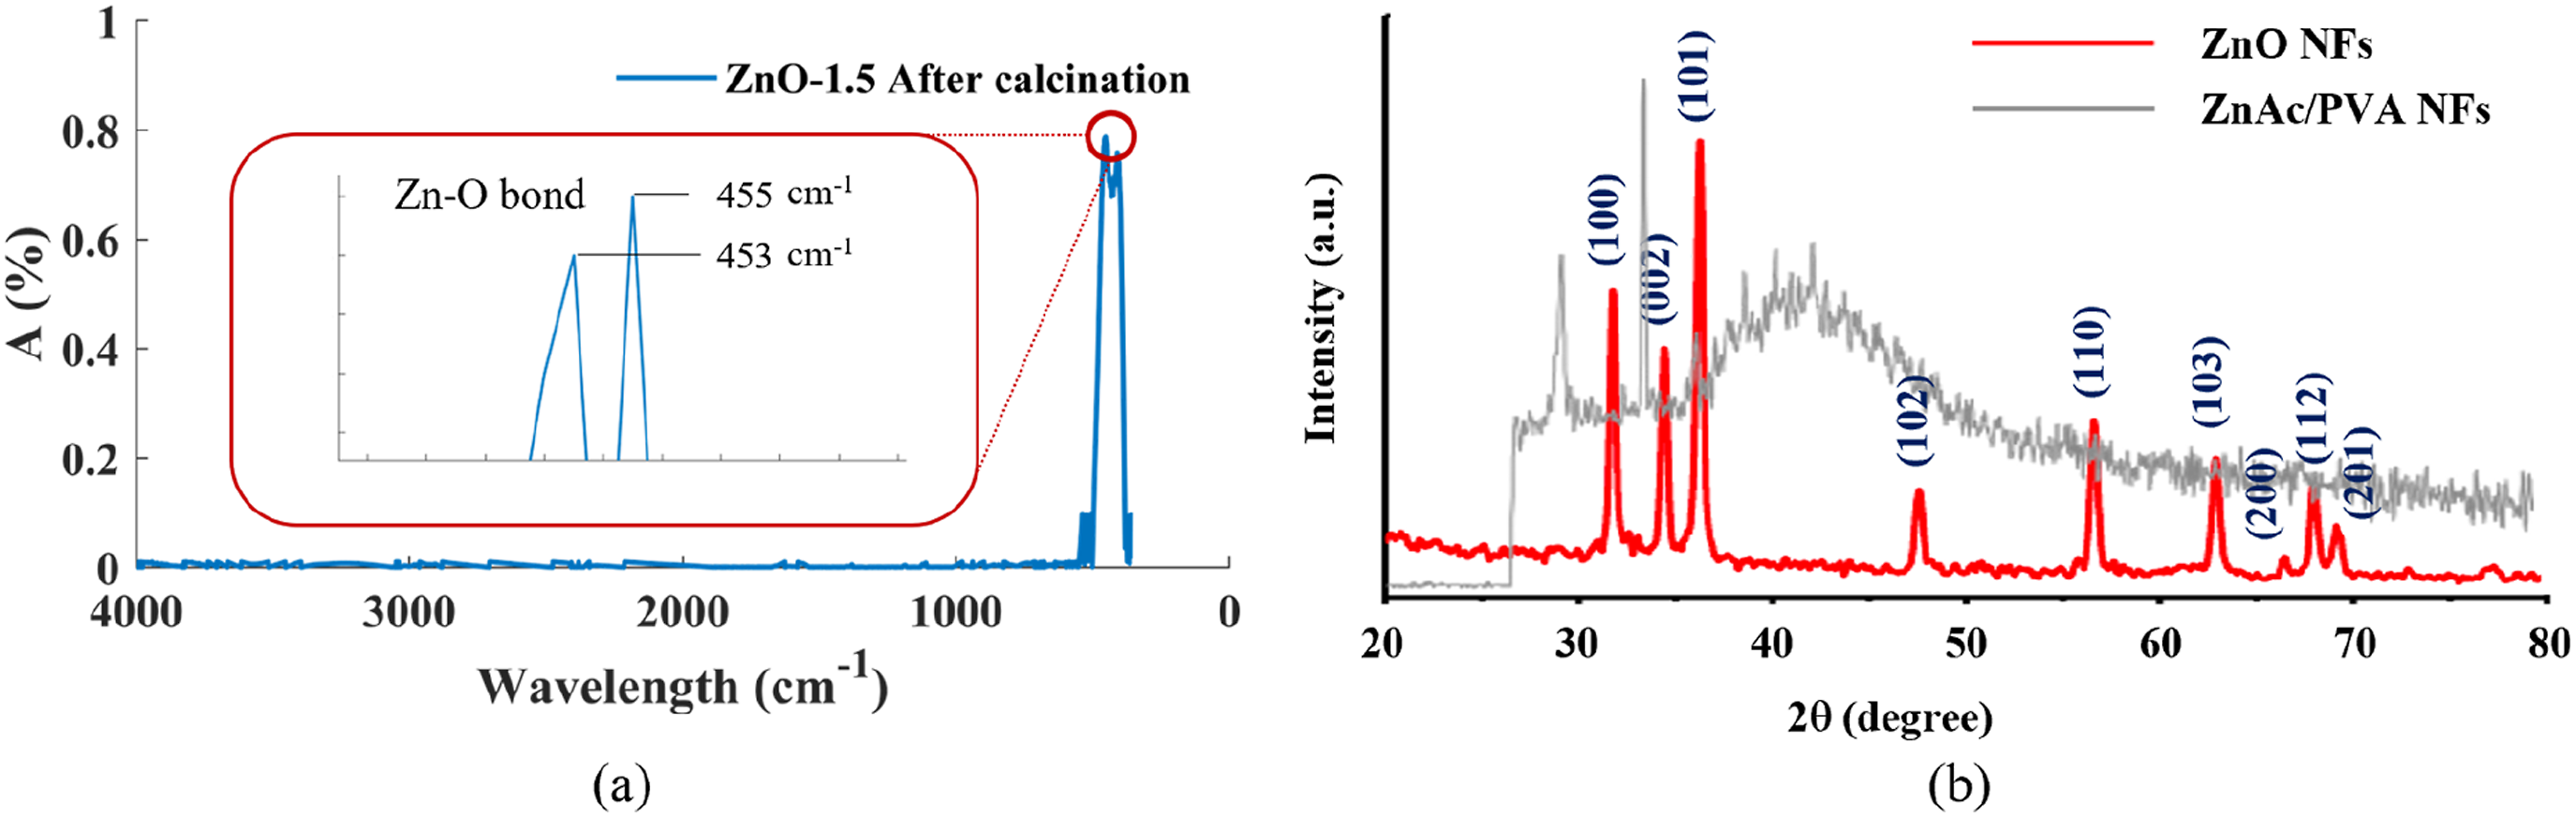
The X-ray diffraction (XRD) test was carried to assess the crystalline phase of the ZnO nanofibers which were synthesized under identical conditions. Previous research22,51 confirm that ZnO nanofibers have a hexagonal wurtzite structure with exceptional crystalline quality. In analyzing the XRD of ZnAc/PVA nanofibers before calcination, no ZnO crystallinity was detected, as presented in Figure 6(b). The XRD pattern of the ZnO nanofibers after calcination clearly illustrates several peaks originating from (0 0 2), (1 0 0), (1 0 2), (1 1 0) and (1 0 1) planes of ZnO in FFF (b), which indicate the hexagonal wurtzite structure of ZnO. The intensity of these peaks is very high, which specifies high crystallinity of the ZnO powder.52,53 The Debye-Scherrer equation (equation (2)) is used to calculate the crystal size and nature of ZnO crystal.
17

Gas sensing performance of fabricated sensors to nitrogen monoxide and nitrogen dioxide
An essential factor in evaluating gas-sensing performance is determining the optimal operating temperature.54,55 To address this, four different temperatures for all the sensors were investigated, ranging from 200°C to 350°C, while exposed to 5 ppm and 0.5 ppm NO and NO2 gases at a relative humidity of 50%. Below the temperature of 200°C, the response was low and the recovery time was high and above 20 min in which the sensors did not fully recover to their initial state. Therefore, the starting temperature was considered 200°C. Additionally, the sensors were also tested in 70% and 90% humidity and their response reduced to a little above half of when subjected to 50% humidity, in 90% humidity. Figure 7 displays the resistance curves of all four sensors in the air before injecting the target gases at different temperatures. The initial resistance of the sensor progressively decreases with increasing temperature in clean air, which indicates semiconducting behavior. This is because the increased number of electrons jump into the conduction band (CB) of ZnO with an increase in the temperature.
56
Initial sensor resistance in clean air versus temperature for all sensors.
The dynamic response of four sensors to 5 ppm and 0.5 ppm NO and NO2 at different temperatures is presented in Figure 8. As the target gas concentration increases, the response of all sensors exhibited an inclining trend. Nevertheless, an interesting observation is made at 200°C; there is a slightly higher response towards NO gas compared to NO2. This intriguing difference in response can be attributed to the distinct molecular structures of NO and NO2. NO possesses a linear molecular structure, which enhances its interaction with the surface of the sensing material.
57
Additionally, this linear structure may facilitate the penetration of NO gas into the material layers, increasing its accessibility to the sensing surface. These combined factors contribute to the slightly elevated response observed for NO gas at 200°C when compared to NO2. Additionally, the sensors illustrate stable sensing and recovery characteristics for multiple cycles at all operating temperatures, indicating reversible reaction/adsorption between gas molecules and sensing materials. Dynamic response of four sensors towards NO at (a) 200°C, (b) 250°C, (c) 300°C, (d) 350°C, and NO2 at (e) 200°C, (f) 250°C, (g) 300°C, (h) 350°C.
Increasing the amount of ZnO nanograins in the form of nanofibers shape can influence the sensitivity of gas sensors by increasing the surface area and the number of active sites for gas adsorption and reaction. The sensitivity of ZnO gas sensors depends on the amount of gas molecules that interact with the ZnO surface and affect its electrical conductivity. Therefore, having a higher amount of ZnO material in the shape of nanofibers can improve the sensitivity of gas sensors by providing more surface area and more active sites for gas molecules to adsorb and react. Additional ZnO in the nanofibers can also enhance the selectivity of gas sensors by modifying the charge carrier concentration, the oxygen vacancy density, and the surface work function. 58 As the amount of ZnAc increased, the sensitivity increased due to the presence of more sensing material and active sites. The optimum gas sensing is observed for ZnO-1.5 at 200°C and beyond this optimum ratio, the response began to decrease (for ZnO-2). This phenomenon is closely linked to the microstructure of the sensing material.
The decline in response could be attributed to agglomeration and the subsequent increase in nanofiber diameter, resulting in reduced surface area for gas molecules, despite the higher percentage of sensing material in sensor ZnO-2. The exceptionally high response observed in the ZnO-1.5 sensor can be attributed to several factors. First, ZnO nanofibers in this configuration possess a significantly higher surface-to-volume ratio. Additionally, the presence of pores within these nanofibers, resulting from the removal of the polymer, enhances their gas-sensing performance.17,59,60 This unique combination of high surface area and porous structure contributes to the remarkable response. Conversely, in sensors with a higher ZnO content, such as the ZnO-2 sensor, there may be an excess of ZnO, potentially covering these beneficial pores, leading to a reduced response compared to the optimal ZnO-1.5 sensor. Subsequently, the ZnO-1.5 sensor was selected for further analysis.
By the N2 physisorption test, the surface area, total pore volume, and pore size distribution of ZnO-1.5 and ZnO-2 nanowebs were also investigated. ZnO-1.5 and ZnO-2 nanowebs have 70.35 and 60.39 m2/g surface area with 2.947E-01 and 2.679E-01 cc/g total pore volume, respectively. The pore size distribution is shown in Figure 9. As demonstrated, the distribution of smaller pore size is more for ZnO-1.5 compared to ZnO-2. Thus, all these results are by the higher sensitivity of ZnO-1.5. Pore size distribution of (a) ZnO-1.5 and (b) ZnO-2 nanoweb.
Choosing ZnO-1.5 as the most responsive sensor, the resistance curve for the selected sensor after injecting the gases at different temperatures is shown in Figure 10. In all measurement instances, after injecting NO and NO2, the resistance levels increased upon exposure to both gases, as they are oxidizing types of gas. This observation is in agreement with previous studies61,62 that ZnO typically behaves as an n-type semiconducting metal oxide whose surface conductivity typically decreases upon exposure to electronegative gases such as NO2 and NO due to electron localization at surface adsorbates. This arises from the high electron affinity of the NO2 and NO molecules leading to electron transfer from the ZnO layer to surface adsorbates. Resistance of sensor ZnO-1.5 before and after injecting 5 ppm of NO and NO2.
The activation energy (EA) of the ZnO nanofiber structure NO gas sensor (ZnO-1.5) was calculated using the following equation.
Figure 11 demonstrates the dynamic curve of the sensor response towards both gases at different temperatures. As it can be seen, not only it is showing the highest response at 200°C but the sensor can be selective to NO rather than NO2 at the temperature of 300°C. Notably, as the temperature increases, a decrease in sensor response towards both gases can be observed. This phenomenon may be attributed to several factors. First, at higher temperatures, gas molecules tend to possess greater kinetic energy, reducing their adsorption onto the surface of the sensor.
63
Additionally, elevated temperatures can result in changes to the sensor surface properties, potentially leading to a decline in sensitivity. This temperature-dependent behavior is related to the gas adsorption/desorption kinetics on the surface of metal oxide.
23
Initially, the amount of adsorbed gas species gradually increases with the increase in temperature. A desorption also occurs simultaneously, but the rate of desorption is lower than that of adsorption. When an optimal temperature is reached, the adsorption/desorption equilibrium occurs.
64
However, after a specific temperature threshold (which depends on the SMO and the target gas molecule), the increase in temperature favors desorption, which reduces the sensitivity of the sensor. Dynamic response of sensor ZnO-1.5 at different temperatures to 5 ppm and 0.5 ppm (a) NO and (b) NO2 gas.
The recovery and response time for both gases at the concentration of 0.5 ppm at different temperatures are illustrated in Figure 12. As it can be seen, at 200°C, the sensor that displayed its best response towards NO had the highest recovery time. Thus, it may be interpreted that the gas molecules have diffused well in the layer and take a longer time to recover. At this temperature, the sensor surface kinetics are reduced, slowing down the desorption of gas molecules from the sensing material.
65
While the gas adsorption on the sensor surface is more rapid due to its high chemical reactivity, the desorption process is temperature-dependent. Lower temperatures hinder the energy required for molecules to break their bonds with the sensor surface and return to the gas phase. As a result, the recovery time is extended at lower temperatures. This phenomenon highlights the temperature sensitivity of the recovery process and underscores the need for a balance between response and recovery times in optimizing gas sensor performance. Moreover, for both gases, the highest temperature (350°C) exhibited the lowest response. Therefore, the lowest response time indicates that the gas molecules had too much kinetic energy and as a result, they could not connect to the surface and react properly. The response and recovery time of ZnO-1.5 sensor for 0.5 ppm of (a) NO and (b) NO2 under different temperatures.
To investigate more about NO, as it showed the highest response to the sensor, the real-time sensing response characteristics toward various concentrations (5, 3 and 1 ppm and, 0.5 ppm) for ZnO-1.5 are presented in Figure 13(a). With the increase of the gas concentration, the response of the sensor inclines. Low gas concentration tends to result in a lower surface reaction, which is a consequence of the low surface coverage of gas molecules on the gas sensor, causing a lower response.
57
However, the higher the concentration, the more NO covered the surface of the gas sensor and the more the reaction, so the response of the sensor is improved. Additionally, to evaluate the stability and durability of the sensors, repetitive sensing tests were carried out at 200°C for five reversible cycles for 5 ppm NO, as shown in Figure 13(b). It can be observed that after five cycles of continuous testing, the sensors exhibited fairly stable response values, with an extremely low standard deviation of 0.15 indicating their good repeatability characteristics. (a) Dynamic response of ZnO-1.5 sensor at the optimal temperature of 200°C to different concentrations of NO and (b) repeatability of the sensor for NO at 0.5 ppm.
Finally, the sensing selectivity of the ZnO-1.5 sensor is illustrated in Figure 14. The sensor represents the highest response, to 5 ppm NO, compared to others, which indicates an excellent selectivity. Furthermore, reproducibility and repeatability were both tested for the sensor. In this regard, it was produced three times and also tested twice, 3 months apart and the results were identical in both tests. Gas selectivity response of ZnO-1.5 sensor towards NO, NO2, acetone, isopropanol, ethanol, and formaldehyde at 200°C.
To study more about the developed sensors, NO gas is chosen as few studies have reported about this gas. For assessing stability and durability, repetitive sensing tests were conducted for five reversible cycles for 0.5 ppm of NO at 200°C, as depicted in Figure 15. Notably, the sensors responded promptly upon introduction of the test molecules and quickly reverted to their initial state upon exposure to air. Even after five cycles of continuous testing, the sensors maintained consistently stable response values, underscoring their robust stability. Repeatability of ZnO-1.5 sensor for 0.5 ppm of NO at 200°C.
Sensor stability and reproducibility tests are essential since they ensure that the sensors provide consistent and reliable measurements over time and in different conditions. Stability tests are carried out to determine whether or not the sensors can maintain their performance over time without being affected by external conditions. For this purpose, the sensor is subjected to continuous use or specific environmental conditions, and its performance and measurements are monitored to observe and evaluate any alterations or shifts. In addition to stability, reproducibility investigates if a sensor can produce the same measurements under varying conditions, for instance, different operators, equipment, and locations. In this regard, the sensor is tested in different setups, and the results are compared to check for consistency. 66
The stability of the sensor was tested twice, 6 months apart and as for reproducibility, the sensors were fabricated and tested three times in different periods. It is observed in Figure 16 that the ZnO-1.5 sensor exhibits significant reproducibility. Dynamic resistance-time curves of samples for reproducibility towards NO gas at 200°C.
Furthermore, humidity can significantly impact the performance of ZnO sensors. These sensors are sensitive to humidity, which can affect their baseline resistance and, consequently, their response to target gases. 67 The presence of water vapor can interfere with the adsorption and desorption processes of gas molecules on the sensor surface, leading to fluctuations in sensor readings. 68
All the aforementioned results were in 50% humidity. To investigate the effect of humidity on the accountability of the sensor, 70% and 90% humidity were also evaluated. Figure 17 illustrates the resistance and response curves of 50%, 70% and 90% relative humidities. The dynamic (a) resistance and (b) response curves for ZnO-1.5 sensor in 50%, 70% and 90% relative humidities towards NO gas at 200°C.
From the response data, it can be concluded that at higher humidity levels, RH 90%, the response and recovery times can be affected due to the increased presence of water molecules, which can interfere with the ability of the sensor to adsorb and react with the NO gas molecules.
Previous research on electrospun ZnO based gas sensors towards NO and NO2.

As observed in Table 3, the ZnO sensor presented in this study was of the lowest concentration of ppm, 5 ppm, the lowest temperature among available ZnO sensors, 200 °C, and the high response of 84 and 64 for NO and NO2 gas respectively.
Proposed mechanism of gas sensing
The interaction of gaseous species with semiconductor-based sensors includes two steps as it is demonstrated in Figure 18 for NO (similar to NO2). First, molecular oxygen in the atmosphere reacts with the sensor. Due to its high electronegativity, oxygen gas is chemisorbed on the surface of the sensor in the forms of Illustrative presentation of the outer depletion and inner conduction regions in connected particles of the sensing layer.


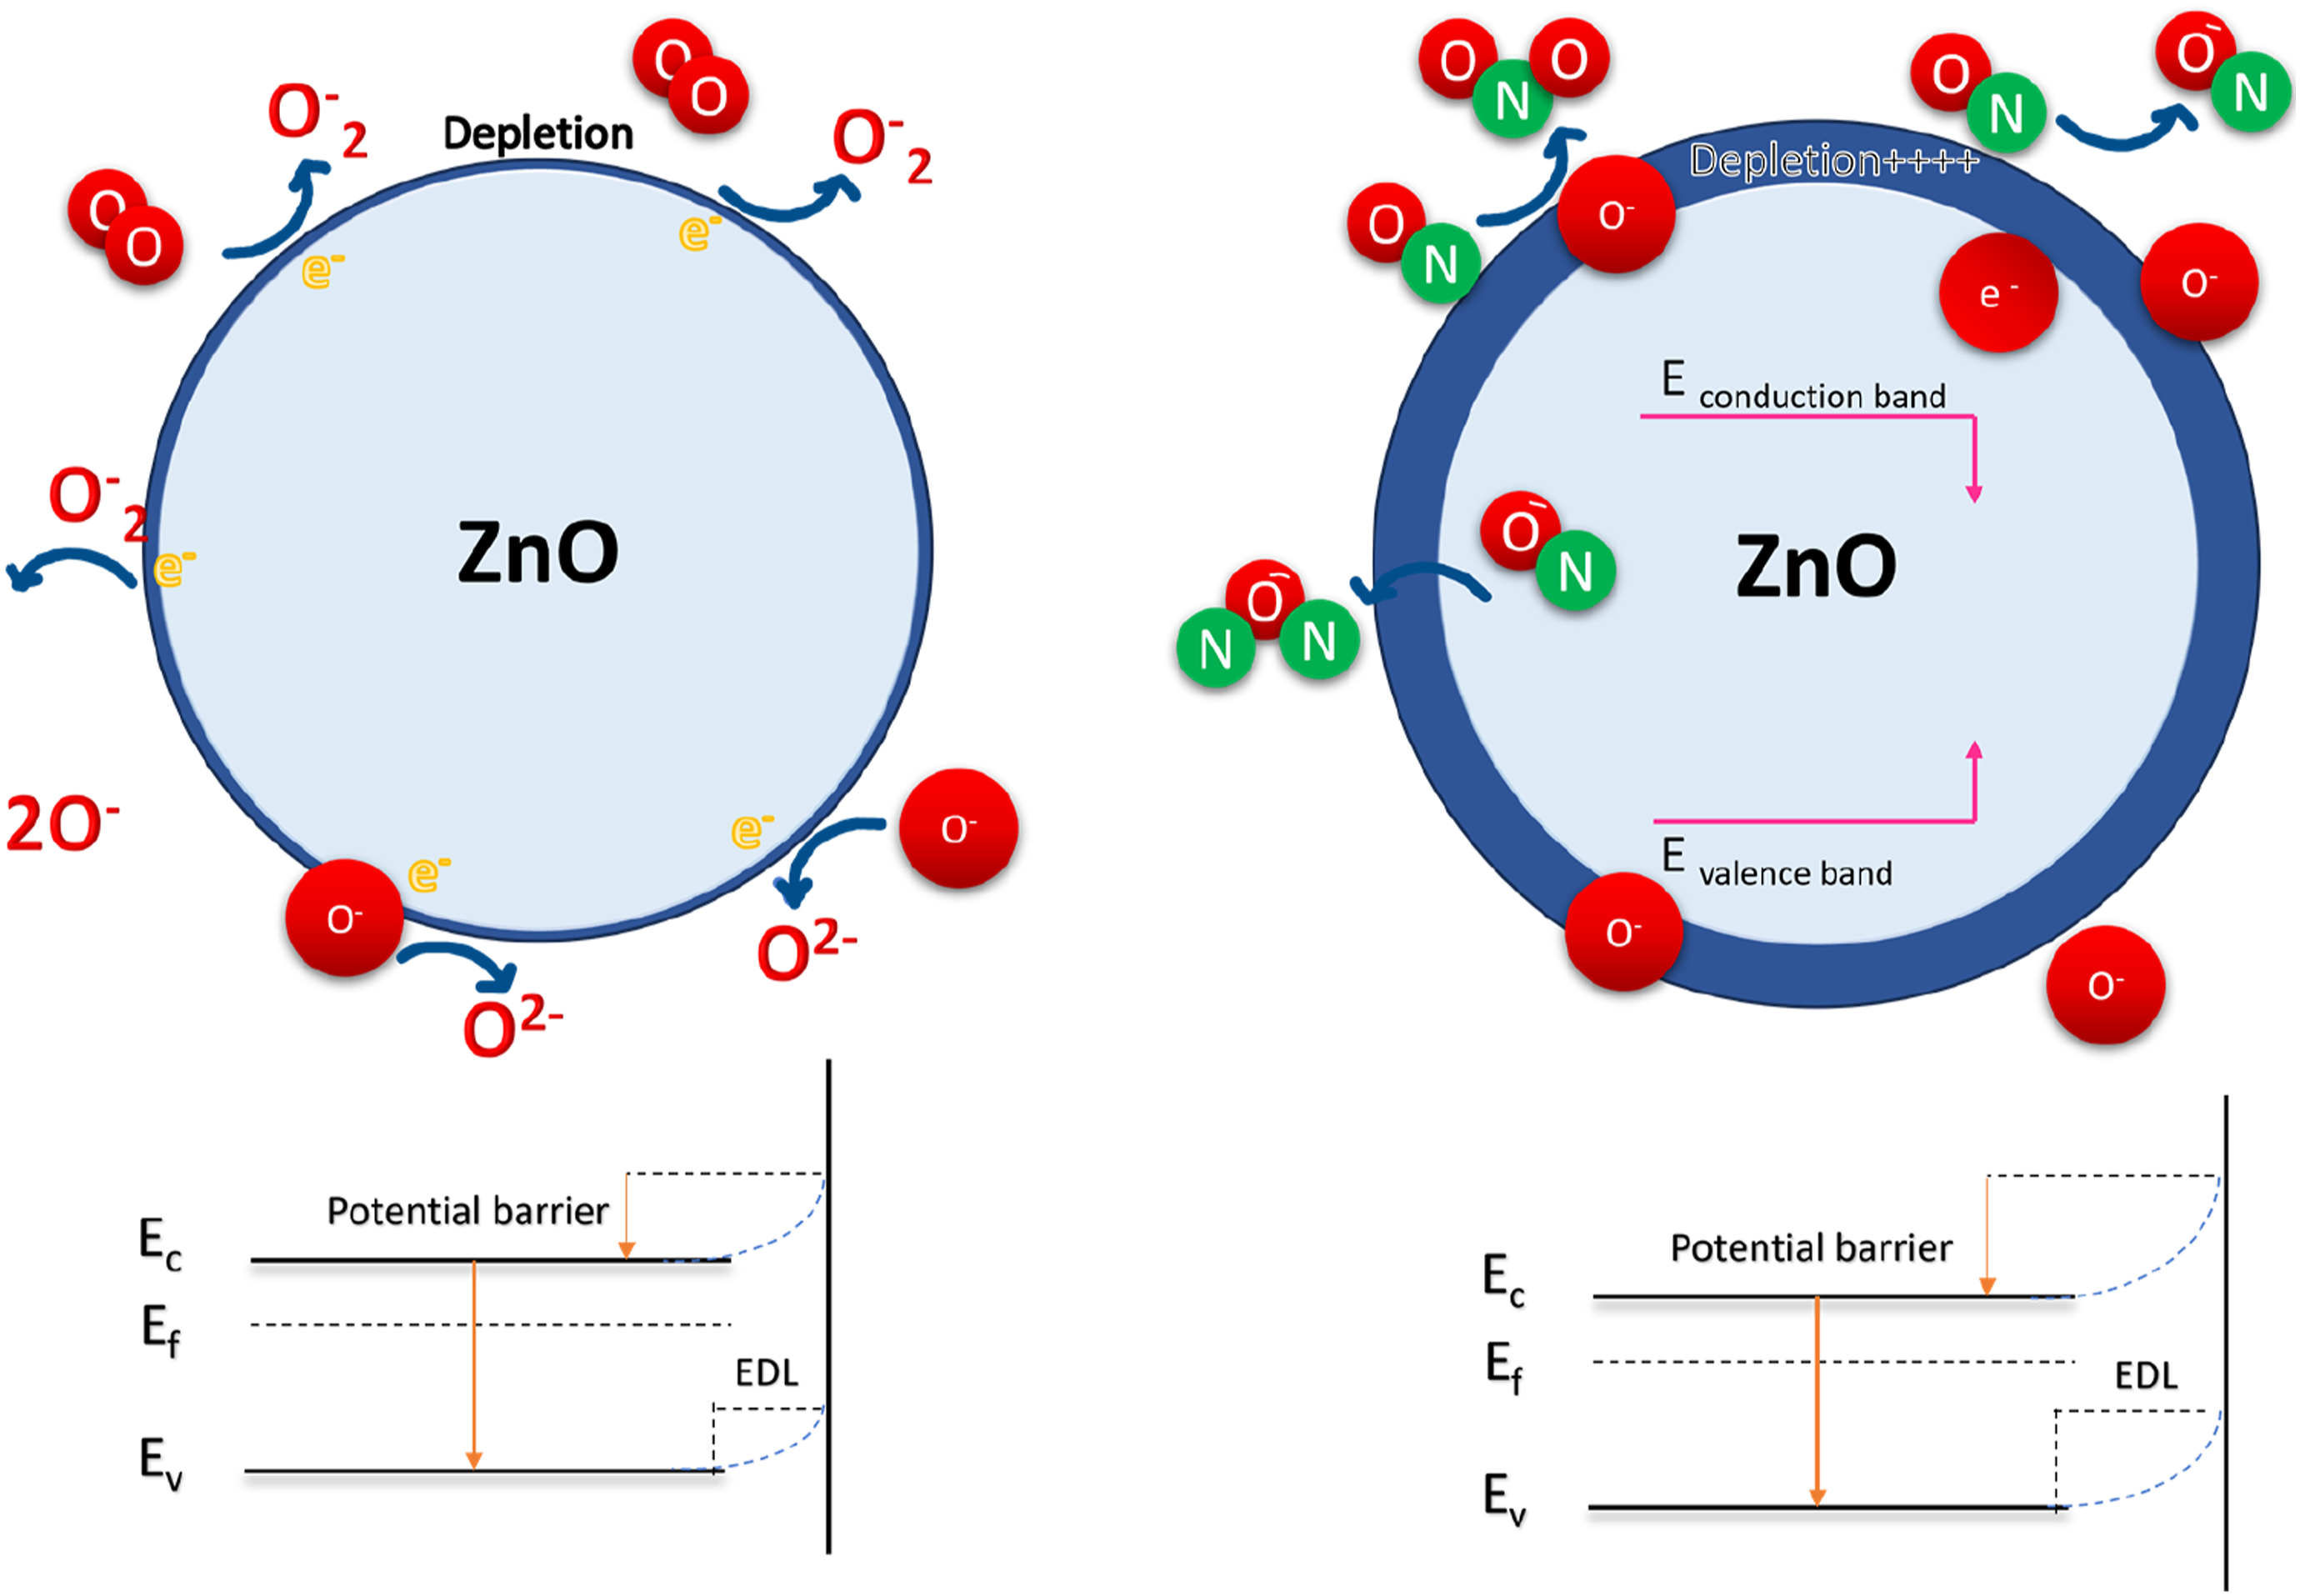
These reactions produce oxygen adsorbates and deplete electrons from the conduction band of the SMO. These four reactions are strongly temperature dependent. 73 O-2 is dominant when the temperature is below 100°C, whereas O− is dominant when it is in the range of 100°C to 300°C. Nonetheless, when the temperature is higher than 300°C, O2- is dominant.
The second step involves the reaction of the target gases with the adsorbed oxygen species. The detection reactions of NO2 within this temperature range may be explained by equations (8) and (9) et (10)).
74


Therefore, resulting in widening of depletion layer at interface in both oxides, that is, increasing the resistance.
72
Once the oxidizing gas NO was introduced into the testing chamber, as in Figure 18, NO molecules will be absorbed on the ZnO surface. Electrons can be extracted from the conduction band of ZnO, leading to the increase of the resistance.
62
The corresponding possible reactions are described as follows:
75


In this study, the gas-sensing properties of the nanofibers are also associated with the existence of nanograins within the polycrystalline ZnO nanofibers. The nanograins further influence the sensor response by affecting the electron flow across grain boundaries, particularly when exposed to oxidizing gases. These nanograins create numerous ZnO/ZnO homo interfaces, and the boundaries between these nanograins act as potential barriers to the flow of electrons. When oxidizing gases like NO2 are introduced, these potential barriers heighten. 76 This increase in barrier height across the grain boundaries within the ZnO nanofibers results in a higher resistance, thereby contributing to the gas response of the sensor. In the present work, the probable reason for the extraordinary response towards NO at 200°C can be due to the fiber-shape of nanoparticles. When nanoparticles are organized next to each other, as electrons jump from one particle to another one and not through the core of ZnO but on the surface, the resistance at the interface of particles is so high, so by introducing the gas on the surface of ZnO layer, they react with the ZnO particles; the resistance is modulated and demonstrates high response. Therefore, not only the space between the nanoparticles can cause more reaction between the molecule of NO and NO2 gases and the surface of ZnO as the surface area is increased. 71 However, the advantages of the fiber shape ZnO improved the sensitivity impressively towards the gases, significantly for NO, as sensing this gas is challenging and not many articles studied NO detection by SMOs at the temperature of 200°C without adding any noble metals and additives.
In summary, the morphology control of the ZnO-1.5 sensor by altering the ZnAc percentage in the precursor is intended to maximize its specific surface area, which plays a pivotal role in enhancing its gas-sensing properties.
Conclusions and perspectives
In conclusion, the ZnO nanofibers were synthesized using varying amounts of ZnAc in the precursor to investigate their capability to detect NO and NO2 gases at different temperatures. The results revealed that the most substantial response was observed in the ZnAc: PVA = 1.5 at the temperature of 200°C. The synthesized ZnO nanofibers showed a significant response towards NO gas at the ppb level at 200°C with a humidity rate of 50%. Additionally, the stability, repeatability, and reproducibility of the designed layer are demonstrated with low response and recovery times, making it a perfect choice for portable sensors, especially for healthcare applications. The heightened response of the gas sensor can be attributed to the formation of ZnO nanoparticles in a fibrous structure, which displayed the most significant change in resistance upon gas exposure. Remarkably, there is currently no available sensor, whether at the laboratory or commercial level, that can sense both gases with equal sensitivity at the operating temperature of 200°C but different sensitivity at 300°C to be more selective to NO2. Exploring adjustments to the nanofiber structure, with the potential to influence the responsiveness of ZnO to gases, holds promise for further investigation. This research may lead to a reduction in the production costs of SMO gas sensors, specifically for detecting NOx. This could be achieved without the need for additional additives, relying solely on the optimization of the nanofiber structure. Therefore, using the developed sensor can pave the way for non-invasive diagnosis of respiratory diseases and also lower the cost of environmental sensing applications.
Footnotes
Declaration of conflicting interests
The author(s) declared no potential conflicts of interest with respect to the research, authorship, and/or publication of this article.
Funding
The author(s) disclosed receipt of the following financial support for the research, authorship, and/or publication of this article: This work is based upon research funded by Iran National Science Foundation (INSF) under project No.4020210.