
Abstract
This study deals with the prediction of the mechanical properties of wool bundle fibers and the characterization of the fracture performance of fiber fracture sound. Acoustic emission detection was used to record the fracture sound of wool fibers. According to the fracture sounds, the tensile properties of the bundle fibers were obtained. Acoustic emission provided a convenient method for obtaining fibers breaking elongation distribution. Based on the fiber bundle model and fiber breaking distribution, the fracture strength and elongation of bundle fibers could be predicted. Meanwhile, based on the correlation between the amplitude of fiber fracture sound and fiber breaking strength, the single fiber breaking strength could be predicted and the tensile properties of bundle fibers could also be obtained. The prediction results based on bundle fiber fracture sound were more similar to the measured results. Besides, the number of fibers within the bundle increased, the fiber interaction was also enhanced, and the bundle fiber strength prediction results were affected. This work was considered to have the potential of being used in the prediction of mechanical properties of natural fiber composites.
Introduction
In recent years, fiber-reinforced composites, especially natural fiber composites, had received sustained attention due to the requirement for sustainable development and environmental friendliness. Natural fiber composites have the characteristics of lower weight, cost, health problems, good mechanical properties, and minimal environmental impacts during manufacturing.1–4 The utilization of natural fiber as reinforcement in a polymer matrix had attracted researchers. However, the properties of fiber adopted in fiber-reinforced composites were distinct from that of the matrix, and the strength of the fiber showed divergence. 5 Therefore, it was very important to evaluate the strength and reliability of fiber and fiber bundle, when mechanical properties of fiber-reinforced composites were discussed.
Mechanical properties of wool bundle fibers
Wool is one of the most common natural protein fibers. It has distinct properties such as softness, durability, and safety. Wool can withstand a lot of wear and tear and has characteristics, such as resisting wrinkles and retaining shape.6,7 In recent years, scientists were focusing on the sound insulation and noise reduction of wool fiber composites,8–11 while there was little literature on the basic and important mechanical properties of wool composite materials.
Bundle fibers are the most common reinforcement matrix form in unidirectional composites. The analysis of the structural characteristics and mechanical properties of the bundle fibers provides a further perspective on the structure and properties of fiber composites. The tensile properties of every single fiber perform an impact on the whole bundle, and these constituent elements jointly determine the mechanical properties of the bundle fiber. Therefore, it is particularly important to analyze the properties of single fibers within the bundle and bridge the relationships between the single fiber and bundle fiber. Most investigations on the correlation between single and bundle fiber rely on a so-called fiber bundle model (FBM), which was first introduced by Peirce. 12 Although FBM is relatively simple, in most cases, the model can capture the static and dynamic characteristics of the failure process.
The classical FBM is assumed to be a bundle with a certain number of filaments, whose ends are fixed and arranged close to each other. When the load or extension is applied to the bundle, all filaments extend with equal length. The breaking load exceeding the minimum strength of all filaments is so-called the breaking strength of the bundle. 13 Generally, the load-elongation curve of the single fiber is assumed to be linear, which means that the strength of the bundle fibers is determined by the product of the average elastic modulus and elongation of each fiber, and the number of fibers within the bundle.14–17 However, the tensile fracture process of bundle fiber is different from that of a single fiber, which is not instantaneous fracture, but gradual fracture. The fracture probability of bundle fibers in the tensile process can be determined by the distribution of the breaking elongation or strength of a single fiber, which is usually assumed to be a Normal 15 or Weibull 18 distribution.
In the past FBM research, the prediction of the breaking strength of bundle fiber counts on two basic conditions, the load-elongation curve of the single fiber is linear and the probability distribution of single fiber strength or elongation is known. However, the assumption that the load increases linearly with the elongation does not accurately describe all fibers, such as wool.19,20 Compared with the linear equation, the nonlinear equation is more effective in fitting the load-elongation curve of fibers, even for cotton and viscose. 21 At the same time, the distribution of the strength and elongation of the single fiber need to be based on a large number of single fiber tensile tests, which is very tedious and time-consuming.22,23 It is a very important task to solve the nonlinear problem of the fiber load-elongation curve and the probability distribution of single fiber strength and elongation in FBM.
Acoustic emission detection of bundle fibers
Acoustic emission (AE) detection is a very powerful detection technology, which can perform real-time monitoring of the destruction process of materials and record the acoustic signal generated by each fracture propagation. 24 Several previous research on AE detection of carbon fiber, 25 glass fiber 26 and aramid fiber-reinforced composite 27 have shown that AE could record the fracture signal of a single fiber in the process of composite material failure. There is a linear correlation between the AE events and the number of fibers. At the same time, the research also proves that the acoustic signal of fiber fracture, matrix, and interface damage can be distinguished by the amplitude and frequency of the signal. 28
Except for composite materials, AE detection was also used on the fiber bundle tensile test. The bundle was usually lubricated with silicone oil to reduce the friction between the fibers during the bundle stretching process. When the fiber bundle is loaded or stretched and gradually breaks, the AE sensor will simultaneously record the single fiber breaking signal. It had shown that the tensile properties of cotton have a relationship with its breaking acoustic signal intensity. 29 Besides, AE detection could detect the breaking signal of every single fiber in the glass fiber bundle30,31 and Kevlar fiber bundle.32,33 The number of AE signals corresponds to the number of fibers in the bundle. The parameter of the probability distribution, such as the Weibull distribution, could also be obtained by the fiber bundle tensile test and AE detection. It has been proven that AE can be used to solve the problem of tedious and time-consuming single-fiber testing and obtain the distribution of strength and elongation of single fiber. 34 It also can be performed to predict the strength and elongation of the single fiber through AE signals.35,36
The main motivation of this study was to propose a new method for predicting and characterizing the mechanical properties of natural fiber assemblies. For this purpose, single and bundle fibers of natural wool were stretched to break under simultaneous AE monitoring. The AE signals of every single fiber fracture within the bundle samples were identified and extracted. The identification results based on different AE signal parameters were compared. Then, the bundle fiber AE signals were used to estimate the parameters of the Weibull distribution function for the fiber breaking probability. The fitted correlation coefficients obtained from the analysis of AE signals were higher than 0.8. The Weibull distribution obtained from the AE signals of bundle fiber samples was combined with the fiber bundle model (FBM) to predict the fracture strength of the bundle fibers. Meanwhile, the breaking strength of every individual fiber was predicted through the bundle fiber AE signals, and the prediction results of the bundle fiber strength were obtained after superposition. Finally, the bundle fiber fracture strengths predicted by theoretical formulas (FBM) and by the AE signals were compared. The novelty of this study is to provide an indirect prediction method for the fracture strength of natural fiber assemblies, which is expected to provide an approach for the design and prediction of mechanical properties of natural fiber composites.
Materials and methods
Materials
In the present study, the wool tops were processed by a domestic wool spinning mill (Tongxiang Xiangxiang Wool Spinning Material Co., Ltd., Zhejiang, China). All wool fiber samples (see Figure 1) measured in this work were sampled from the Australian coarse wool top. Two kinds of fine wool fiber were tested, the 60 s (22 μm/9.72 dtex) and 80 s (18 μm/7.28 dtex). The (a) fiber samples and (b) SEM photo of wool.
Sample preparation
The wool bundle fiber (WBF) samples were formed by a large number of single fibers. As for the bundle, fibers were arranged in parallel along the tensile direction. To avoid any damage to the individual fiber or the bundle fiber before the tensile test, fibers were usually fixed on the paperboards and the paperboards were cut before the tensile tests began, as shown in Figure 2. Two kinds of WBF samples were designed for the bundle tensile test. The wool bundle fiber sample 1 (WBFs1) contained 100 wool single fibers, and the fibers were parallel and straight with almost no friction between the fibers. The wool bundle fiber sample 2 (WBFs2) contained a random number of wool single fibers. The WBFs2 were combed, and the entanglement between fibers was avoided, but there were still tilted fibers and interaction between fibers. The sample preparation for bundle fiber samples (a) the schematic diagram, (b) the bundle fiber sample, and (c) the sample griped on the test machine.
Figure 2(a) shows the schematic diagram of the preparation of the bundle fiber samples. Firstly, a large number of fibers were straight and parallelly glued on the paperboard. Then, the paperboard would be fixed on the clamp of the bundle fiber tester. Finally, the paperboard was cut along the two dash lines and the tensile test would be conducted. Due to the gauge length being set as 10 mm, the width of the window on the pane paper was wider than the gauge length. Figure 2(b) and (c) show the physical figures of WBFs1 and it griped on a bundle fiber tensile tester.
Tensile tests
In this paper, the tensile properties of single and bundle fibers were determined according to the GB/T 4711-1984 single wool strength test codal provisions and GB/T 27629-2011 bundle wool strength test codal provisions. The single fiber and bundle fiber tensile tests were both conducted under the standard conditions of (20 ± 2)°C and (65 ± 3)% relative humidity.
The single fiber tensile tests were conducted on the LLY-06E electronic single fiber tensile tester (Laizhou Electronic Instrument Co., Ltd., Shandong, China), as shown in Figure 3(b). The bundle fiber tensile tests were conducted on InFiberTensor electronic bundle fiber tensile tester (Co-developed by Zhongchen Digital Technology Co., Ltd., Shanghai, China and Donghua University, Shanghai, China), as shown in Figure 3(c). The InFiberTensor bundle fiber tensile tester had a special bundle fiber grip prepared from a hard polymer and a soft metal layer, which could hold the bundle fibers evenly, non-slip and without damage. The natural fiber fracture sound monitoring process (a) the schematic representation, (b) the single fiber AE signal detection tester, (c) the bundle fibers AE signals detection tester.
The gauge lengths of the single and bundle tests were both set to 10 mm to maintain the consistency of the two test environments. The extension rates of the single and bundle tests were 0.2 mm/s for a strain rate of 2%/s. The wool single fiber tensile tests of the 60 s and 80 s were carried out respectively in this work. The wool bundle fiber tensile tests of the 60 s and 80 s were carried out respectively on two types of samples (WBFs1 and WBFs2). After tensile tests, the stress-strain curves could be obtained. The stress (cN/tex) represents the load per tex that the fiber could withstand, and the strain represents the ratio of the fiber elongation to the gauge length.
Acoustic emission test
The parameter of the acoustic emission sensor.

Figure 3(a) shows the basic processes of the fiber AE detection of the single and bundle fiber. After the fibers were fixed on the clips of the tensile tester, the fibers would be stretched to break. The physical tensor could record the load and elongation of the fibers and generate the tensile curve data. In the meantime, the acoustic sensor could record the breaking signal when the fibers were fractured and transfer the analog signal to the digital signal which could be calculated by the processor. In this method, the tensile properties and breaking acoustic signals of the fibers could be obtained through only one-time tensile test. The single and bundle fiber tensile testers and AE detection were shown in Figure 3(b) and (c).
The bundle fiber fracture stress prediction
Prediction by fiber bundle model (FBM)
The strength and elongation curve of bundle fibers reflects the overall mechanical properties of a large number of single fiber assemblies. In the past, many scholars had conducted research on this issue, the model proposed by Peirce
12
was the most classic,
According to the FBM equation (1), the strength and elongation curve of the bundle fibers could be predicted on the premise that the distribution of the breaking elongation of a single fiber was known. However, Peirce's model was established based on rigid fibers. Wools were flexible fibers and its Young's modulus changed during the stretching process. Therefore, Yu
37
proposed an FBM mode for flexible fibers, where Young’s modulus Schematic representation of (a) the Yield’s modulus, and (b) the bundle fibers stress-strain curve predicted by equation (5).

The distribution of breaking elongation of wool fibers was usually considered to follow the Weibull distribution. Chi
38
proposed the method for estimating Weibull distribution parameters through the bundle fiber stress-strain curve. However, this method was only applicable to the fibers that follow Hook's law. Therefore, Cowking
30
proposed to estimate Weibull distribution parameters by counting AE signals during fiber bundle fracture (see equations (3) and (4)).

Based on the AE detection signals, the fracture condition of flexible bundle fibers during stretching could be accurately obtained. The total number of fibers within the bundle and the variation in the number of broken fibers could be analyzed by the bundle fiber AE signals. Therefore, the shape and scale parameters of the Weibull distribution function could be accurately estimated.
When the Yield’s modulus and Weibull distribution parameters of the bundle fiber were obtained, the stress-strain curve
Prediction by acoustic emission test (AE)
Although the bundle fiber breaking strength could be predicted by FBM and Weibull functions. It was based on the assumption that the fiber breaking probability followed the Weibull distribution. If not, it led to bias in the prediction results. In addition, there were many types of textile fibers, and it was difficult to verify the distribution function before predicting the breaking strength of the bundle fibers. Therefore, this study proposed a new method to predict the tensile curve of every single fiber within the bundle to obtain the overall mechanical properties of the bundle. The flow chart of the new prediction method was shown in Figure 5. The flow chart of the bundle fiber tensile curve predicted by AE signal.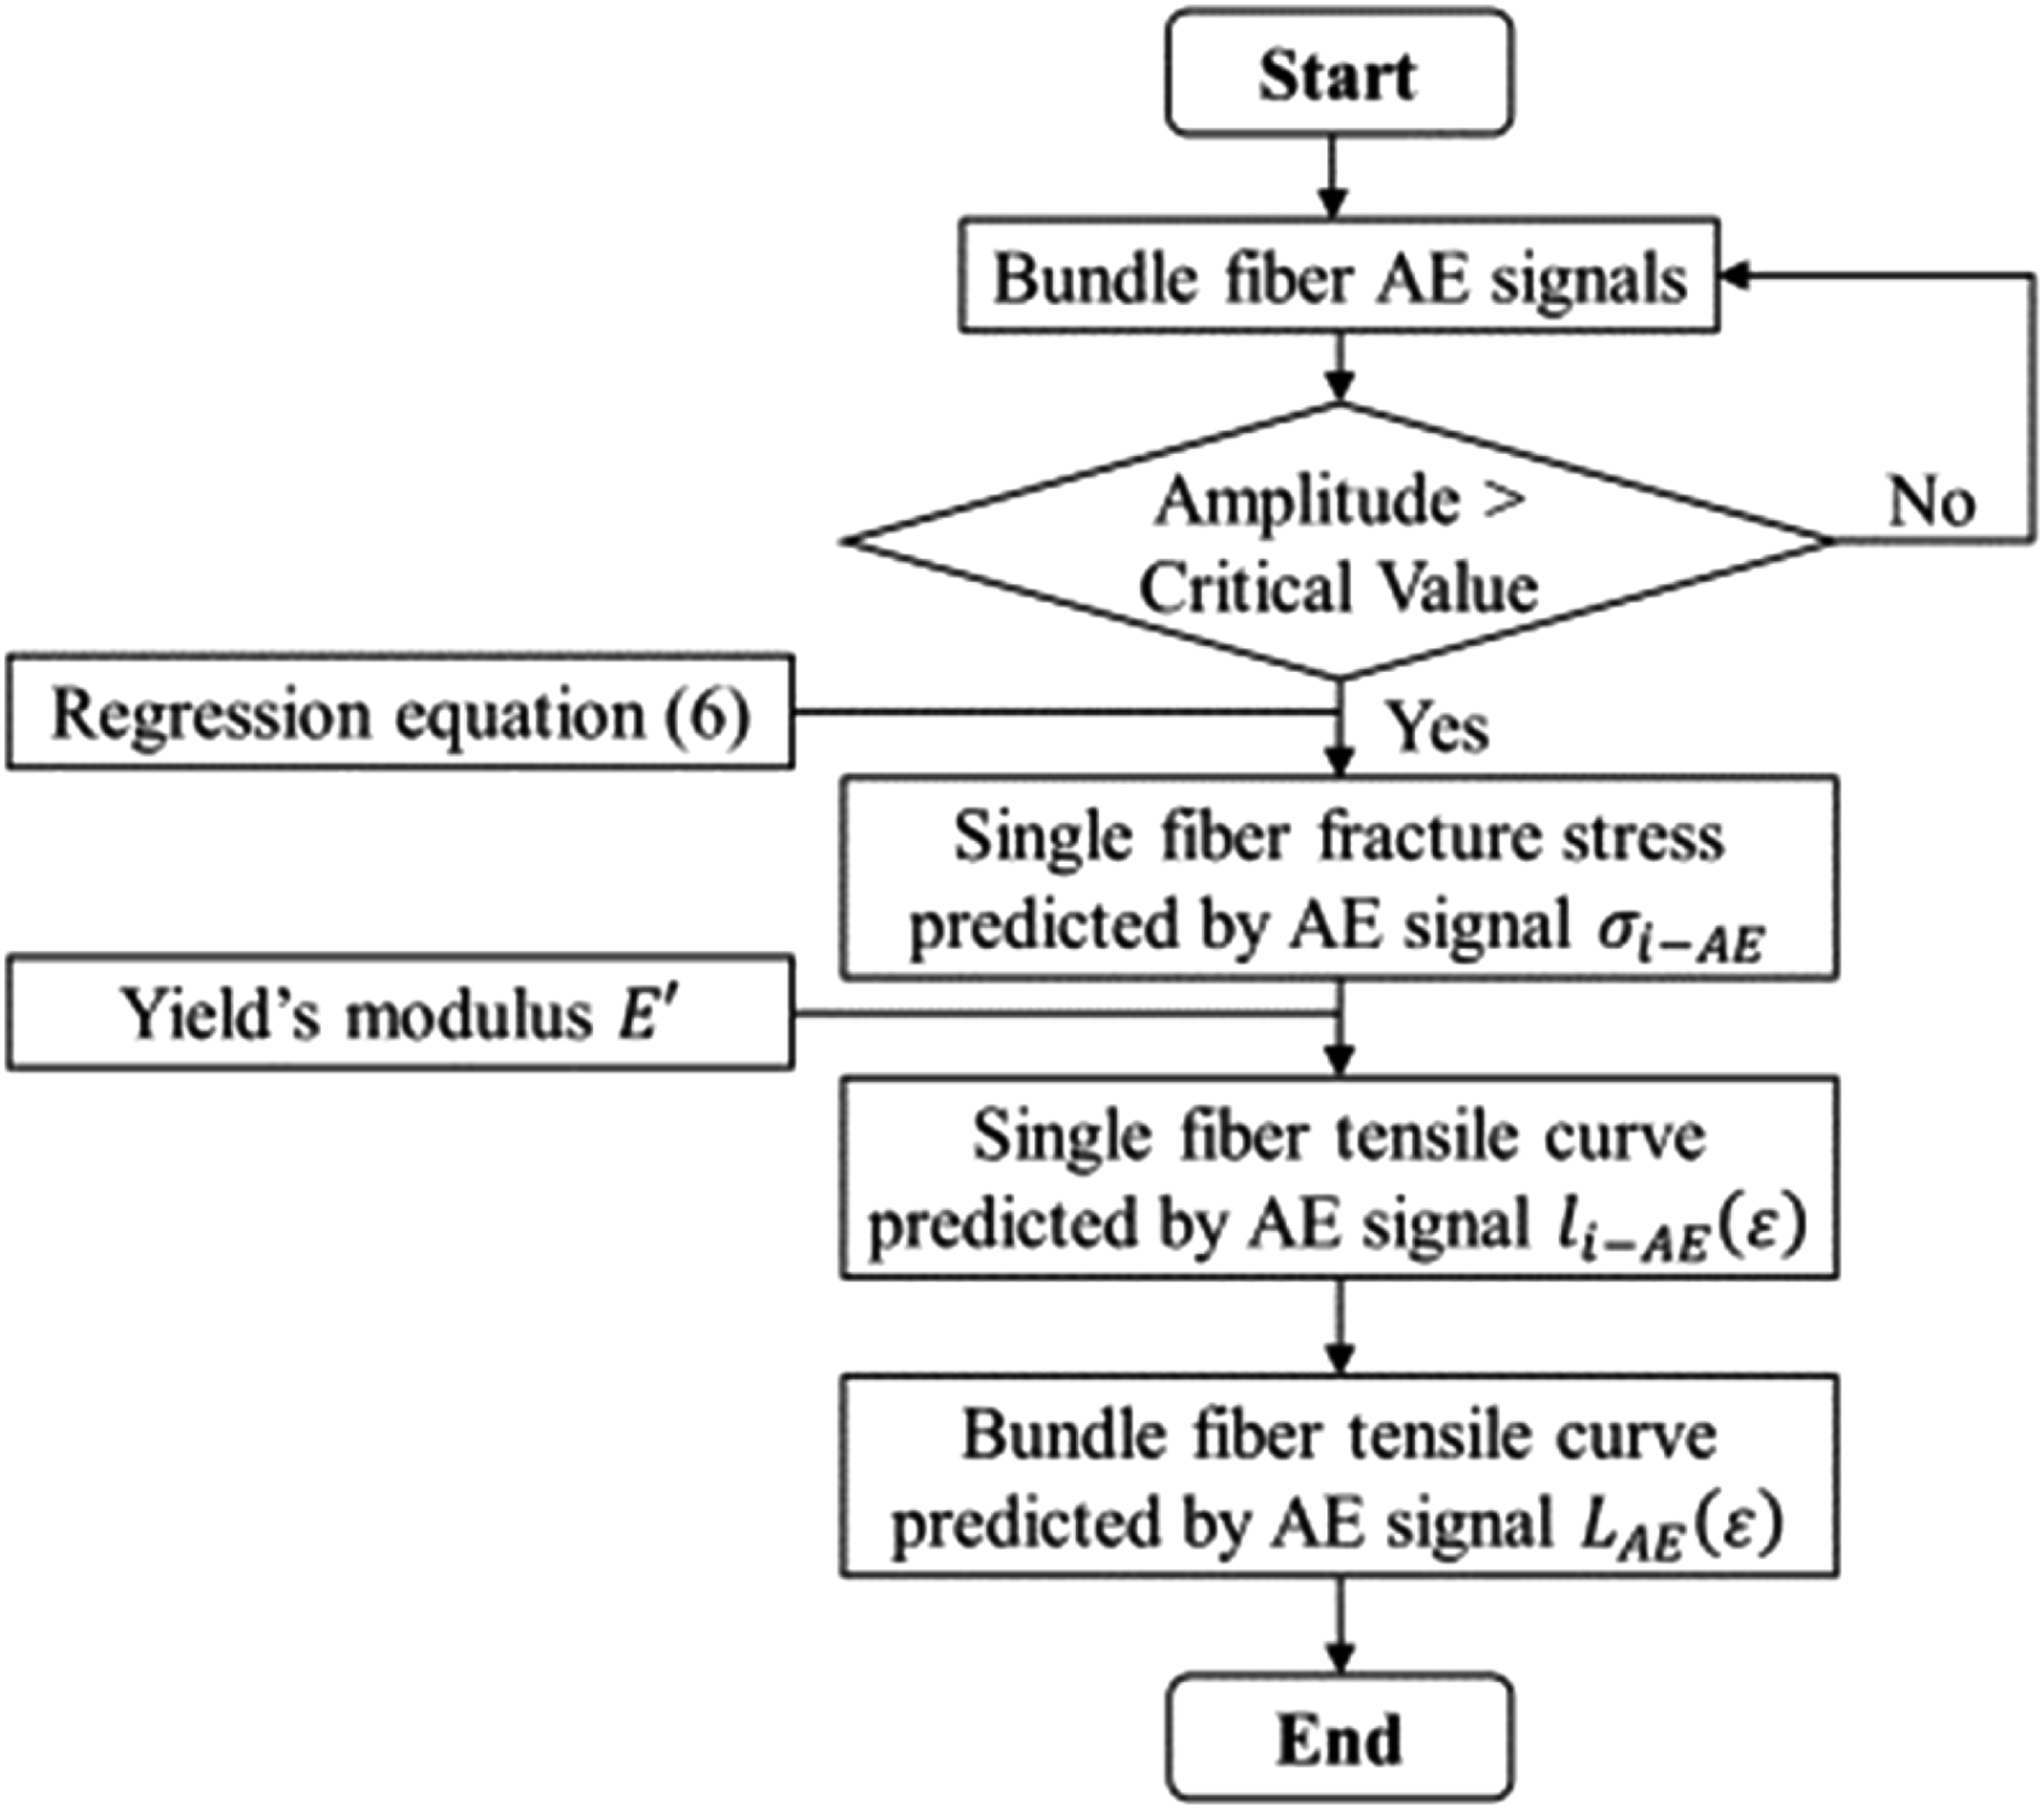
Firstly, the correlation was established between the wool fracture strength and fiber AE signal parameters. The analysis process was shown in Figure 11. Based on the correlation, the breaking stress 
The straight line connecting the (0,0) point and ( Schematic representation of (a) the single fiber stress and strain predicted by AE signals, and (b) the bundle fiber stress-strain curve predicted by the AE signals and equation (9).


Finally, the predicted tensile curve 
The deviation between the peak posterior region of the predicted and the measured curve was relatively small by the prediction method proposed in this paper. The main differences were in the elastic region of the tensile curves. Since wool was a flexible fiber and its stress-strain curve was nonlinear. The changes in wool modulus are hard to predict. The modulus of wool in the yield region was mainly analyzed in this paper, which lead to a large deviation in the prediction of the tensile curve in the linear elastic region. Besides, the results of the fitted yield curves and the errors in the prediction of fiber strength based on AE were ultimately reflected in the deviations of the yield region and the breaking strength of the bundle fiber prediction curves.
Results and discussion
The bundle fiber acoustic emission signal
The tensile test and AE detection results of the WBF samples were shown in Figure 7. The red curve indicated the tensile curve of the wool bundle fibers, and the blue curve indicated the time-domain waveform of the bundle fiber acoustic signal. The stress-strain curve and AE signal of WBF samples were recorded simultaneously during the test. The strain was twice the time because the extension of the bundle tester was set to a strain rate of 2%/s. The tensile curve and AE signals of the bundle fibers sample.
Figure 7 shows that the tensile test of wool bundle fibers could usually be divided into three stages. The first stage (a) was the elastic region. The fiber bundles had a relatively high modulus and the change of the tensile curve followed the linear elastic trend. Almost no acoustic signals were recorded, which meant that there was almost no fiber breakage during this stage. The second stage (b) was the yield region. The modulus of the fiber bundles in this region was lower and the tensile curve reached a plane. An increasing number of fiber acoustic signals were recorded in this region, which meant the wool within the bundle fibers started to break. The third stage (c) was the fracture region. The tensile curve of the fiber bundles reached a peak and then rapidly dropped to zero. In this stage, numbers of fibers were broken and many acoustic signals were generated at the same time.
With bundle fiber AE detection, a large number of wool single fibers are stretched to break during one-time tensile test, while a lot of fiber acoustic signals are also recorded. However, during the stretching process, the acoustic sensor might also record the background noise and instrument noise in the test environment. Therefore, it was necessary to separate the noise signal before obtaining the AE signals of single fibers within the bundle fiber AE signal. According to Figure 8, fiber AE signals are instantaneous pulse signals and have energy and amplitude. Noise signals usually belong to high-frequency signals with low amplitude.
34
Therefore, in this paper, the minimum value of the characteristic parameters of fiber AE signals was used as a critical indicator to distinguish noises from single fiber AE signals. The histogram of signal parameters obatained from bundle fibers samples AE testing (a)/(d) energy, (b)/(e) amplitude, (c)/(f) rectified mean value.
Figure 8(a)–(c) show the histograms of the distribution of energy, amplitude, and rectified mean value of 102 acoustic pulse signals obtained from the AE signal of WBFs1. The amount of AE detection signals of WBFs1 was close to the designed number of fibers (100). The acoustic signal parameters didn’t conform to a normal distribution, but a skewed unimodal distribution. According to the statistical indicators of the characteristic parameters of AE signals, it could be seen that the maximum values of the energy, amplitude, and the rectified mean value of WBFs1 were 197 mVms, 1902 mV, and 85 mV respectively; The minimum values were 0.11 mVms, 153 mV and 3.1 mV respectively.
Figure 8(d)–(f) show the distribution histograms of energy, amplitude, and rectified mean value of 347 acoustic pulse signals obtained from the WBFs2 AE signal. The amount of AE detection signals of WBFs2 was very different from the actual number of fibers (273). Compared with WBFs1, the histogram distribution of WBFs2 (Figure 8(d)–(f)) exhibited a significant bimodal distribution feature. In addition to the peak corresponding to the histogram of WBFs1, a rather high column (red solid frame) appeared on the left side of the histogram. This was not available in the histogram of WBFs1 (red dashed frame). According to the statistics, the distribution histogram of WBFs2 had both the peak of the fiber AE signals distribution (the second peak) and the noise distribution (the first peak). The maximum values of WBFs2 were 189 mVms, 1906 mV, 88 mV and the minimum values were 0.05 mVms, 32 mV, 3.01 mV. The maximum values of various acoustic signal parameters were similar for WBFs1 and WBFs2, but the minimum values of acoustic parameters were lower for WBFs2 than for WBFs1. Through acoustic signal analysis, it could be inferred that there were noisy signals in the histogram of WBFs2, resulting in lower values of statistical indicators.
The number of fibers discriminated by AE signal amplitude and the error rate of 60 s wool bundle fiber samples.

The number of fibers discriminated by AE signal amplitude and the error rate of 80 s wool bundle fiber samples.

As seen in Tables 2 and 3, the discrimination error rate of WBFs1 for the 60 s and 80 s wool based on critical values of AE signal parameters were 3.6% and 6.4%. They were both lower than that of WBFs2 (8.2% and 7.2%). This was because the fibers within WBFs1 were arranged parallel and straight. There is no interaction between the fibers and the friction noises were weak. It made the differentiation of fiber AE signals easier. However, the noises in the WBFs2 AE signals increased due to the presence of inter-fiber friction. The difficulty of identification based on the critical values of AE signal parameters increases, leading to an increased discriminate error rate.
The discrimination error rates were the largest with energy as a critical value, proving that the energy of wool AE signals was close to that of the inter-fiber friction noises. It had shown that the energy parameter was not suitable as a threshold value for distinguishing AE signals from noises. The discrimination error rates of WBFs1 based on signal amplitude and rectified mean values were relatively low (2.4% and 1.6% for 60 s, 4.0%, and 4.25% for 80 s). The fiber fracture sound was the transient pulse signal, while the noise was a lower amplitude signal. Therefore, the discriminative effect of amplitude type characteristic parameters was better. Besides, the overall discrimination error of the amplitude parameters was lower for frictionless (WBFs1) than frictional (WBFs2) samples. Therefore, in this study, the minimum value of the amplitude was utilized as a discriminator between fiber AE signals and noises.
Moreover, the discrimination error rate of WBFs1 for the 60 s wool (2.4%) was lower than that of WBFs1 for the 80 s (4.0%), while the discrimination error rate of WBFs2 for the 60 s (6.8%) was higher than that of WBFs2 for the 80 s (4.6%). It was caused by the higher fracture strength of the 60 s and the lower fracture strength of the 80 s. The higher strength generated a stronger AE signal and made the signal of 60 s easier to identify. However, when there was friction between fibers, more friction noise would be generated in the 60 s samples and less in the 80 s samples, due to the scales on the fiber surface and larger friction coefficient, resulting in a lower discrimination error rate.
The bundle fiber fracture stress predicted by FBM
After identification by the critical value (minimum value) of the signal parameter, the AE signals of every fiber within the bundle could be obtained, and also the time of fiber fracture. The breaking elongation of every fiber could be calculated by multiplying the fracture time and the instrument extension rate. AE is an effective detection technique. The breaking elongations of a large number of single fibers were obtained by bundle fibers AE signal analysis. More notably, by using this method, the Weibull distribution parameter of the fiber elongation could be obtained by using equation (4), as shown in Figure 9. The statistical results of fiber breaking elongation and Weibull distribution parameters obtained from bundle fiber AE signals were shown in Table 4. The Weibull plots of fiber breaking elongation obtained after AE signal identification from (a) 60 s WBFs1, (b) 60 s WBFs2, (c) 80 s WBFs1, (d) 80 s WBFs2. The statistical indicators and Weibull parameters of fiber strain. x0: the Weibull distribution scale parameter, m: the Weibull distribution shape parameter.
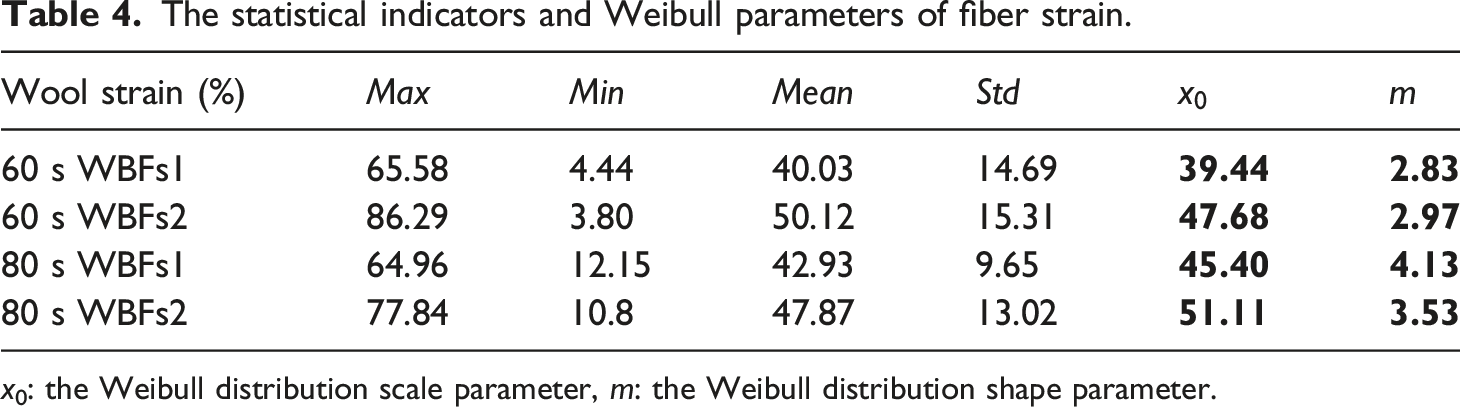
Figure 9 depicts the results of the Weibull distribution parameter estimation of the breaking elongation obtained from the AE signal of the bundle fiber samples after signal identification. It could be found that the correlation coefficients
As seen in Table 4, on the one hand, the Weibull distribution scale parameters
The maximum braking elongation of WBFs1 for the 60 s and 80 s were 65.58% and 64.96% respectively; the minimum values were 4.44% and 12.15%. The maximum of WBFs2 for the 60 s and 80 s were 86.29% and 77.84% respectively; the minimum values were 3.80% and 10.8%. It indicated that the fiber elongation of the fiber increased with the friction between the fibers. Similarly, the mean values of fiber elongation obtained from frictionless (WBFs1) and frictional (WBFs2) bundle samples were different. However, the standard deviations (14.69 for 60 s WBFs1,15.31 for 60 s WBFs2, 9.65 for 80 s WBFs1, 13.02 for 80 s WBFs2) were similar. This indicates that the elongation distribution of the fibers shifts to the right, but the variance changes little.
The breaking strength and elongation of natural fibers were very important performance indicators. Its distributions were time-consuming to be obtained (at least 200 single fibers testing). However, the AE test provided a convenient method to obtain distribution. Then, the breaking strength of the bundle fibers was predicted by equation (5), as shown in Figure 10. The black dotted line in the figure indicates the measured bundle fiber tensile curve, and the blue dotted line indicates the predicted curve obtained by equation (5). The green dotted line indicates the variation of deviation between the predicted and the measured results, and the red solid line indicates the theoretical strength of the bundle fiber. The predicted results of bundle fiber breaking strength were shown in Tables 5 and 6. The stress-strain curves of bundle fiber samples measured and predicted by FBM (a) 60 s WBFs1, (b) 60 s WBFs2, (c) 80 s WBFs1, (d) 80 s WBFs2. The fracture stress predicted by FBM and the deviation from the measured data for 60 s wool bundle fibers samples. The fracture stress predicted by FBM and the deviation from the measured data for 80 s wool bundle fibers samples

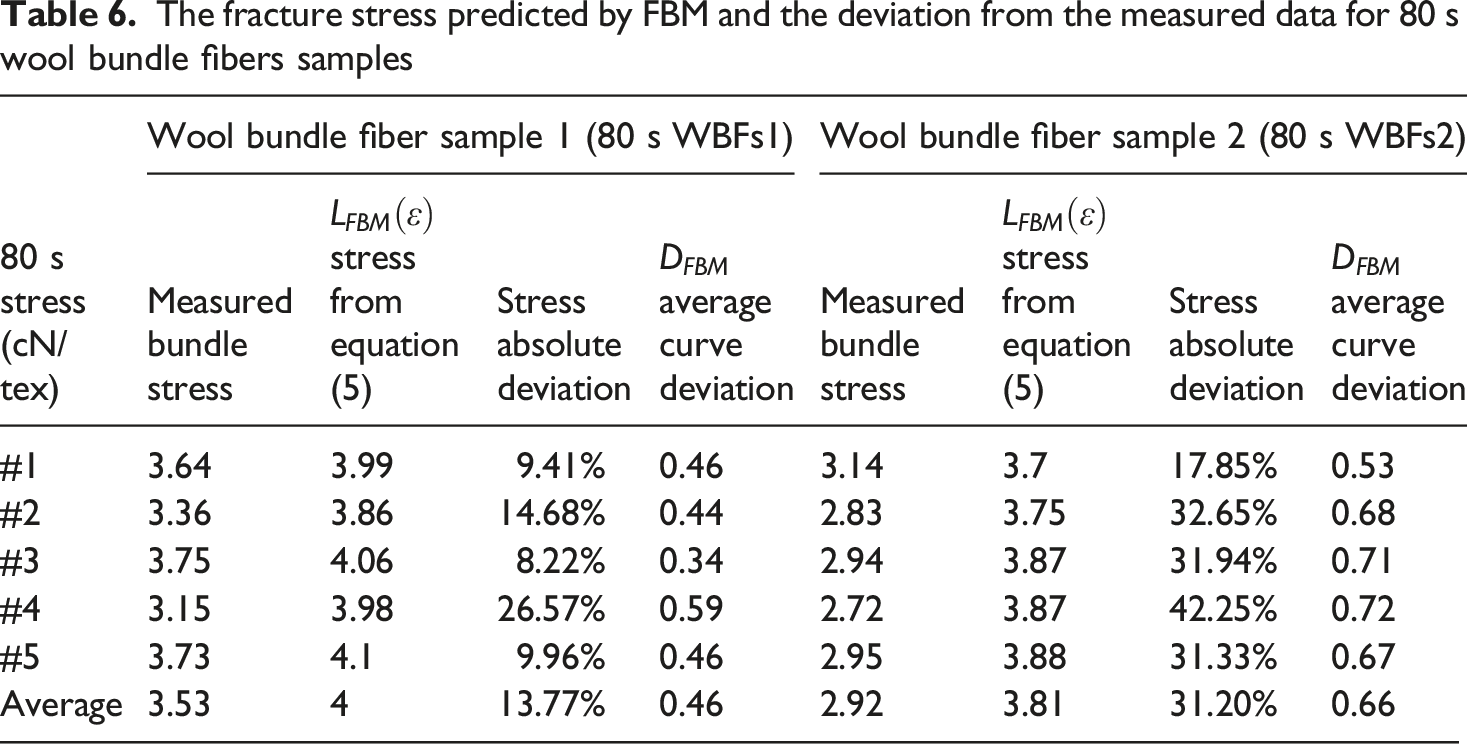
Figure 10 depicts that the bundle tensile curve predicted by equation (5) was close to the measured curve, especially the decreasing trend after the peak. It indicated that the distribution of fiber elongation obtained from the AE signal of the bundle fibers was consistent with the actual variation of the bundle fiber failure probability. However, there was a significant difference between the predicted and the measured curve before the peak. Because only the classical Yield’s curve
As seen in Tables 5 and 6, the predicted breaking strength of bundle fibers for 60 s WBFs1 was 6.54 cN/tex, which differed from the measured result of 6.34 cN/tex by 5.2%, and the average deviation between the predicted and measured stress-strain curves was 0.68. The predicted value for 60 s WBFs2 was 6.63 cN/tex, the deviation from the measured value was 21.92%, and the average deviation of curves was 1.23. For 80 s WBFs1, the deviation between the strengths was 13.77%, and the average deviation of curves was 0.46. For 80 s WBFs2, the deviation between the strengths was 31.20%, and the average deviation of the curves was 0.66. The predicted deviations of the bundle fiber breaking strengths and stress-strain curves of WBFs1 were always lower than that of WBFs2 due to the absence of inter-fiber interactions.
Besides, the deviation of the predicted bundle strengths of the 80 s bundle fiber samples was higher than that of the 60 s. It was due to the weaker breaking strength of the 80 s wool. When the number of fibers within the bundle fiber sample was small, the overall strength of the bundle fiber was lower. Even small prediction errors would lead to large deviations in fracture strength. The large fluctuation in the predicted strength deviations of 80 s WBFs1 supported this observation.
The bundle fiber fracture stress predicted by AE signals
According to the analysis of the time-domain waveform of the wool acoustic signal, several signal parameters could be extracted, such as the energy, the amplitude, and the rectified mean value. The breaking strain and stress of every single wool fiber could also be obtained. The breaking strain was found to be independent of the other signal parameters. Therefore, the correlation between the breaking stress and signal parameters (energy, amplitude, and rectified mean value) was mainly discussed in this paper. The scatter diagrams between the fiber stress and signal parameters (energy, amplitude, rectified mean value) of the 60 s and 80 s wool were shown in Figure 11. The correlation coefficients between fiber stress and signal energy, amplitude, and rectified mean value (a) 60 s wool, (b) 80 s wool.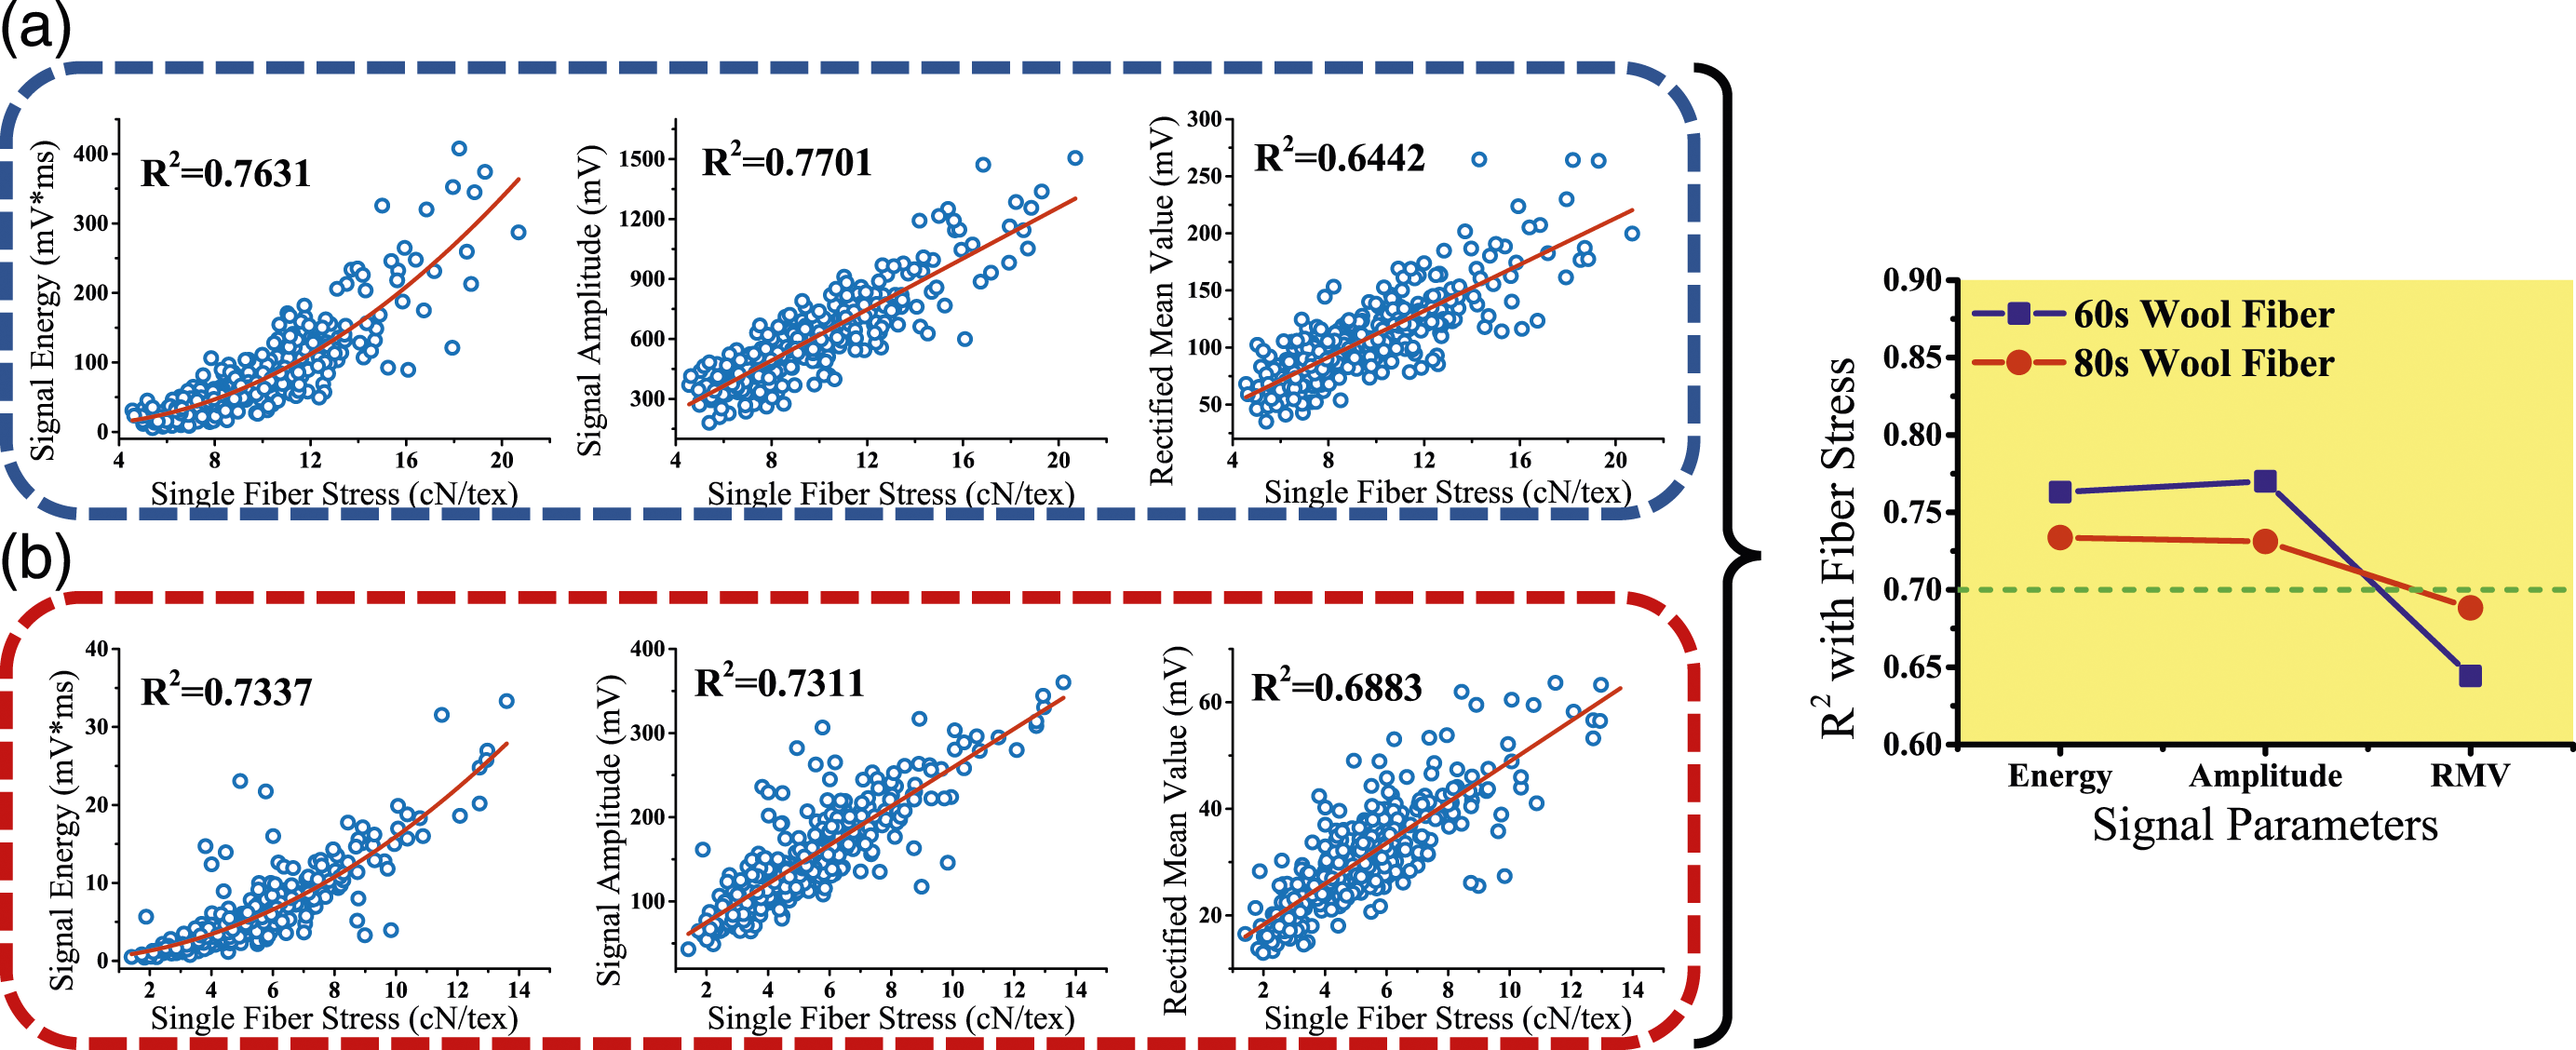
The regression results between fiber stress and signal amplitude.

The statistical indicators of fiber stress predicted by AE signals.

Through regression analysis, the coefficients and constants of equation (6) could be determined. Therefore, the fracture strength of the individual wool fiber could be predicted by the regression equation and the fiber fracture AE signal amplitude. As seen in Table 8, the average predicted stresses of 60 s wool were 9.38 cN/tex and 8.01 cN/tex, and the average predicted stresses of 80 s wool were 5.07 cN/tex and 4.87 cN/tex. The predicted results of 60 s wool were higher than that of 80 s wool because the AE signal energies released from 60 s wool fracture were stronger. The kurtosis values of the wool stress were higher than 3, and the skewness values were above 1. It indicated that the distribution of the wool stress was skewed with a concentrated distribution. It was consistent with the distribution of the measured wool fiber stress.
Then, the tensile curves The stress-strain curves of bundle fiber samples measured and predicted by AE signals (a) 60 s WBFs1, (b) 60 s WBFs2, (c) 80 s WBFs1, (d) 80 s WBFs2. The fracture stress predicted by AE signals and the deviation from the measured data for 60 s wool bundle fibers samples. The fracture stress predicted by AE signals and the deviation from the measured data for 80 s wool bundle fibers samples.


Figure 12 depicts that the predicted stress-strain curve of the bundle fiber was similar to the measured results. It was worth mentioning that the decreasing trend of the tail of the predicted curve was in full agreement with the measured curve. Meanwhile, the deviation between the predicted and measured curves fluctuated minimally, especially in the post-peak range. The deviations between the AE-predicted bundle fiber tensile curve and the measured curve were small. However, the deviation of the curve before the peak was relatively large due to the inability to restore the initial part of the tensile curve of the flexible wool.
As seen in Tables 9 and 10, the maximum absolute deviation of all bundle fiber samples strengths was 9.74% and the minimum value was 0.83%, which were kept within 10%. Besides, the maximum average deviation between the predicted and the measured curve was 0.7, and the minimum value was 0.16, which were kept within 1. The AE-predicted bundle fibers fracture strengths
The predicted deviation of bundle fiber strength was 4.22% for 60 s WBFs1 and 6.12% for 60 s WBFs2. The prediction deviation was 5.69% for 80 s WBFs1 and 5.10% for 80 s WBFs2. Friction effects had little effect on the AE predicted results
Conclusions
In this work, the fracture strengths of natural wool bundle fibers (frictionless/frictional) predicted by FBM and AE signals were analyzed. • The AE signals of individual fibers within a bundle could be distinguished by signal parameters, which allowed the total number of fibers to be obtained by AE quickly. • The energy and amplitude of fiber AE signals were higher when fibers had a stronger mechanical property. Meanwhile, the breakages of individual fibers within the bundle samples were easier to identify and the total number of fibers was identified with an accuracy higher than 90%. • The Weibull distribution parameters of fiber breaking elongation could be quickly obtained by the bundle fiber AE signals. The fitted correlation coefficients of the Weibull distribution were above 90%, indicating that the breaking elongation of wool followed the Weibull distribution. • When inter-fiber friction was presented between fibers, the fiber stretching process was generally straightened first and then elongated. This resulted in higher elongation of individual fibers obtained by AE signals. The tilting and mutual friction usually led to an increase in the mean value of fiber elongation, but had a litter effect on the variance. • The FBM was used for the prediction of bundle fiber breaking strength and stress-strain curves. It was usually applied to bundle samples with a small number of fibers. When the number of fibers increased, the increased inter-fiber friction would lead to an increase in the deviation between the predicted and measured results. • The AE signals reflected only the intensity of the potential energy released at fiber fracture, and it was not influenced by the interaction between fibers. The bundle fiber breaking strength and stress-strain curves predicted by AE signals were more accurate, with an accuracy of more than 94%.
Footnotes
Declaration of conflicting interests
The author(s) declared no potential conflicts of interest with respect to the research, authorship, and/or publication of this article.
Funding
The author(s) disclosed receipt of the following financial support for the research, authorship, and/or publication of this article: This work was supported by the Science Foundation of Zhejiang Sci-Tech University (ZSTU) under Grant No.22202156-Y.