
Abstract
In this paper, low-velocity impact resistance for composite laminates is introduced. The resistance function for the parameters of low-velocity impact performs 2-order Taylor’s series expansion. The orthogonal design and Latin hypercube design are presented and their strongpoint and shortcoming are also indicated. The low-velocity impact simulation model of the composite plate is established. The computed results are compared with the existing standard test from ASTM D7136M-05 and the simulation parameters of the model are modified. By calculating and analyzing typical honeycomb sandwich models with different configurations, the damage-area resistance is extracted from the results. The discrete and abstract variables are treated as continuous integer variables to fit the resistance formula of the composite material. Response surface approximation is used to form a hyper surface formula for parameters. The sensitivity analysis of it reveals that the two most influential factors, related to the resistance definition, which is convenient for the subsequent structural design of the composites. In contrast to the previously defined Taylor’s series expansion, the initial coefficients of the resistance formula are obtained. The resistance hyper surface function obtained from the simulation data is used to design the 7-point low-speed impact tests using Latin hypercube design, which employed to verify and validate the simulations, for purposes of saving on the cost of testing and improving the accuracy of analysis.
Keywords
Introduction
During an aircraft’s service period, the composite laminate is likely to encounter multiple types of external impact events such as hail, bird impacts, tool drop, and so on. The high speed or high energy event represented by a bird impact will generally affect a large area and cause significant damage to the surface of the composite structure. It may even directly penetrate the structure. This kind of damage is usually very obvious, so repairs are made in a timely manner. Composite structures are far less likely to show obvious impact marks from low-energy or low-speed impacts such as the droppage of maintenance tools or the impact of airborne debris during takeoff and landing.1–4 Although the impact energy in these cases is very small (only a few joules),5,6 low-speed impact damage such as interlamination can still occur in the impacted area due to composites’ weak interlaminar performance.
This kind of hidden interlamination cannot be directly recognized from the surface, but its existence will seriously weaken the in-plane bearing capacity of composite laminates. This can lead to fatal safety defects. Researchers have long been concerned about how to evaluate low-speed impact damage and its effect on composites’ structural integrity and carrying capacity. At the same time, they have placed great importance on improving composite structures’ impact resistance. The goal is to reduce shock damage and reduce or negate negative effects that such impact events have on the structure’s integrity and load-bearing capacity.7,8
In the last century, some researchers have pointed out that the impact resistance of composites includes both damage resistance and damage tolerance, so the structural integrity of composite aircraft also includes these two aspects. The study on impact resistance in composite laminates falls under the umbrella category of composites’ damage resistance.9–11 Generally, damage resistance is defined as the relationship between the force, energy, or other event parameters and the size and type of resulting damage in the structure and structural materials. There are three methods to measure the damage size; researchers may define it by the damage area, the damage width, and/or the dent depth. For the purposes of this research paper, the damage resistance of carbon/epoxy resin composite laminates will be expressed in terms of the damage area.
Currently, the drop-weight test is the main impact test system used to study impact-related mechanical properties of materials. Compared with others, the drop-weight impact test system is safe, reliable, and costs relatively little. The working principle behind a drop-weight test is thus: a hammer with known properties is allowed to free-fall onto a test article. Its gravitational kinetic energy is known and the imparted impact energy can be calculated after observing how high it bounces off the test article’s surface. Some variations of the method allow for the hammer body to operate under pre-tension conditions such that the velocity at impact is known. Observations from the drop-weight test allow researchers to ascertain a material’s impact resistance. This style of test is advantageous in that the test results of low-speed impact are quick, clear, and simple to determine.
There are many types of composite structures, so plates of the same thickness can offer varied properties depending on the order and angle of layering within their structure. Furthermore, hybrid composite structures such as honeycomb sandwich panels, 12 foam sandwich panels, 13 and fiber-metal laminates generate even more variables. In order to test a variety of composite properties, it is necessary to arrange the test matrix.
Experimental design is an important branch of statistical mathematics. It studies how to arrange an experimental scheme, sensibly distribute test samples, reduce the influence of testing errors, and make the test results available for reasonable statistical analysis. Since computational time and resources are limited, it is not often feasible to carry out large numbers of physical tests to optimize engineering designs. The orthogonal test design method that is arranged using a normalized table is one of the more common methods. The test is set up according to the orthogonal table 14 from which are selected a small number of representative test conditions that all fall within the scope of investigation. The experimental matrix is thus very large and drives experimental costs up quickly. In order to improve the efficiency of the optimized test design method and take into account the performance of test samples, a Latin hypercube design method has been adopted in this paper. The Latin hypercube Sampling (LHS) method was proposed in the 20th century as a type of constrained uniform sampling method. Its purpose15–19 is to ensure that all sampling areas are covered by sampling points. According to the distribution function and the definition range of each input parameter, the LHS is used to generate each parameter’s random number samples. Firstly, the number of Latin hypercube experiments can be controlled artificially, even if there are fewer experiments than the number of factors. Secondly, the uniformity of Latin hypercube sampling design is better and does not bring with it a problem of test-point accumulation as is often seen in orthogonal tests. Those orthogonal test points often do not cover the whole surface so the model cannot accurately represent the whole parameter-change area. The Latin hypercube design is a space-filled design in which the input combinations fill the entire test range relatively evenly. Again, the Latin hypercube design does not have its own set of test tables, as do the orthogonal and uniform designs, whose tests must be arranged strictly according to the table. Since the Latin hypercube design does not depend on a ready-made test table, the test design is more flexible and controllable.
Since assessing composites’ properties by experiments are time-consuming and costly, it is necessary to build efficient computational models to reveal the damage extent due to impact and the effect it has on the load-carrying capability of the composite structures. 20 A Faggiani and BG Falzon 21 predicted low-velocity impact damage on a stiffened composite panel. D Feng and F Aymerich 22 studied damage induced by low-velocity impact on composite laminates via Finite Element Modelling. Chunlin Du, etc. 23 introduced A comparison study on the impact failure behavior of laminate and woven composites with consideration of strain rate effect and impact attitud. Benedict Lawrence Sy and Xi Li, etc.24,25 represented damage evolution of laminates subjected to low velocity impact loading. In Users Conferences of LS-DYNA,26,27 clients used MAT054, MAT058 and MAT262 to simulate the laminates. The simulation parameters can be checked by experiments and the reliability of simulation analysis can be improved. Simulation analysis replaces part of the test, which can reduce the cost and shorten the development period of composite materials.
This paper is structured as follows. First, the concept of composite impact resistance and test design are introduced. Then according to Di Zhang’s low-speed impact test, 20 the model is established and simulation is performed by LS-dyna. Compared with his results, the simulated parameters are modified for the low-speed impact analysis of a honeycomb sandwich structure of composites. After 40 honeycomb sandwich structures’ simulations, the impact resistance (damage area) of this kind of structure is taken as a dependent variable, and the structure and punch characteristics are considered independent variables to fit the hyper space surface of resistance. Next, the resistance sensitivity of each independent variable of composites is analyzed, which helps find the key factors related to resistance. Fourth, by LHS from the resistance hyper space surface, the minimum test matrix is designed. Finally, the initial coefficients of the resistance derived by 2-order Taylor’s series expansion are obtaining by being compared with the fitted resistance equation of the hyper space surface.
The research flowchart in the present work is showed in Figure 1. The green dotted line is the future job. Research flowchart.
Most importantly, in this paper, the parameter sensitivity of low-velocity impact impedance is analyzed, and the model is modified by comparing simulation with experiment. Through a lot of simulations, the number of the composite material tests is cut down and the impedance formula of composites is formed.
Analysis principle
Impact dynamics equation
Due to the complex impact mechanism of composites, there is no accurate solution method, so the finite element method is often used for simulation. In the dynamic problem, the displacement u is a function of time T and the dynamic equation of laminates takes the form shown in equation (1).

The transient dynamic analysis method is still employed in this study and the analytical solution method is shown in Figure 2. Transient dynamics solution method.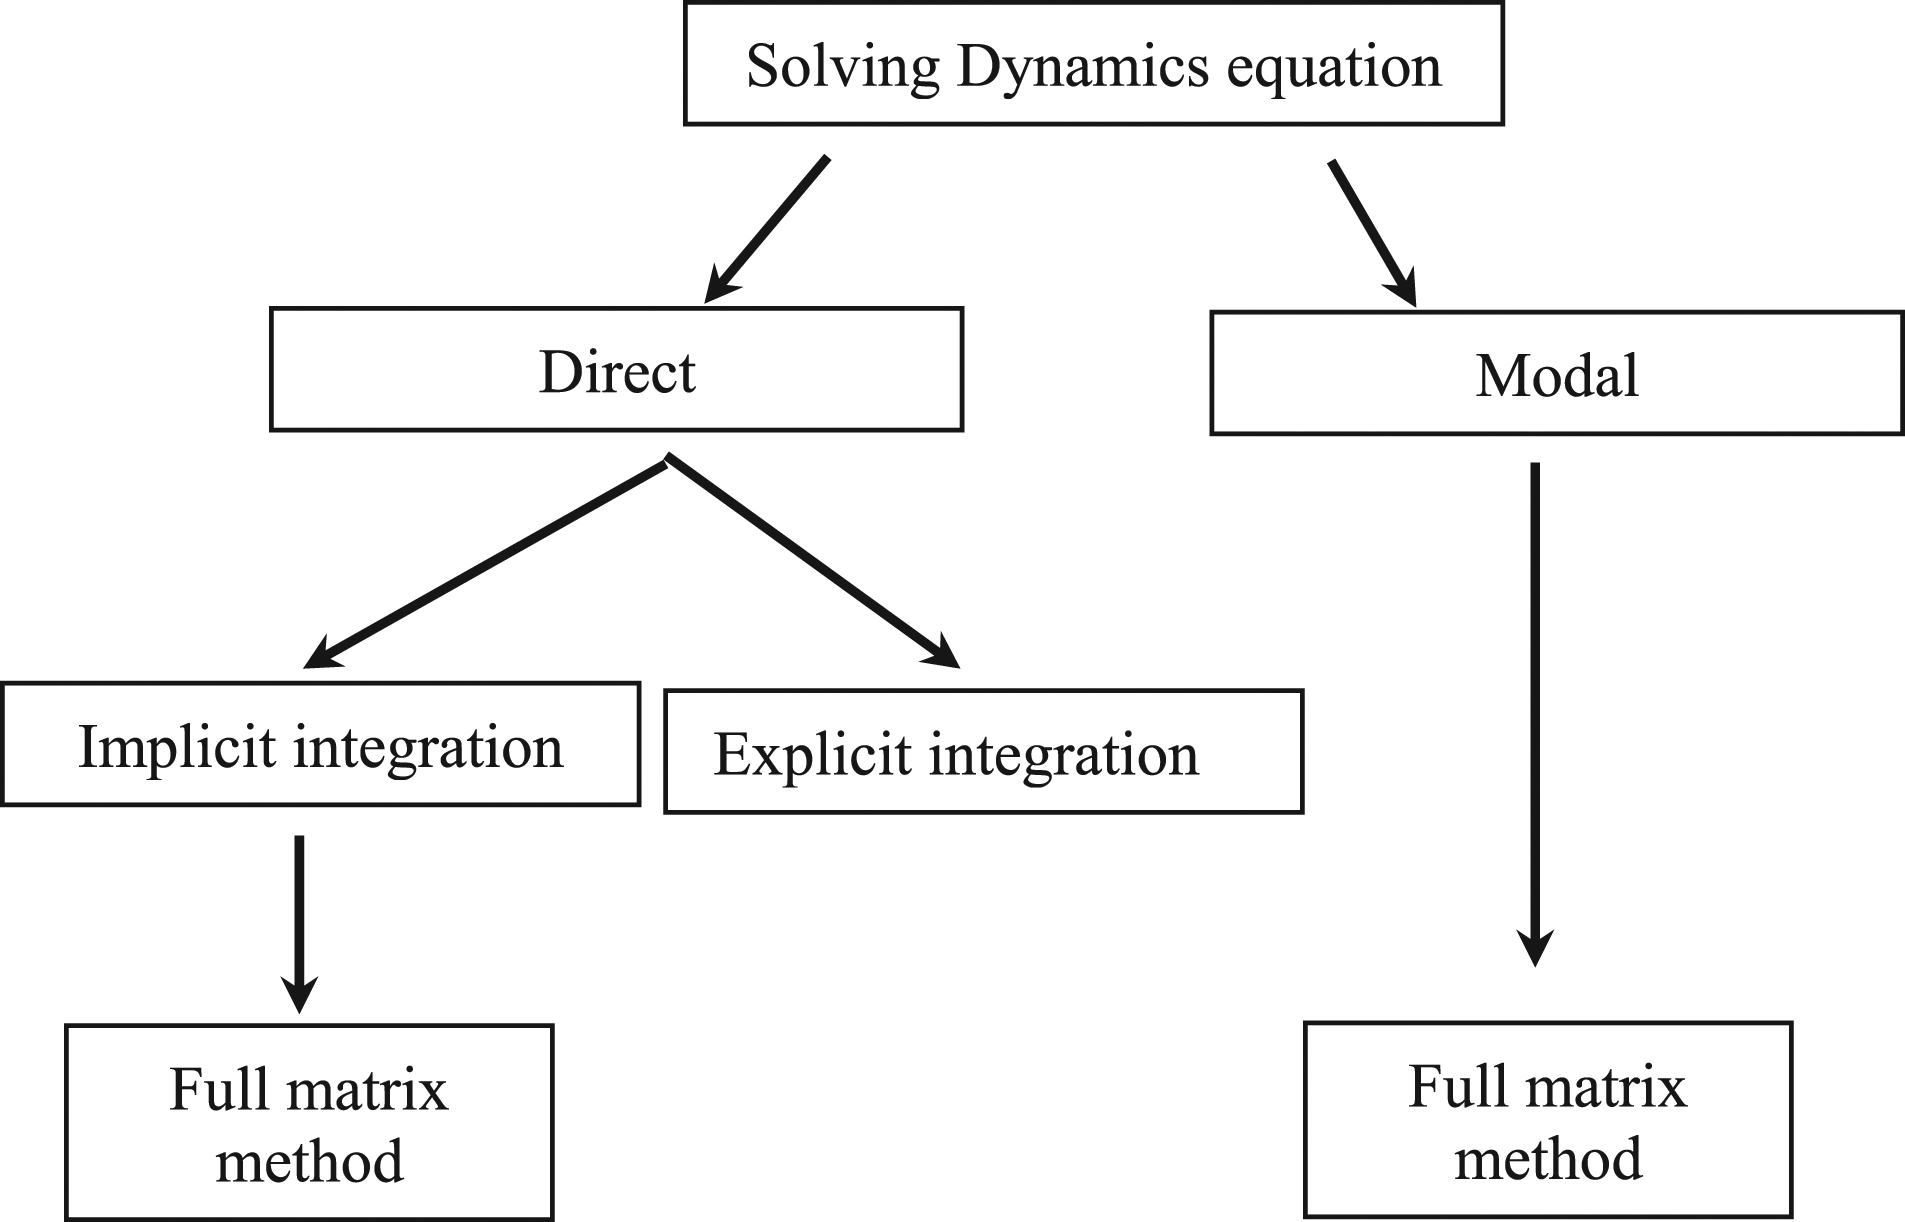
In this paper, the impact transient dynamics problem is solved by explicit integration. In the impact response analysis, the dynamic equation of the punch takes the form of equation (2).

Damage-area resistance
In terms of some experience, the area of damage to the laminate for resistance caused by the low-speed mechanical impact can be expressed by equation (3)


Failure criteria
Composite failure criteria
In the current study, LaRC criterion that is based on the continuum damage model is applied from References 28, 29. The evolution of threshold (internal) variables is in equations (3) and (4):

The evolution of damage variables is shown in Figures 3 and 4. Bi-linear in fiber direction. Linear in transverse direction.

The B–K fracture criterion for cohesive elements
The cohesive element from References 28, 29 is defined in Figure 5. The cohesive element’s definition.
The B–K fracture criterion is particularly useful to describe the delamination propagation in equation (5), as following:

Honeycomb failure criterion
Honeycomb sandwich panels come in a variety of honeycomb shapes, including quadrilateral, hexagonal, and others. The coordinate system used for this honeycomb core has three main directions (Figure 5): Wall direction, Longitudinal direction and Transverse direction. Suppose the honeycomb length is L. For Mechanical directions of honeycomb sandwich structure. Interface of three walls.

If the honeycomb is hexagonal, the compressive strength is listed in equation (6).
31

Model verification
Analysis model
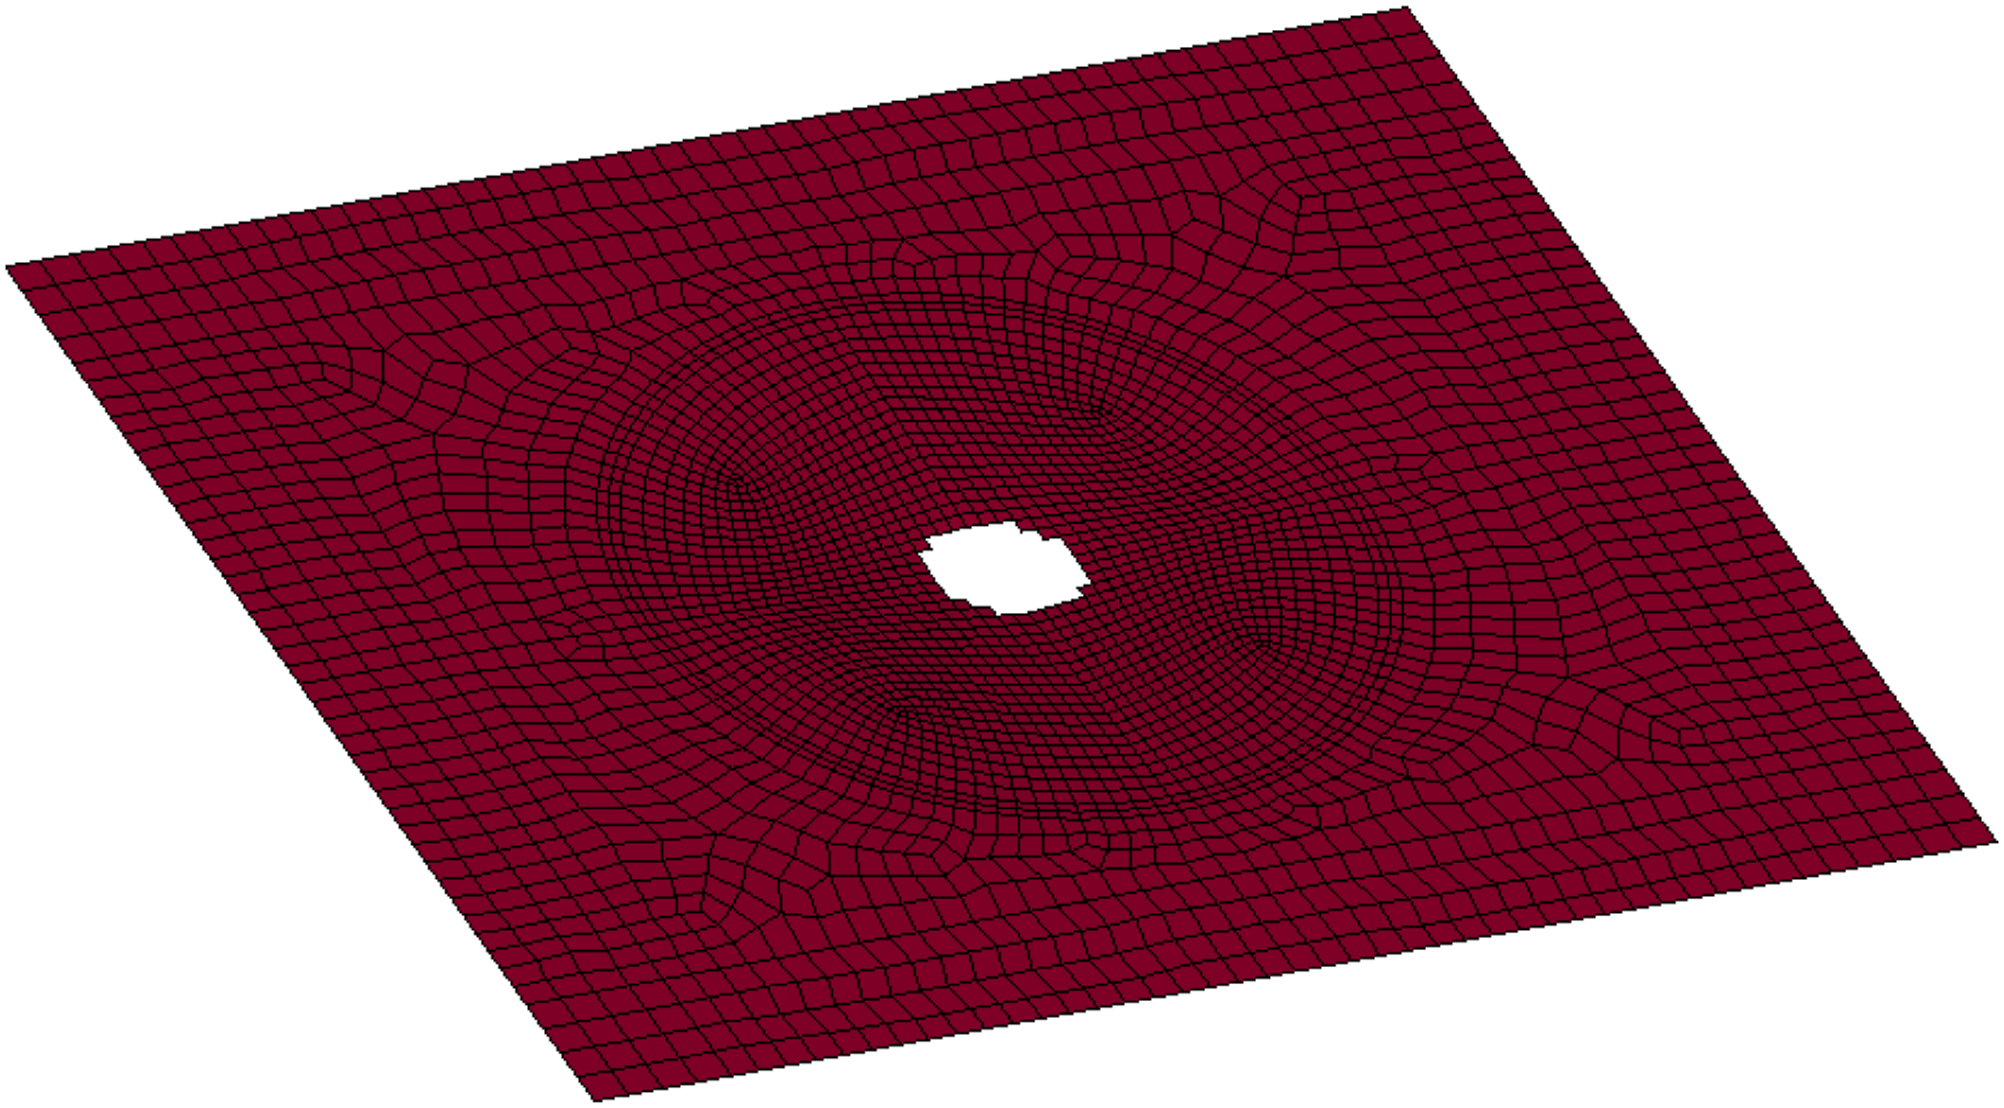
In terms of Reference 20, a steel hemispherical impactor of 16 mm diameter and the specimen (S1) with 150 mm × 100 mm × 5 mm were simulated by finite element model (see Figure 8). The finite element model of the specimen (unit: m).
There are 425,256 elements and 442,360 nodes in the model. It has 20 layers and each layer has the thickness of 0.25 mm. The stacking sequence is [45/−45/90/45/0/−45/0/45/−45/0]s. The impacted model is shown in Figure 9. The impact model with fixed four sides.
A zero-thickness cohesive hexahedron element is defined between each two layers of a composite material plate. The model of the impactor has 4860 elements with 5003 nodes. The impact energy is 35 J. The materials of the impacted model and impactor are the same as those in Reference 20. The model is in accordance with the ASTM D7136M-05 standard.
Comparison of analysis results
LS-dyna was applied to perform the impact analysis. Compared with the S1 specimen’s contact force, displacement, and energy changing in Figure 7 of Reference 20. Figure 10 shows the changing contact force over time in the present simulation; Figure 11 represents the changing displacement over time; Figure 12 indicates the changing energy over time, which the vertical axis (Global Data) represents energy. The following section outlines general (nonformatting) guidelines to follow. These guidelines are applicable to all authors and include information on the policies and practices relevant to the publication of your manuscript. The changing contact force over time (unit: force, kN or E + 3 N; time, ms or E − 03 s). The changing displacement over time (Unit: displacement, mm or E − 03 m; time, ms or E − 03 s). The changing energy over time (unit: energy, J; time, ms or E − 03 s).


Full factor customer simulation arrangement table.

From the above curve, the peak displacement is about 5.1 mm, which is almost identical to the peak point of the curve in Figure 7(b) and the data (5.87 kN) in Table 1 in.Reference 20.
From the above curve, the trend of the changing energy is in good agreement with Figure 7(c) of Reference 20.
Figure 13 illustrates the delamination of the typical interface of the current study. The typical delamination chart of cohesive elements.
According to the superposition of damage area of each layer, the final damage area is 1388 mm2, which is consistent with that in Table 1 in Reference 20.

In terms of LaRC criterion, the failure modes of the impacted plate are listed in Figures 14 and 15, which show the damage of the fiber tension (#5) and compression (#6). The ribbon in the upper right corner represents the Failure Index (FI). When FI Fiber tension failure. Fiber compression failure.

According to the comparative analysis above, it shows that the element selection of simulation modeling of the impacted plate and impactor is appropriate and the scale of it is also fine, which can be used for the simulation analysis of the following experimental matrix.
All-factor customer design for low-speed impact analyses
The correspondence between simulation matrix and code parameters.

According to the statistical range of impact energy of existing civil aircraft’s specific structures, horitonal tails, the levels for the energy of impact are decided.
The full-factor customer simulation arrangement creates a total of 1512 potential cases (see Table 1).
In the current work, some of typical simulations in Table 1 were performed through random selections.
Typical simulation analysis
Honeycomb material parameters.

The leading edges of the wing are made of carbon fiber laminates bonded with the honeycomb sandwich layer. The composite laminates can be divided into solid or shell elements. The element size ran from 1 to 3 mm and the thickness between the element layers was 0.188 mm. The typical model is listed in Figure 16 for FEM. Among them, A1, B3, C4, D3, E2, and F7 refer to the first line of Lamination Code, the third line of Lamination Dimension, the forth line of Honeycomb Height Code, the third line of Punch Diameter Code, the second line of Punch Material Code, and the seventh line of Punch Engergy Code. FEM for the low-speed impact (A1, B3, C4, D3, E2, F7).
In the case of impact, partially out-of-plane loading may lead the core to crumble and the panel to rupture. To evaluate it, the core model should be able to model the damage mode in the direction of thickness compression. The honeycomb sandwich part is simulated by three-layer hexagonal elements. Its compressive strength and density are 3.27 MPa and 48.3 kg/m3, respectively.
Impact simulation results
The impact energy of the model was 35J as shown in Figure 17 and the simulation results are shown in Figures 18-21. The changing energy over time (unit: energy, J; time, s). The changing contact load over time (unit: force, kN or E + 3N; time, s). The dent of the composite panel. The typical delamination of the cohesive element. Damage transverse (LaRC).


From the above picture, the dent reaches the 14th layer, whose depth is 2.632 mm.
The typical delamination is listed in Figure 20.
The total damage area is 320.76 mm2 by superposition, which is defined as the corresponding structural resistance of the panel under 35J impact.
In Figure 21, the typical damage modes can be seen in terms of failure criteria, which show there is the transverse damage (#7).
Low-speed impact test matrix
The first step is to determine how many times (N) that the simulation must be run. Then the variables are divided into n non-overlapping sub-intervals according to the number of simulations. Finally, the equal probability sampling is carried out in each independent sub-interval.
The Latin hypercube test’s sampling procedure for the low velocity impact test can be summarized in three steps: 1. Selection of sampling parameters: the test panel ply, the test panel size, the honeycomb height, the punch diameter, the punch material, and the punch energy are all decided on. 2. Generating random numbers: each variable Xi is divided into K non-overlapping intervals of equal probability (the probability of each interval is 1/k), and then a representative parameter Xik is generated from each equally probable sub-interval. This represents a parameter that typically occurs at the midpoint of an interval, as shown in Figure 22. 3. Generating samples: according to the parameters of the sample and the randomized selection of the Xik parameter, each combination contains all the variables of a sample on that would be associated with Xik. The equal probability interval division for random variables.

About 40 low-speed impact simulations were taken out. The input data involved were the test panel ply, the test panel size, the honeycomb height, the punch diameter, the punch material, and the punch energy. Output data about the damage area was collected. The input and output data are used to construct the composite resistance by response surface approximation.
19
The error of Root Mean Square is 0.21,796, while that of R-squared is 0.61,183. The error condition is listed in Figure 23. The error results for the damage area.
The sensitivity bars in Figure 24 are obtained using the relationships between the relevant design parameters and their associated resistance factor. Parametric sensitivity bars related to the damage area*.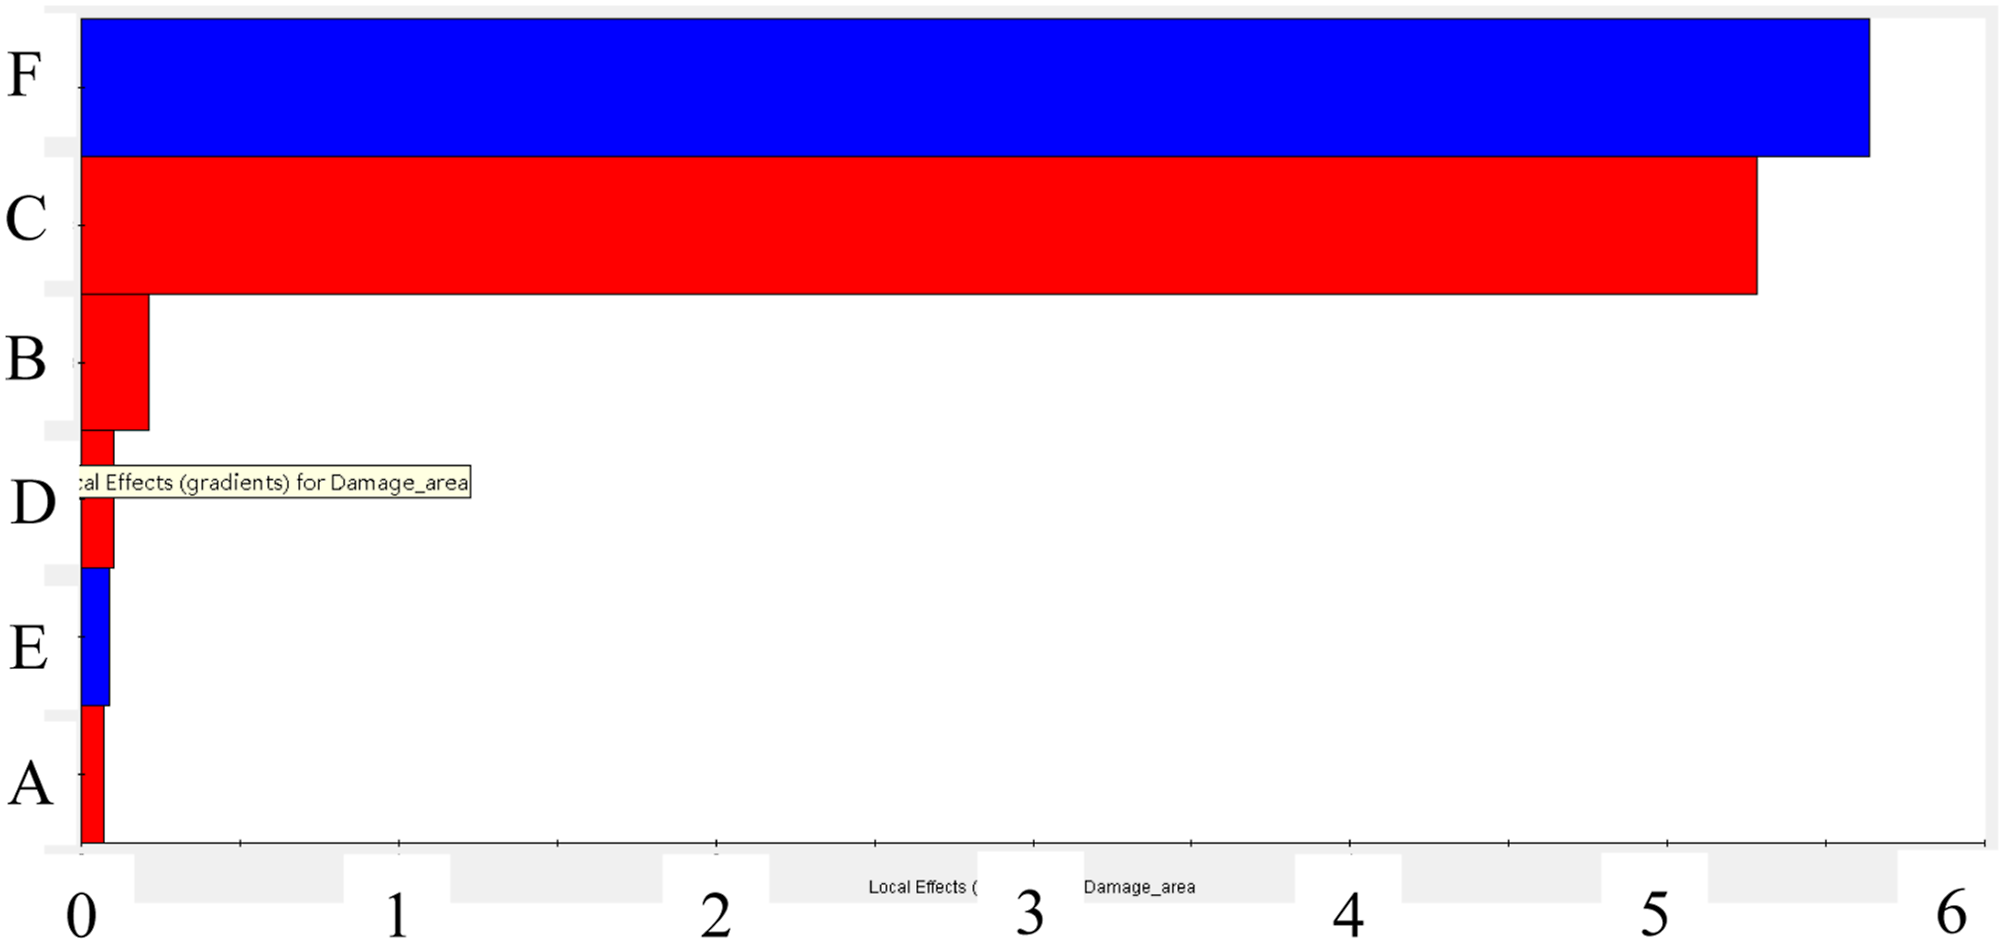
*Blue bars indicate positive correlation that means increasing this item with increasing damage areas, while red bars indicate negative correlation that means increasing this item with decreasing damage areas.
From the above figure, for the damage area the impact energy (F) has the highest sensitivity, followed by the honeycomb height (C), while the sensitivity of the other terms is quite low.
According to Term Selection of removing some polynomial terms with low significance and selecting the most significant terms from the polynomial, it can improve reliability of your approximation and reduce the number of required coefficients. Via sieving, an initial function of the damage area (resistance) with selected factors is defined as follows:
Compared with equation (3), the initial coefficients, Latin hypercube design flowchart.


The minimum test matrix of the low-velocity impact for honeycomb composites.

Conclusions
In this paper, a low-velocity impact model is established for simulation analysis, whose results are compared with the standard experiment. The maximum impact load, maximum displacement and damage area of the simulation are in good agreement with the experimental values, which shows that the selected simulation and calculation parameters are reasonable.
Based on low-velocity impact simulations of honeycomb sandwich panels from the different cases, the resistance function—damage area with six impact parameters is fitted and the sensitivity analysis of related factors is made. The impact energy and the height of the honeycomb have the highest correlation with the resistance, which is consistent with the actual situation.
By comparing the fitted resistance equation (7) with the resistance function (3) of the second-order Taylor’s series expansion, the initial coefficients of the resistance formula can be obtained, and the resistance function can be designed by LHS to obtain a minimum of seven test matrices for honeycomb panels. This shortens the test time and saves the test cost.
Final remarks
1. This paper reduces the number of possible tests of the composite resistance from more than 1000 in Table 1 to seven in Table 5, greatly reducing the cost and time. 2. In order to improve the definition of resistance formula and provide reference for aircraft maintenance interval, seven low-speed impact tests in the future are designed for revising simulation parameters. 3. The discrete and abstract variables, such as lamination, plate dimension, honeycomb height, and so on, are treated as continuous integer variables to fit the resistance formula of the composites. 4. The most direct related factors of resistance and the initial definition of the coefficients of resistance polynomial are obtained from the fitted simulation resistance function.
32
Footnotes
Acknowledgements
First and foremost, my utmost gratitude to Senior Application Engineer, Mr. Qiang Wang, working in Shanghai Fangkun Software Technology Ltd., for his guidance and support of composite parameters of T700 during my computing of the simulations in this paper. I would also like to express my thanks to Prof. Xitao Zheng who has provided me an impact example.
Declaration of conflicting interests
The author(s) declared no potential conflicts of interest with respect to the research, authorship, and/or publication of this article.
Funding
The author(s) received no financial support for the research, authorship, and/or publication of this article.