
Abstract
Compression pressure exertion is strongly related to mechanical properties of compression socks deployed with various type of materials and machine adjustments. These socks work on the principle of highest pressure at the ankle and gradually decrease towards the calf portion. Compression socks are used for the prophylaxis and treatment of venous disorders. Venous disorders range from minor asymptomatic incompetence of venous valves to chronic venous ulceration. Current research work contains analysis of the force at practical extension compared to experimental pressure (Ps), the relationship between experimental pressure (Ps), force at practical extension, and tensile indices which include hysteresis (H), tensile resilience (TR), and tensile linearity (TL). Results showed that the force value at practical extension (FL) impart the significant influence on experimental pressure (Ps). It is also portrayed that the tensile indices (W, W′, H, TR, and TL) combined with force at practical and experimental pressure also shown to have contributed significantly to the explanation of experimental pressure (Ps) results. Compression sock tensile characteristics are highly significant and directly related to their productivity, effectiveness, and working life.
Introduction
Compression socks are a highly regarded textile item for applying pressure to the lower part of the leg. It is used for the prophylaxis and treatment of venous disorders in the human lower extremities. Venous diseases range from minor asymptomatic incompetence of venous valves to chronic venous leg ulceration. To reduce and get rid of venous hyper-pressure, a technique of compression therapy is recommended. 1 In developed countries, leg ulcers affect 1% of the population and have a considerable negative impact on quality of life, costing the NHS between £300 and £600 million annually. Also, insufficient or non-sustained compression therapy will be less effective than sufficient and sustained compression due to an impaired hemodynamic effect. 2
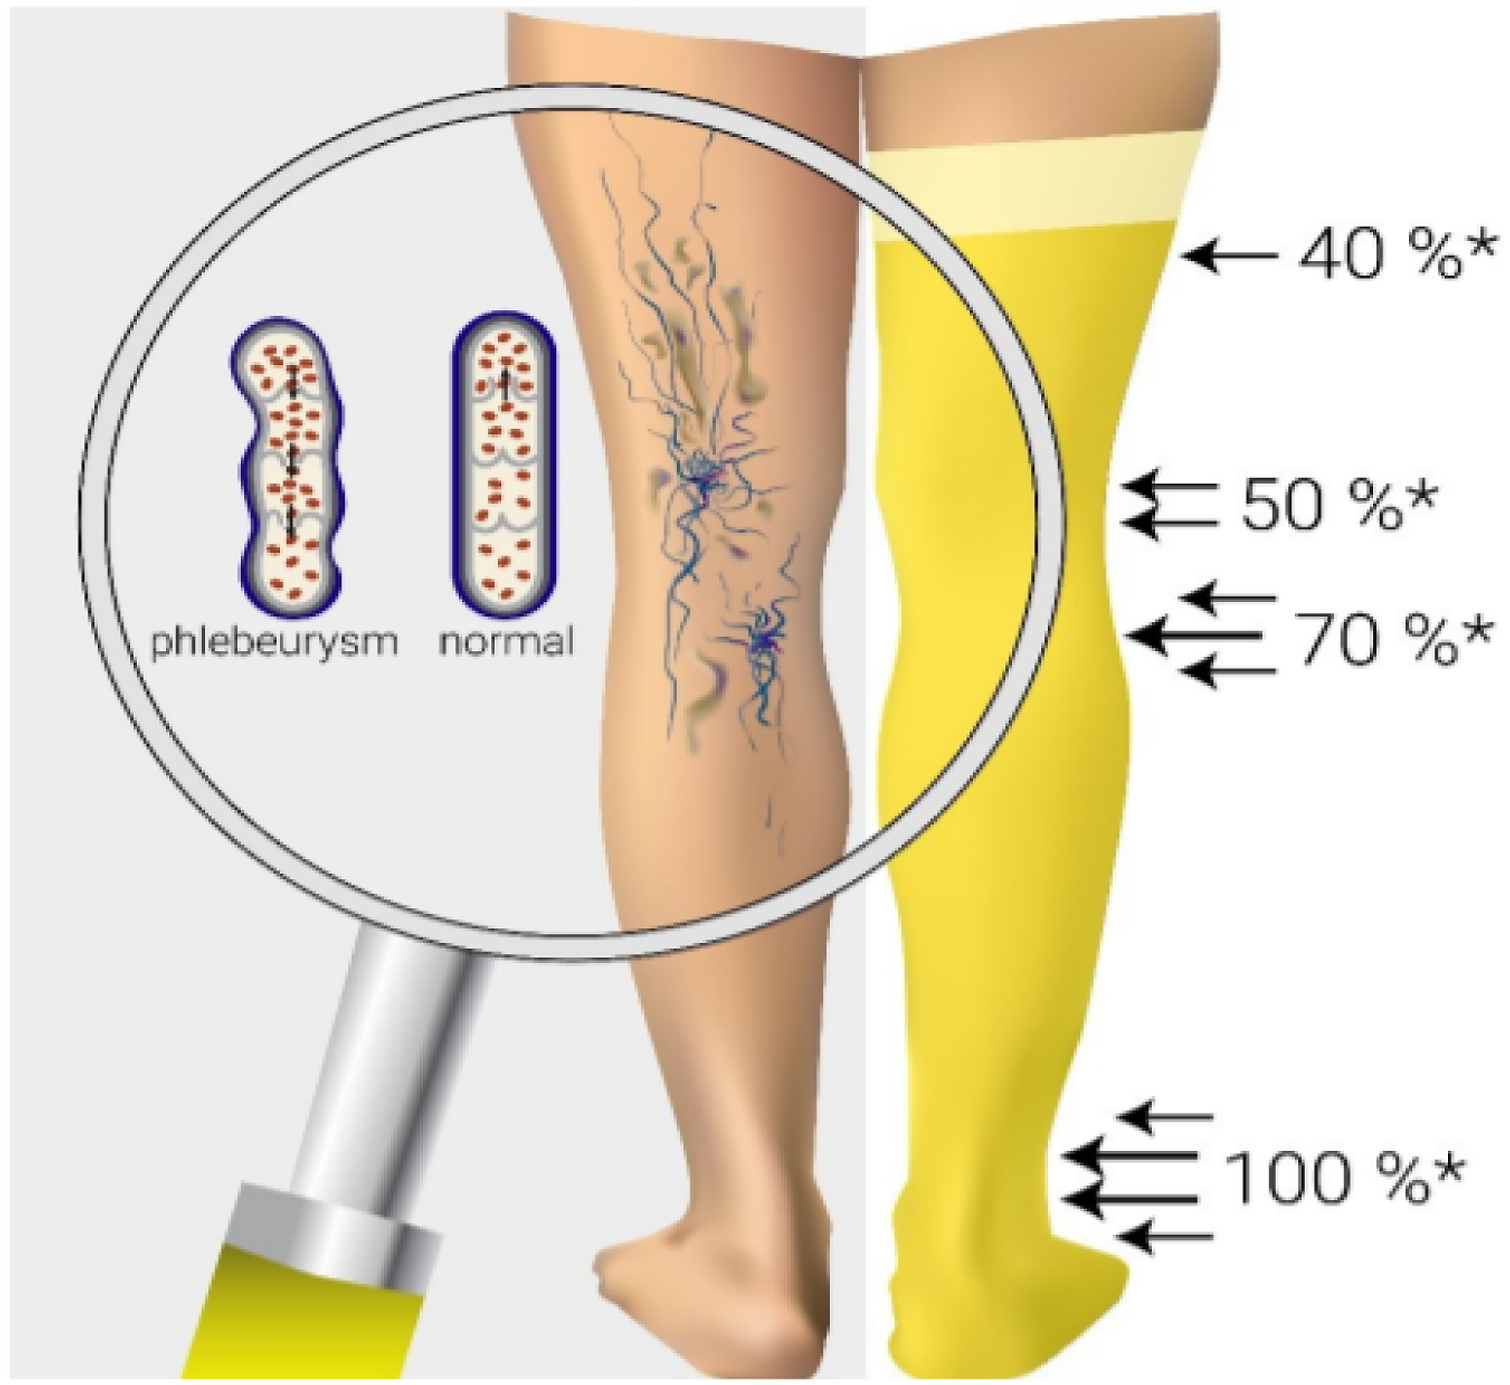
Mechanism of action which lowers the pressure exertion from the ankle to the calf portion of the leg is shown in Figure 1. The pressure gradient propels blood from flowing upwards toward the heart and instead, it refluxes downward to the foot or laterally into the superficial veins. As demonstrated in Figure 2, proper graded compression reduces the diameter of major veins, increasing blood flow volume and velocity.
3
Mechanism of action of compression socks.
4
Comparison of reversible and irreversible blood flow.
4

Various standards and especially British standard BS 6612:1985, 5 French standard ASQUAL 6 and German standard RAL-GZ 387/1:2000 7 had been developed by different authorities and countries to describe the procedural requisites to evaluate and analyze the compression socks. 8
Accoring to the European Committee for Standardization (CEN) and RAL-387/1:2000, 7 compression socks were classified to class I (2.4–2.8 kPa), class II (3.1–4.3 kPa), class III (4.5–6.1 kPa), and class IV (above 6.5 kPa). Class level also portrays the intensity of compression pressure at ankle (B portion). Depending on the kind and severity of the diseases, the degree of pressure and recommended class can be chosen in order to cure circulatory and vascular medical conditions as well as fatigued, sore, swollen, or painful legs.9–12
Medical compression socks with the gradual increase in compression pressure from distal to proximal regions are usually utilized to conduct the compression therapy. Laplace’s law and Pascal’s law are the two primary concepts that help to describe how the compression therapy system applies pressure to the leg. The first principle involves the application of Pascal’s law and it requires muscle movement to generate a pressure pulse which is distributed evenly in lower limbs during active and passive exercise. Pascal’s law also used for explaining the dynamics of compression pressure. The compressive effect can reduce the diameter of veins by positioning valves and forcing the venous blood to return to the heart. 13 The second principle uses Laplace’s law in combination with the applied stocking tension and limb shape in order to provide a variety of interface pressure. This law is used to evaluate the compression pressure in static conditions. 14
According to Laplace’s formula, the operative pressure should be highest at the point of least girth area/radius and have the lowest pressure at the point of maximum girth area/radius. Thus, when compression socks are applied, the frontal feature of the leg encounters the highest amount of pressure while the lateral and medial sides of the leg receive the least compression pressure. Apart from the position of the leg, the circumference (thin or thick) of the leg also requires optimum or lower pressure on cutaneous and subcutaneous skin layers which satisfies the Laplace’s law. 15
Laplace theory was developed to relate the wall tension and radius of cylinders (e.g. blood vessels) to the pressure difference due to inflation and deflation of two halves of cylindrical vessels.11,16,17 The equation can be expressed as

This law is now widely used to explain and assess the pressure that is delivered to a limb of a known radius by a fabric under known tension.
The law of Laplace explains the basic physiologic mechanisms involved in compression therapy. Figure 3 and equation (1) define that at constant tension and increasing radius (r2) being inversely proportional to the curvature of the wooden leg (flat curve) causes the lowering of interface pressure (P1) while lowering the radius (r1) which causes the higher value of the curvature. This results with increased interface pressure. Theory of Laplace’s law and mechanism of working.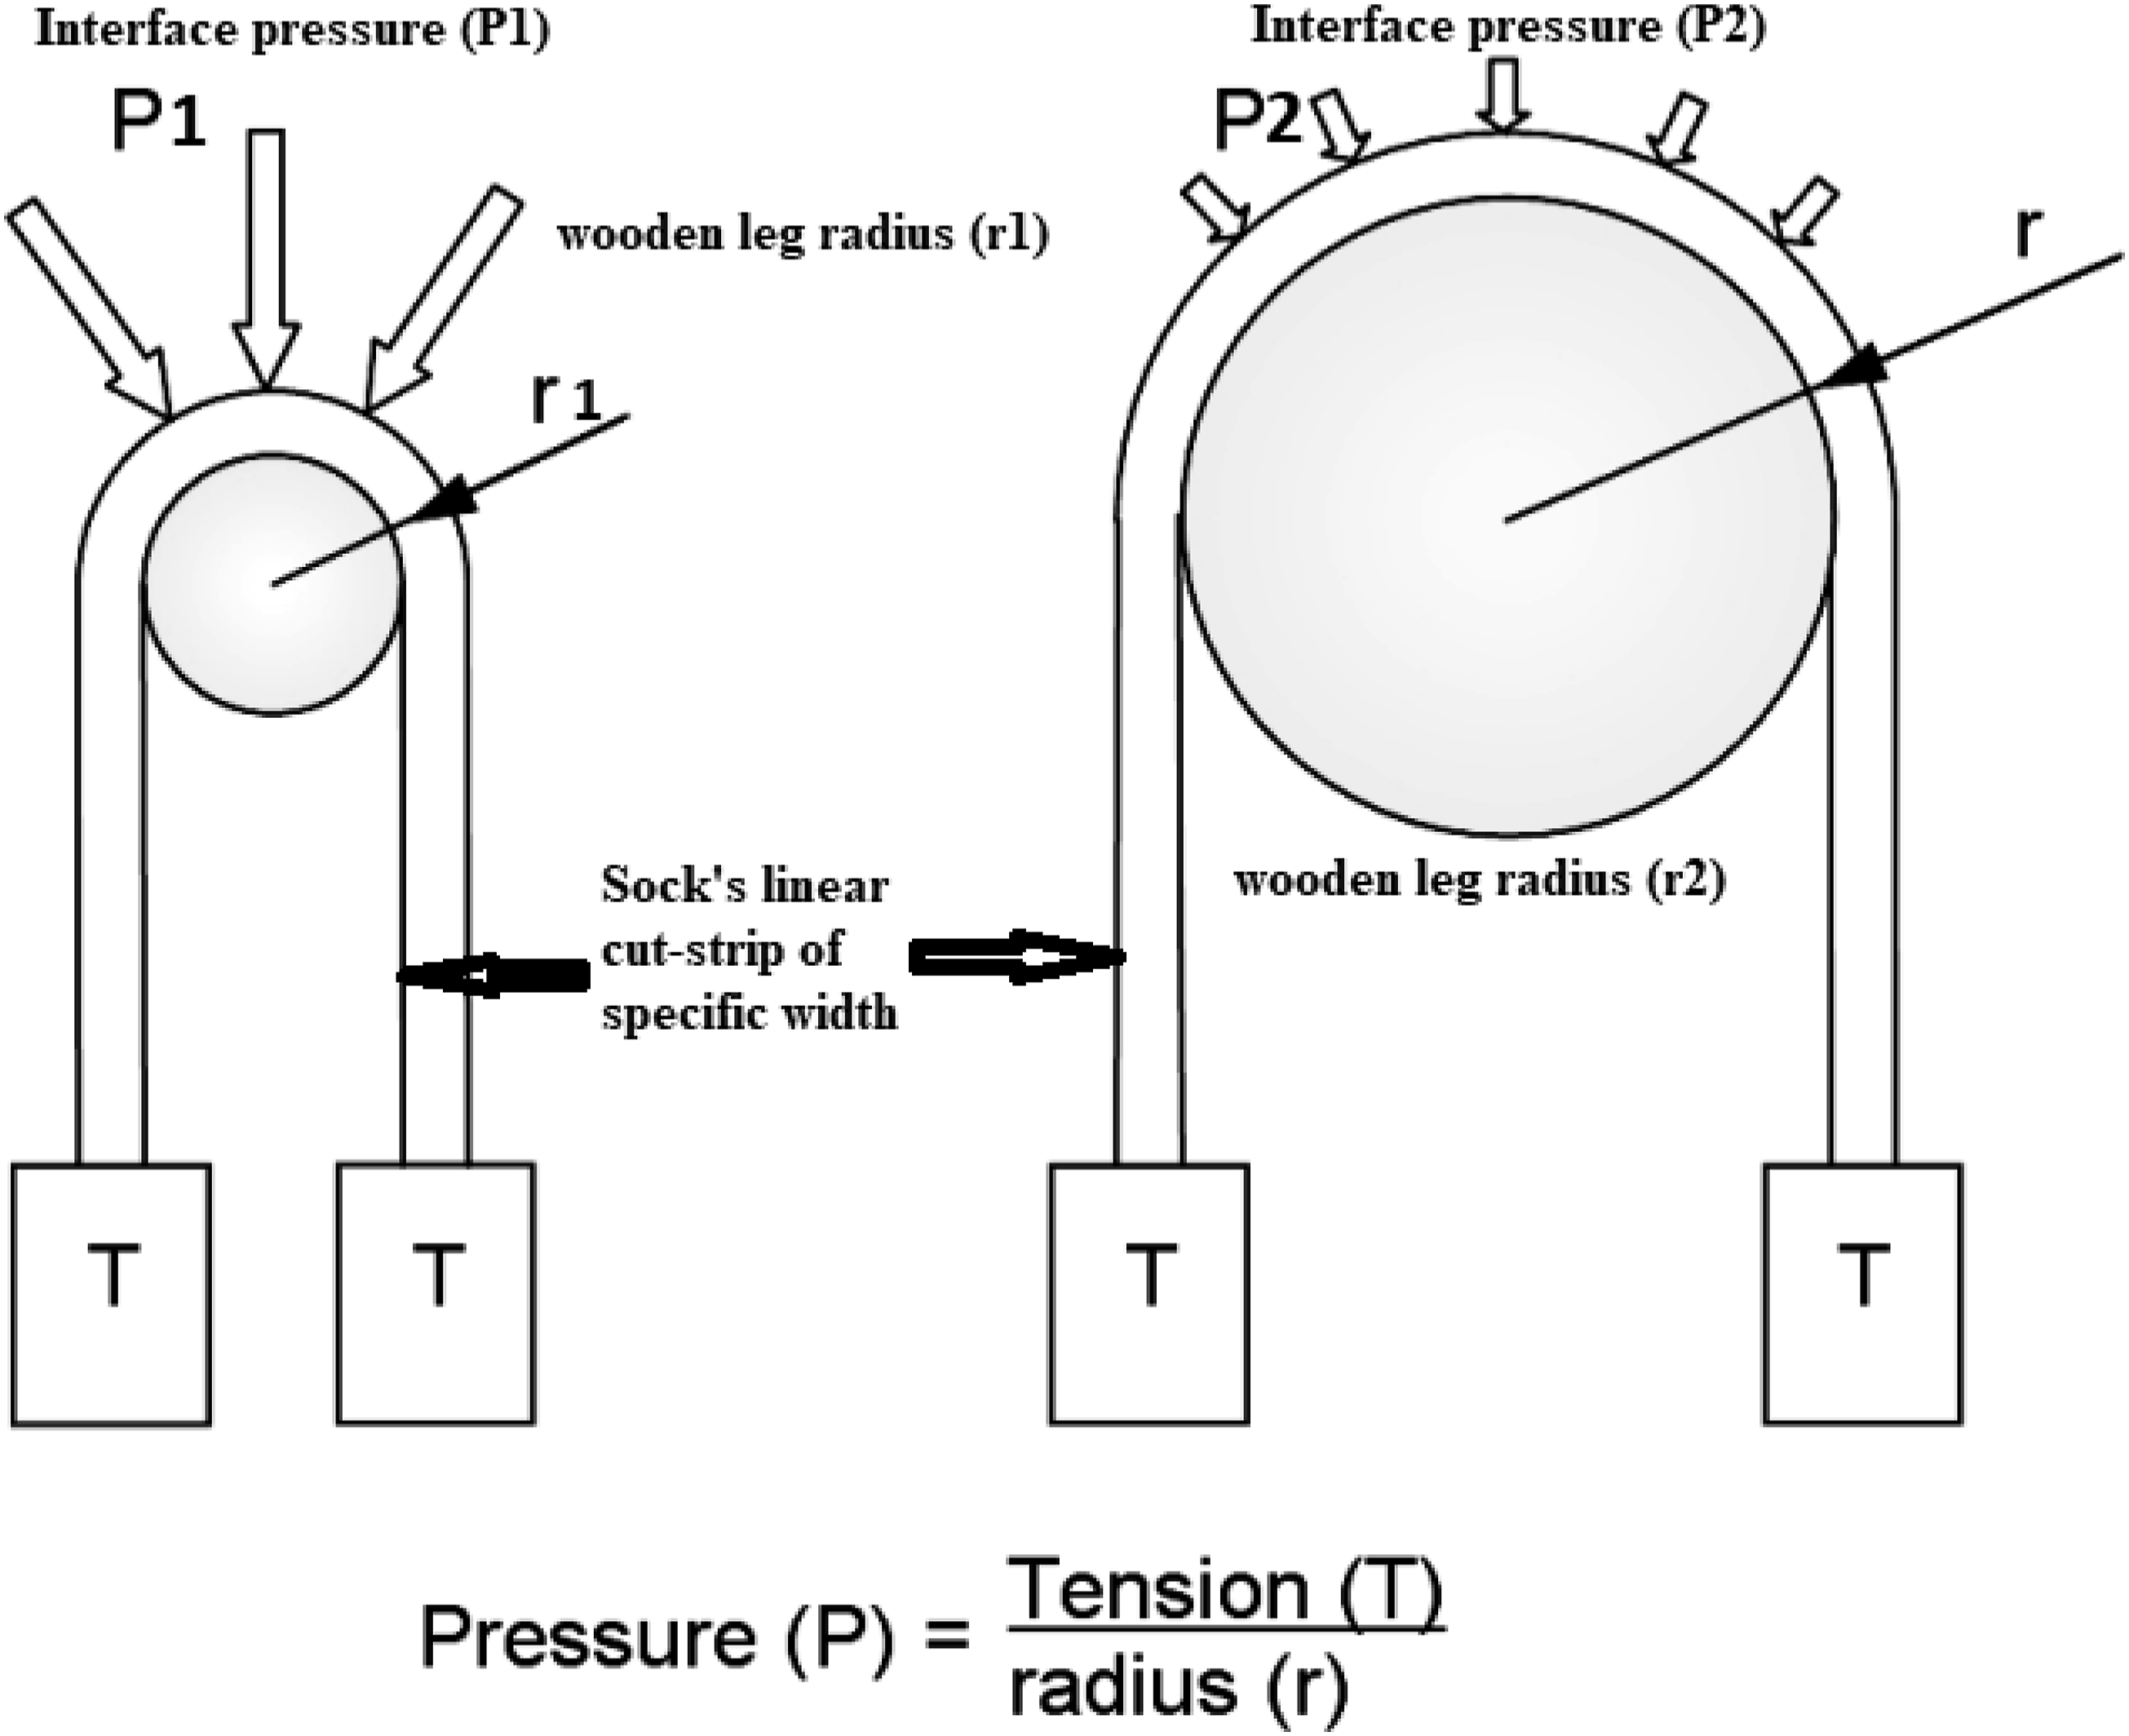
Ancutiene et al. (2017) investigated the tensile properties especially tensile resilience of stretch denim fabric using the KES-F system. She concluded that the degree of elasticity is related to tensile resilience i.e., the higher the degree of elasticity, the higher the tensile resilience.
18
These graphical representations of the stretch and recovery results portray the various mechanical properties of compression sock strips, directly and indirectly, influencing their pressure performance and long-lasting properties. The calculated mechanical properties and definitions using the force-extension diagram are loading energy (mJ), unloading energy (mJ), hysteresis, tensile resilience [%], tensile linearity, and tensile practical stretch percentage [%], etc., as shown in Figure 4. Load-extension curve.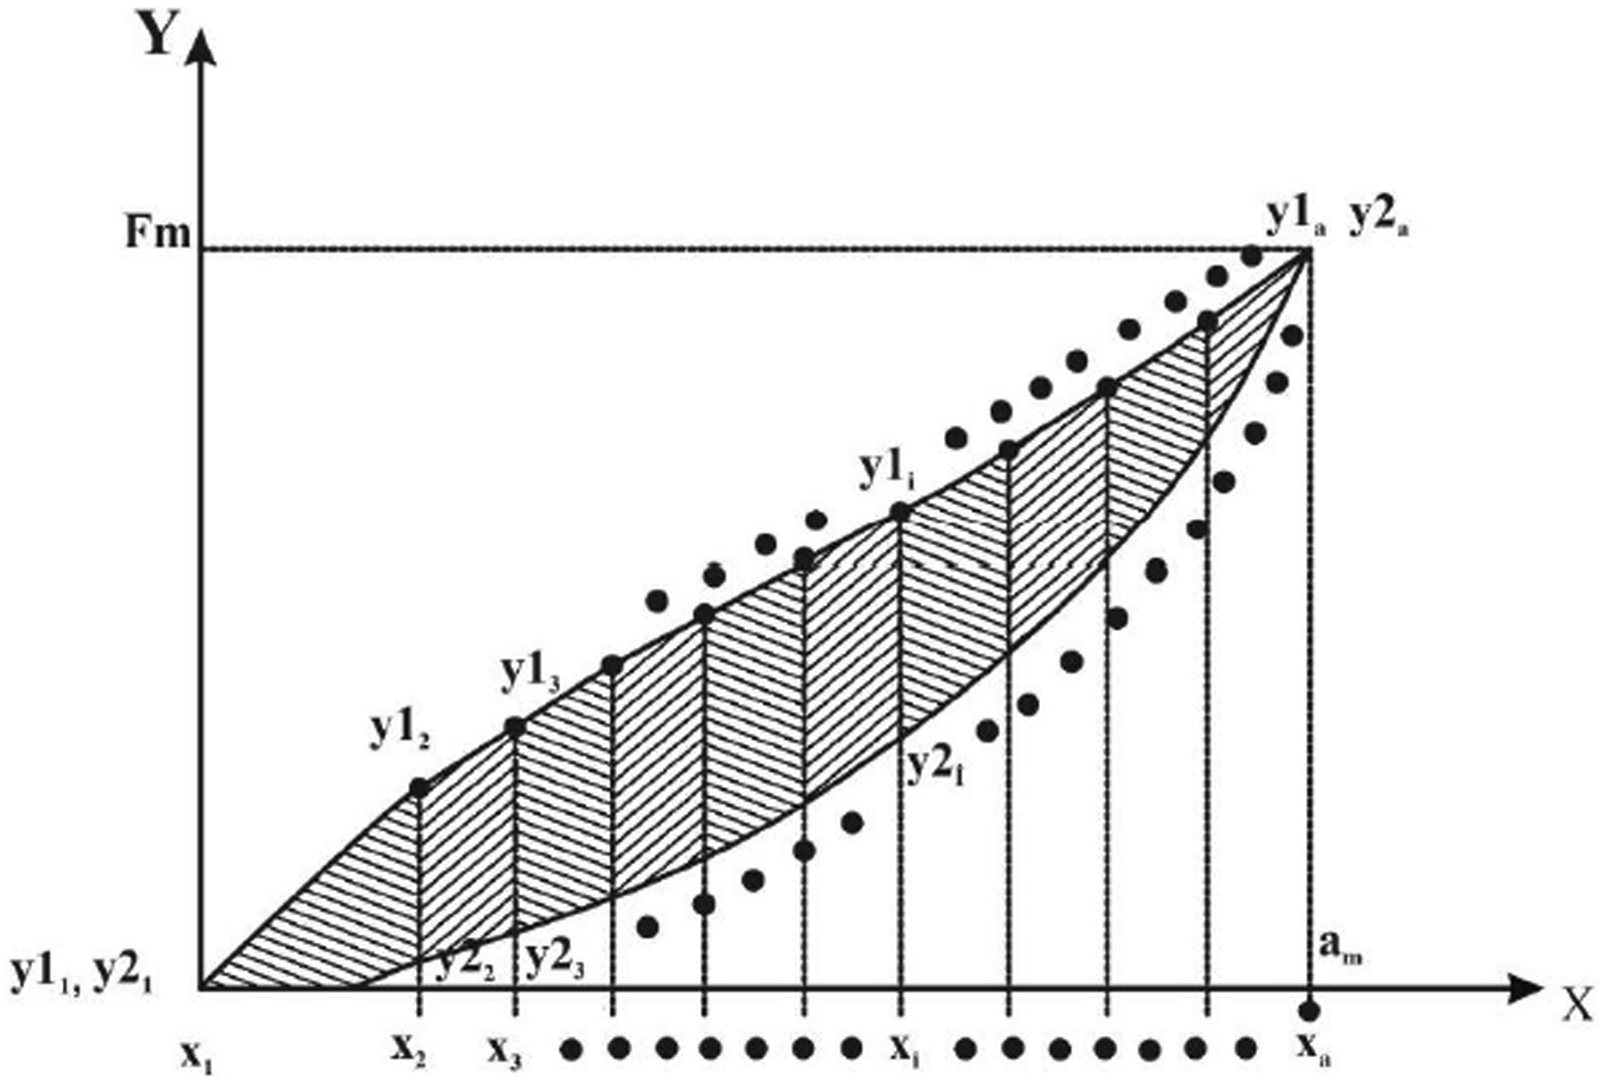
Loading energy
Tensile energy (W) is defined as the energy required for extending the fabric which reflects the ability of the fabric to withstand external stress during extension. The larger value of W implicates a better tensile strength of the fabric.
19
It can also be defined as the area beneath the load-elongation curve.20,21 Another definition is The work done by the extension up to maximum force.
22
Tensile energy was measured by plotting a pair of tensile force extension and recovery curves between zero and a maximum force of 15N, as shown in Figure 4. The tensile energy W can be quantitatively estimated by equation (2).

Unloading energy
If the fabric undergoes a cycling loading process, the fabric is first stretched from zero stress to a maximum and the stress is fully released, then an unloading process follows the loading process. As a result, a residual strain is observed, since textile materials are viscoelastic. With the decreasing of the stretch loading, the return curve formed reflects the tensile resilience energy W

Hysteresis measurement
Figure 4 portrayed that loading and unloading curves do not follow the same track. The area encircled by the two curves forms a hysteresis loop, which indicated the energy dissipated due to material plasticity during the extension process denoted by “H”. The property of hysteresis (H) could be a useful parameter to evaluate the viscoelastic properties of compression socks cut-strips. To obtain the areas encircled by the tensile and resilience curves, the trapezoidal rule was considered to be a simple and effective quadrature rule. The approximation of the definite integrals is usually referred to as the numerical integration or quadrature. According to the trapezoid rule, the partial sum of individual trapezoid areas could quantitatively present the hysteresis (H) when the fabric is stretched under a certain tensile loading as shown in Figure 4.
Where H is the approximate area encircled by two load curves, y1i is the tensile curve (load increasing), and y2i is the resilience curve (load decreasing).
24
The mathematical analysis was defined in the following way using equation (4).

Tensile resilience
A measure is the ratio of recovered energy per unit area to the energy of extending the fabric in the load-extension curve; or, the ability of a fabric to recover from stretch after the application of tensile stress. A higher TR value implies that the fabric has a better ability to recover its original shape after the applied tensile stress is released.
22
It can also be defined as the ratio of W and W

Tensile linearity
Tensile linearity indicates the wearing comfort. Lower values of the LT give higher fabric extensibility in an initial strain range indicating better comfort but the fabric dimensional stability decreases. The tensile linearity in extension reflects the degree of buckling deformation of the tensile curve of the tested elastic fabrics, thus, we have

Practical stretch and reduction ratio
It is the ratio of the circumferential difference between the leg and socks to the sock’s circumference while reduction percentage is the ratio of the circumferential difference between the leg and socks to the leg’s circumference calculated using equation (7) and equation (8).
7


It is well proven that sock’s pressure can be calculated by analyzing the tensile behavior (modulus of elasticity). Higher the elasticity modulus, the lower degree of extensibility will be. Therefore modulus of elasticity and reduction percentage are main predictors of compression pressure. 25
The definition of periodical efficacy and targeted compression pressure heavily depends on the tensile properties of compression socks. No studies that incorporated the effects of tensile indices (W, W′, H, TR, TL), force at practical extension (FL), and experimental pressure (Ps) were discovered in the scientific literature. There are a few studies in the literature that used the Kawabata evaluation system (biaxial extension)23,26–30 to measure tensile indices related to experimental pressure rather than an uniaxial tensile tester.
The main purpose of current research was to investigate the mechanics of socks which are force at practical extension compared to experimental pressure, comparison of tensile indices, force at practical extension and experimental pressure.
Materials and Methodology
A total of 13 commercially available sock samples which exhibit compression class levels were purchased (class I, 2.40–2.80 kPa; class II, 3.06–4.27 kPa and class III, 4.53–6.13 kPa where 1 kPa = 7.500 mmHg). Class 1 is coded as A1, A2, and A3; Class II is coded as B1, B2, and B3 while class III is coded as C1, C2, C3, C4, C5, C6, and C7. Only 2 examples from class I that is being exhibited (1 laid-in mesh knit) were confirmed following visual analysis, out of the majority of the socks (11 samples) that were displayed (1 laid-in plain knit). Samples of socks were evaluated on fixed-sized, typical wooden legs with an ankle circumference of 24 cm.
Physical specifications of compression socks.

*PA, polyamide; *PU, polyurethane; *CCL, Compression class level. 7
Technical specifications of compression socks.

*MF, multi-filament yarn; *ACV, Air covered yarn; *SCV, Single covered yarn; *DCV, Double covered yarn.
Preliminary data of all 13 samples were evaluated at the ankle portion and include the following: fabric weight [g/m2], fabric thickness [mm], quantitative analysis for lycra composition [%], type of yarns transformed to knitted base, stitch density, and circumference/width of the compression socks at ankle portion. These data were then classified into three levels of compression classes (Class I, class II, and class III) based on the intensity of compression pressure at the ankle mentioned in CEN 15,831:2009 31 and RAL-GZ 387/1. 7 The class level is defined by considering the pressure at the ankle portion because it is one of the complex parts of the leg (contour surfaces and bony).
Fiber analysis of all samples were conducted by using the standard procedure mentioned in AATCC-20A-2013 shown in Table 1. As illustrated in Figures 5(b),(a) square of 25 cm2 was marked on both faces of the compression socks to validate the contents (Nylon/Lycra) at the ankle section. Unraveled threads were also used to determine the yarn and knit type, the contents and other details. Unraveled threads were weighed and then treated with a formic acid solution at a concentration of 85% to dissolve the nylon filaments, as described in the AATCC-20A method, in order to determine the quantity of lycra content (Quantitative analysis of fiber composition). The following equation was used to calculate the percentage of lycra present in each sample using the weight of the undissolved material that was removed as part of the solubility test shown in Table 1. Marking (a) Locating exact grooved line on leg on the face of socks (b) Square marking 50 × 50 mm (c) Mean and main lines crossing over the sensor near the ankle on the leg surface (d) Deformed width after wearing loop strip (e) grooved line (ankle portion).

The pick glass recommended by the RAL GZ-387/1 standard of quality assurance was used to measure the number of wales and courses per centimeter as well as the stitch density per centimeter square. 7 Results of measured parameters; wales density (number of wales per cm), course density (number of courses per cm), and stitch density (stitches per centimeter square) are given in Table 2.
Digital thickness tester of model M034A, SDL (Atlas) device was used to determine the thickness of the material according to standard test method ISO 5084:1996. The quantity of material is determined by measuring the angle between the base plate, on which the fabric sample is placed, and the circular pressing disc which is formed on the surface of the fabric. The measurement progress is recorded by a computer program. While a force of 200 g was applied, the pressing leg’s surface area was 20 cm2. Thickness testing results are given in Table 2.
Sample cut-strips (5 × 5 cm2) obtained from each sock were relaxed for 24 h under controlled standard atmospheric conditions and were weighed by using an electronic weighing balance. Given results in Table 2 were calculated by using the formula given below.
Hand washing
Hand washing parameters.
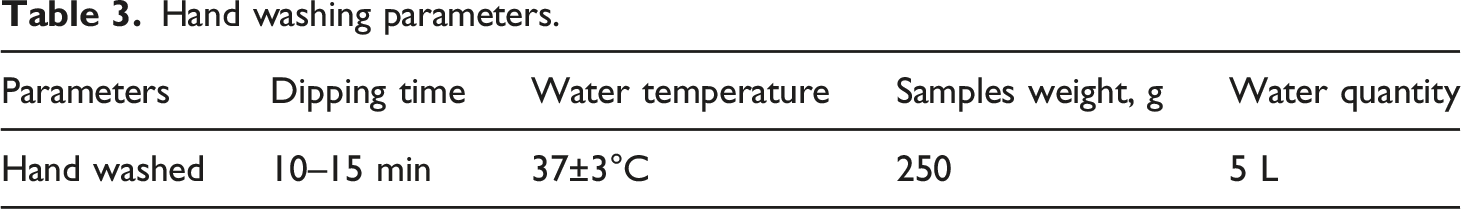
The process involved dipping the socks in a bucket for 10–15 min before dehydrating (Hydro-extraction) them by laying them flat between two layers of towels for 24 h at standard atmospheric conditions (RH%, 65 ± 5%, temperature, 20 ± 2°C) as recommended by the manufacturing brands of the socks.
Marking and slicing of cut-strips (ankle portion)
Initially, a dried sock sample was placed onto a wooden leg so that it was not fully stretched in the direction of wales (longitudinal direction), taking into account that there were no creases on the surface or face of the fabric. This is shown in Figure 5(a), which corresponds to the main grooved line engraved on the face of the wooden leg in Figure 5(e). After marking the mean-dashed line (−), socks were put-off and allowed to be relaxed for 24 h. After 24 h, a square of 5 × 5 cm was drawn on the fabric’s surface, with the drawn dashed line (−) serving as its mean line. This was done to overcome variation due to repeated measurement of compression pressure and to keep the wales and courses smooth and straight.
All of the hand-washed sock samples were put on and taken off five times while keeping the Salzmann MST MKIV model’s mean value at the main grooved line around the leg (see Figure 5(c)). Such a method of marking can be proposed to avoid the variability and reliability of compression pressure results. After marking and pressure measurements, a circular strip having widths of almost 50 mm was sliced into loop-strips as shown in Figure 5(d). The slicing can be made at any position of leg up to thighs and arms in un-stretched form. To measure deformed width (wf), all 13 socks samples’ sliced loop strips were put on the leg as shown in Figure 5(d).
Wooden leg model
The compression pressure of each sock sample was measured on a standard-sized wooden leg. This leg exhibits the requisite specifications a cB (circumference at ankle; 240 mm) and ℓB (position of the ankle from the sole of foot along the leg, 12 cm) arranged by Swisslastic standard leg producing company, located in Switzerland which follows the recommended RAL-GZ 387/1 and CEN 15831 as shown in Figure 6. Standard wooden leg model.
Measurement of experimental pressure
Currently, there are two major methods used for the determination of compression performance-the direct in vivo method and the indirect in vitro method which uses different tools. In this research work, we performed in vitro method for indirect evaluation of compression pressure using the Salzmann pressure measuring device MST MKIV (Salzmann AG, St Gallen, Switzerland). This device is comprised of a thin plastic sleeve (4 cm wide, 0.5 mm thick), with four paired electrical contact points connected to an air pump and a pressure transducer. Sensors are located on the medial (inner) side of the wooden leg and it is placed between the leg and socks as shown in Figure 7. The air pump inflates the envelope until the contacts open (when the inner pressure exerted by the air is just above external pressure due to the compression device). When the contacts open, the transducer reads the pressure at located measuring points and it is displayed digitally with 1-mmHg resolution. Two lengths of the probe are available for this device however only the shorter one (34 cm long) with four contact points was used in this study. Such evaluation of compression measurement was performed under the standard test method RAL-GZ-387/1. MST MKIV pressure measuring device.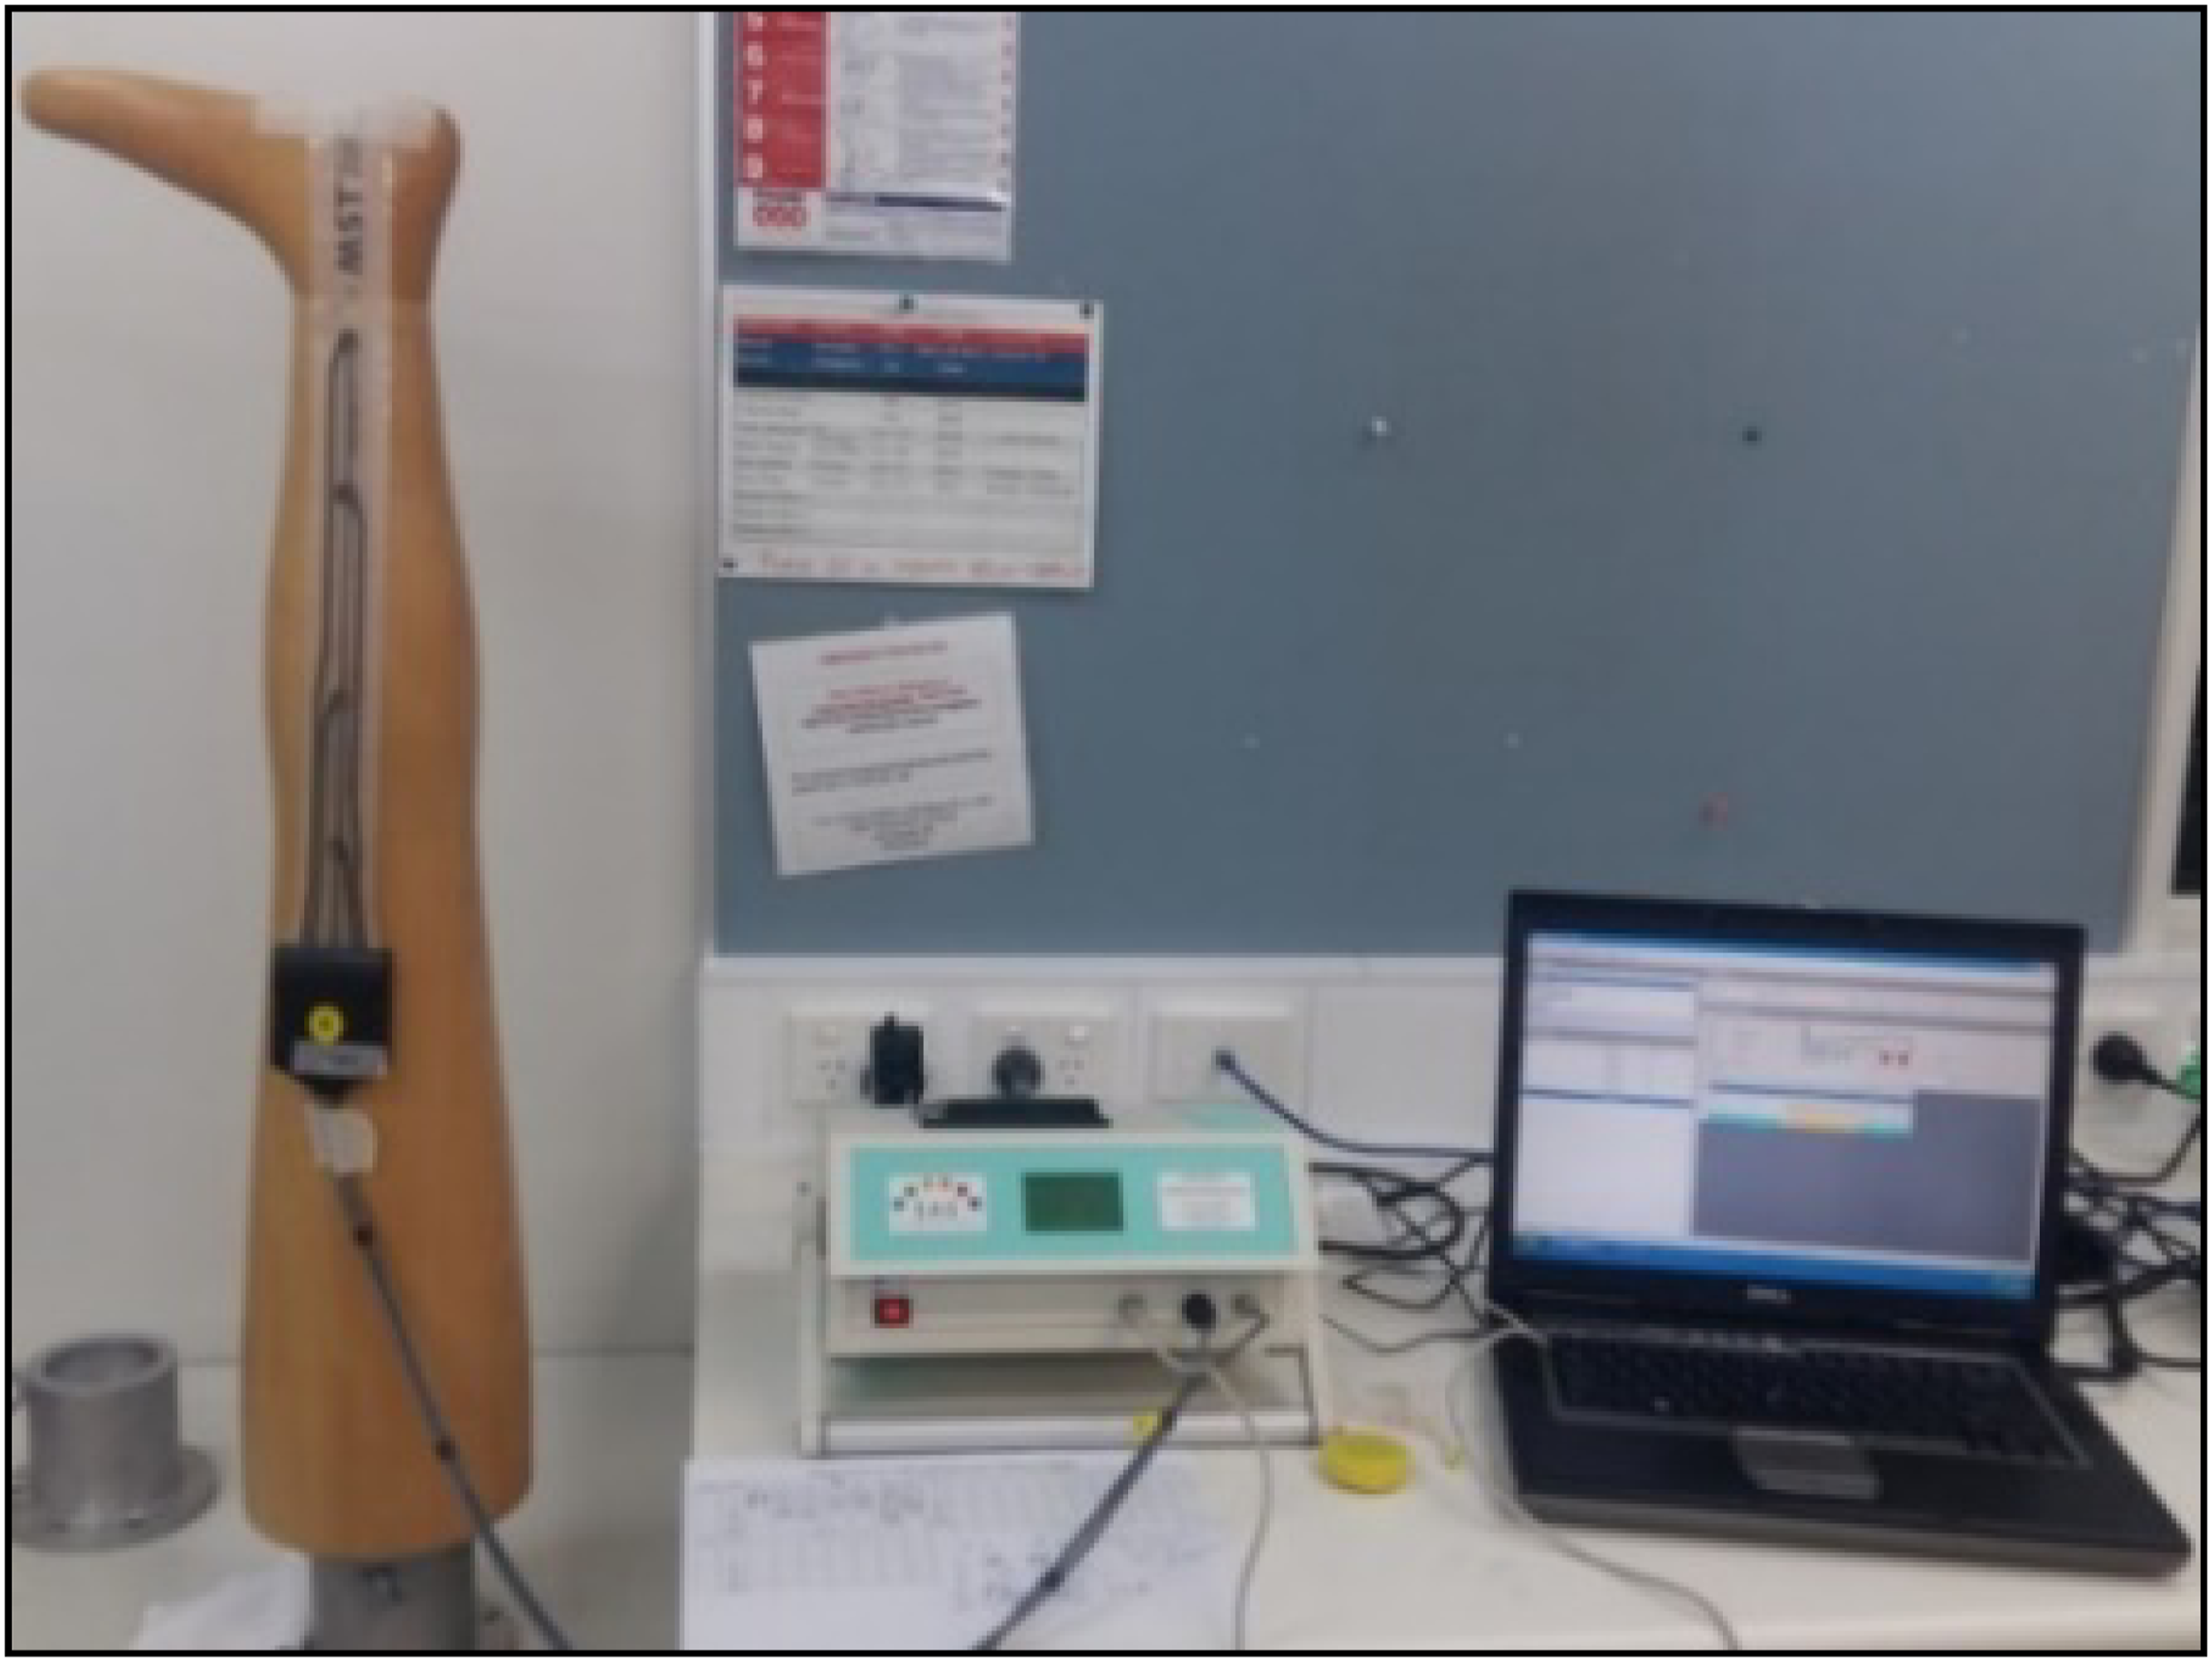
Force-extension curve analysis using the cut-strip method
In this scientific research, all detached cut-strips were investigated for their tension behavior. Using a CRE (constant rate of extension) based Testometric tensile testing machine has the set maximum load of 5 kN and a set of extension rate at 100 mm/minute under standard testing conditions (temperature: 21 ± 1ᵒC and relative humidity: 65 ± 2%) according to ASTM D1775-04.
For tensile characterization, all individually linearized cut-strips were extended to practical extension for five times context to circumference of the leg at ankle portion. The gauge length was set to 50 mm. Most of studies in which the strips are stretched to fixed extension depending on the size of the object or requisite intensity of compression pressure. Ng et al. (2001) 22 mentioned that elastic fabric is stretched during the making up a pressure garment for clinical treatment generally ranges from 5-50%. While RAL-GZ 387/1 defines this range by mentioning that standard size hosiery can be a maximum of 50% of the extensibility transversely at all measuring points. Dongsheng et al. 32 proposed that clothing pressure increases linearly by increasing fabric elongation when it is within the 60% range. A person while wearing a tight garment, transversal extension is not more than 60% of the initial length. Chattopadhyay et al. 9 mentioned during preliminary studies of pressure garments on several subjects that the maximum extension at which the samples were subjected during wear is about 60%. Therefore, it was decided to study the load elongation behaviour of the test samples only up to 60% extension.
Due to these numerous reasons, it is understandable that the strips are extended transversally above 50% and below 70% literately. But the concept for the practical extension to predict compression pressure was never well-thought-out. To describe the tensile indices and the effect of practical extension on force, the load-extension curve data of the 5th cycle at practical extension was employed (Figure 8). This force at practical extension [mm] effect was also used for the prediction of compression pressure with the help of developed mathematical models. (a) Clamped strip without extension, (b) clamped strip after extension.
Sample preparation
All of the circular cut-strips from the ankle portion of compression socks were linearized into rectangular strips while maintaining the square mark (50 × 50 mm) in the center of the strip, as illustrated in Figure 8(a), to evaluate the tension behavior. All 13 sample strips were allowed to be relaxed under controlled atmospheric conditions for 24 h. Relaxed samples were cleaned by removing edging threads along the course direction to ensure inlaid threads are griped to both clamping jaws in order to get an accurate and precise measurement of the force compared to extension data as shown in Figures 8(a),(b). Tensile testing along the wale direction is not tested here because there is no impact of the force of longitudinal extension on compression pressure. So it is decided to characterize the samples circumferentially.
The test and machine specifications were followed according to BS EN 14,704-1 standard test method. Test specifications include tensile rate as 100 mm/minute, specimen dimension which is 146–190 mm × 40–55 mm (lengthways dimension of all cut-strips × widthways dimension of all cut strips) and gauge length adjusted to 50 mm. While the width-wise dimension of cut-strips refers to the strip width along the length of compression socks or the wales direction of compression socks, the lengthwise dimension of cut-strips refers to the circumferential, transversal, or course direction of cut-strips at the ankle region.
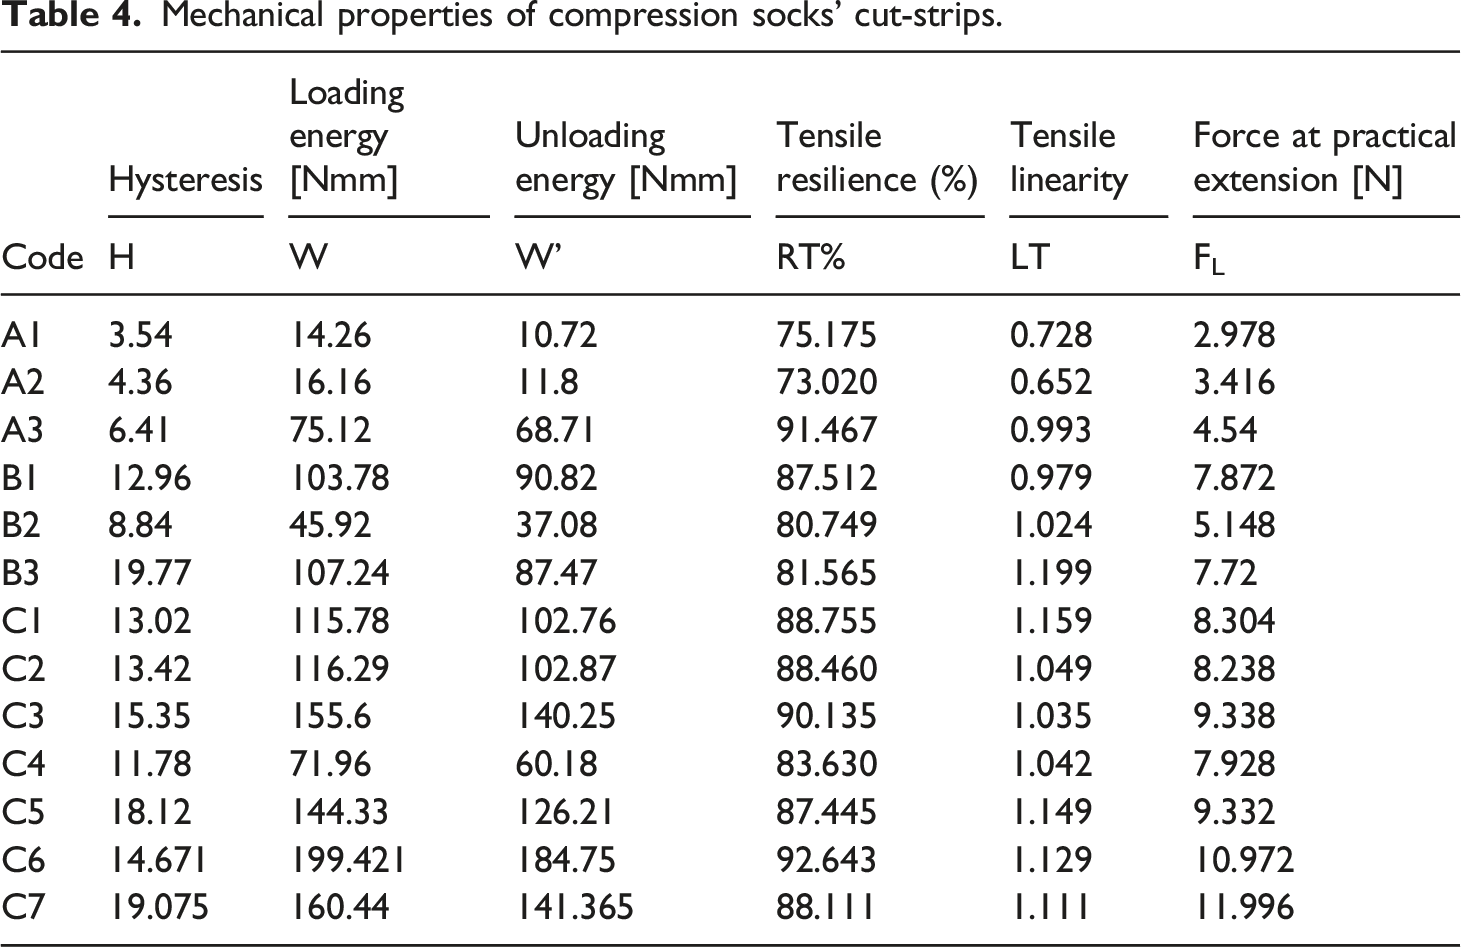
To examine the mechanical performance under tension, a five cycle extension-relaxation setup between zero extensions and practical stretch ratios at the prescribed load of 5 kN was used to study the dynamic tension behavior. The loading (5th cycle extension) and unloading (5th cycle relaxation) behavior at practical extension conditions for the gauge length (50 mm) was obtained for all of the 13 socks samples and the mechanical characterization of compression socks at the ankle portion were measured. The measurements include force at practical extension conditions for the circumference of the leg (Figure 9) and tensile indices value measurements at 5th cycle (Table 4). Force compared to the practical extension diagram is given below in Figure 9. Force extension diagram at practical extension. Mechanical properties of compression socks’ cut-strips.
Here is a description of all parameters in notation. Gauge length/initial length/original length is denoted by “ℓo,” strips extended to practical elongation concerning gauge length (50 mm) are notated as ‘Δℓ’ (extended length/change in original length) while the total length, “ℓ” named as final or total length as the sum of gauge length and extended length (ℓ = ℓo+ Δℓ). The difference between total length and gauge length named as extended length (Δℓ = ℓ-ℓo).
Equation (7) calculates practical elongation by taking into account the circumferences of the leg and of the socks at the ankle portion. Here, the leg circumference is fixed at 240 mm, but each sample of socks has a different ankle circumference, which affects the force of extension at a given practical elongation (extension level). Figure 9 showed that due to the various parametrical and dimensional parameters, the practical extension force’s intensity differs for each sample of socks.
Here the Table 4 depicts the tensile indices values obtained from the force at the practical extension curve (Figure 9). These tensile indices parameters such as loading energy (equation (2)), unloading energy (equation (3)), hysteresis (equation (4)), tensile resilience (equation (5)) and tensile linearity (equation (6)) were measured to compare their influence on the intensity of the compression pressure.
Statistical analysis
All the testing results were statistically analyzed using simple regression analysis. Regression analysis is the statistical tool used to define the data point’s distribution by using the least-squares estimation method which derives the regression equation by minimizing the sum of the square of errors. The best-fit line is the regression model line. This regression line passing through data points gives us a regression model that helps to determine how well the independent variable explains the dependent variable. Regression results help to identify the direction, size, and statistical significance of the relationship between a predictors and responses. Regression equation provides ‘best’ fit line to examine how the response variable is changed by changing the predictor value as well as to predict the value of the response variable for any predictor value. To determine a relationship between any of two variables, Pearson correlations (r) and coefficient of determination values (R2) were computed with a significant threshold set at p < 0.05.
Results and Discussion
In this scientific research work, the tensile properties of socks’s cut strips were statistically compared with experimental pressure and force at practical extension. These tensile properties include hysteresis (H), loading energy [Nmm], unloading energy [Nmm], tensile resilience [%] and tensile linearity (TL). To determine a relationship between any of two variables, Pearson correlations (r) and coefficient of determination values (R2) were computed with a significant threshold set at p < 0.05.
Force at practical extension compared to experimental pressure
Figure 10 portrays the effect of force at the practical extension on experimental pressure (Ps). The practical force of extension is the function of compression pressure exerted by compression socks. This function of exertion is defined mainly by Laplace’s law and various researchers. The contribution of the force at the practical extension to compression pressure was statistically analyzed using simple linear regression analysis. Regression analysis is a statistical technique that used to define the data point’s distribution by using a best-fit regression line considering the minimum sum of the square of errors. This regression line passing through data points gives us a regression model that helps to determine how well the independent variable (force at practical extension) explains the dependent variable (experimental pressure). Force at practical extension compared to experimental pressure.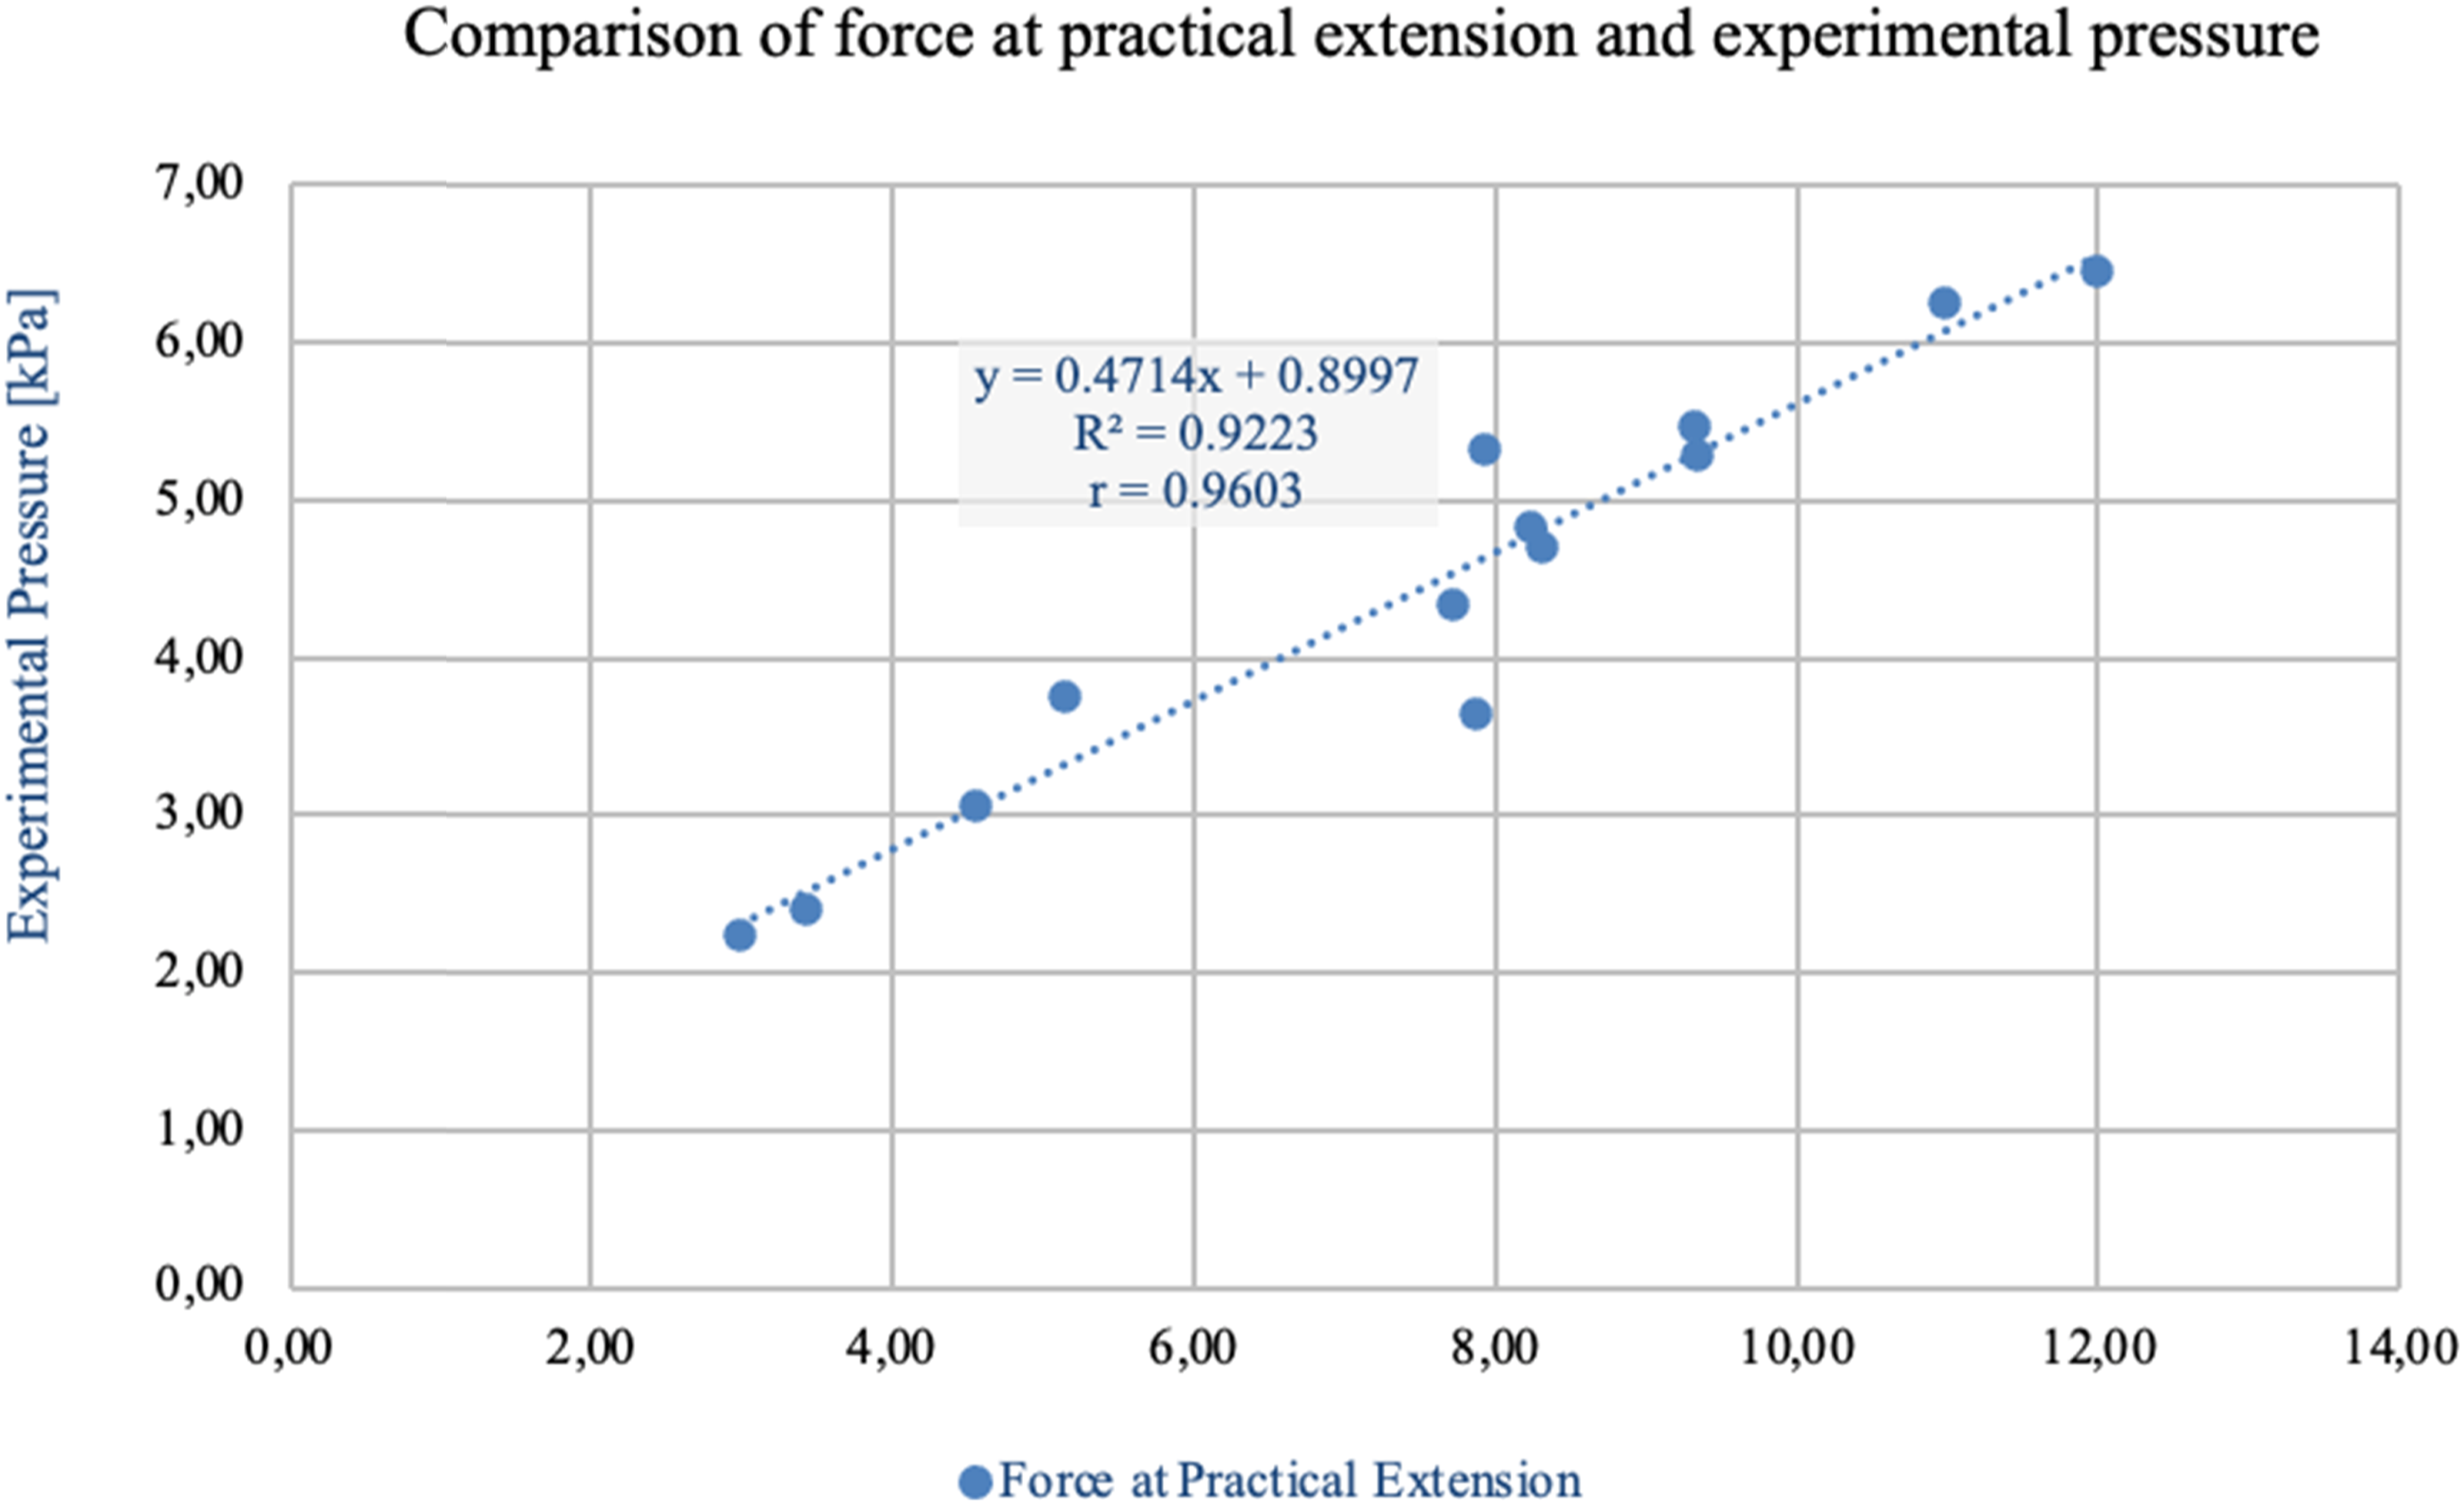
Statistical results shown in Figure 10 have revealed that force at practical extension imparts a significant influence on the intensity of compression pressure. It was quantified based on the coefficient of determination values (R2 -value = 0.9431). This R2 -value depicts that the intensity of pressure exertion depends about 94.31% on the practical force of extension [N]. The regression model (Figure 10) also comprised of two more important coefficients explaining the nature and trend of the regression line. These regression coefficients are named y-intercept (0.8997) and slope value (0.4714). Here y-intercept value (0.8997) means the regression line intercepts the y-axis at 0.8997 which is very closer to the origin of axes while the slope gives the rate at which the dependent variable can be explained by the independent variable. The slope values (0.4714) also indicated that experimental pressure will increase by 0.4714 kPa for every increase in 1 unit of force at practical extension. The correlation value between the force of practical extension and experimental pressure were also measured (by using r = 0.9603) which also shows a direct positive relationship between the two mentioned parameters. The reason for the dependency of the practical extension [mm] on compression pressure is mainly due to cut-strips areal density (fabric weight).
Hysteresis
Figure 11 illustrates the statistical relationship between force at practical extension (FL), hysteresis (H) and experimental pressure (PS). But it was necessary to relate how hysteresis (H) values of the all the socks samples explains the experimental pressure (Ps) and force at practical extension. Hysteresis and force at fixed extension compared to experimental pressure.
5Figure 11 Portrays that hysteresis value of each sample explain 74.7% the experimental pressure values. The strength of the significance was measured on the basis of the coefficient of the determination values (R2 value = 0.747) and correlation coefficient (r = 0.864; strong positive Pearson correlation coefficient) using second order polynomial fitting line in regression analysis. It also portrayed that hysteresis has a very strong relationship with force at practical extension values. The extent of dependency was computed based on the coefficient of the determination value (R2 = 0.8297) and direction of the relationship using Pearson correlation coefficient (r = 0.910; strong positive correlation). This shows that hysteresis values of all samples explain the 82.97% to force at practical extension.
Loading energy
Figure 12 represents the relationship between the force of practical extension (FL), loading energy (LE), and experimental pressure (PS). The extent of the dependency was measured on the basis of the coefficient of the determination values (R2 -value) and Pearson correlation coefficient(r). As the loading energy increases, the area under the loading curve increases which increases the intensity of experimental pressure (Ps). The greater the tensile energy and tensile strain, the easier the fabric deforms in stretch loading.
30
Higher deformation causes higher recovery of fabric to return to its original position ultimately increasing the intensity of compression pressure. The strength of the relationship between loading energy (as predictor) and experimental pressure (response variable) was R2 = 0.7794 and r = 0.882. While extent of the relationship between loading energy and force at practical extension was R2 = 0.8765 and r = 0.936. These R2 and r values represents that loading energy explains the experimental pressure about 77.94% and correlation value r = 0.936 (strong positive relationship) while to force at practical extension explains the loading energy about 87.65%. Loading energy and force at fixed extension compared to experimental pressure.
Unloading energy
Figure 13 reflected the relationship between unloading energy (UE), force at practical extension (FL) and experimental pressure (Ps) of all 13 socks samples. Figure 15 also replicated that unloading energy (UE) has a direct relationship with the experimental pressure (Ps) which means as the unloading energy (UE) increases the compression pressure (Ps) value increases. Unloading energy and force at fixed extension compared to experimental pressure.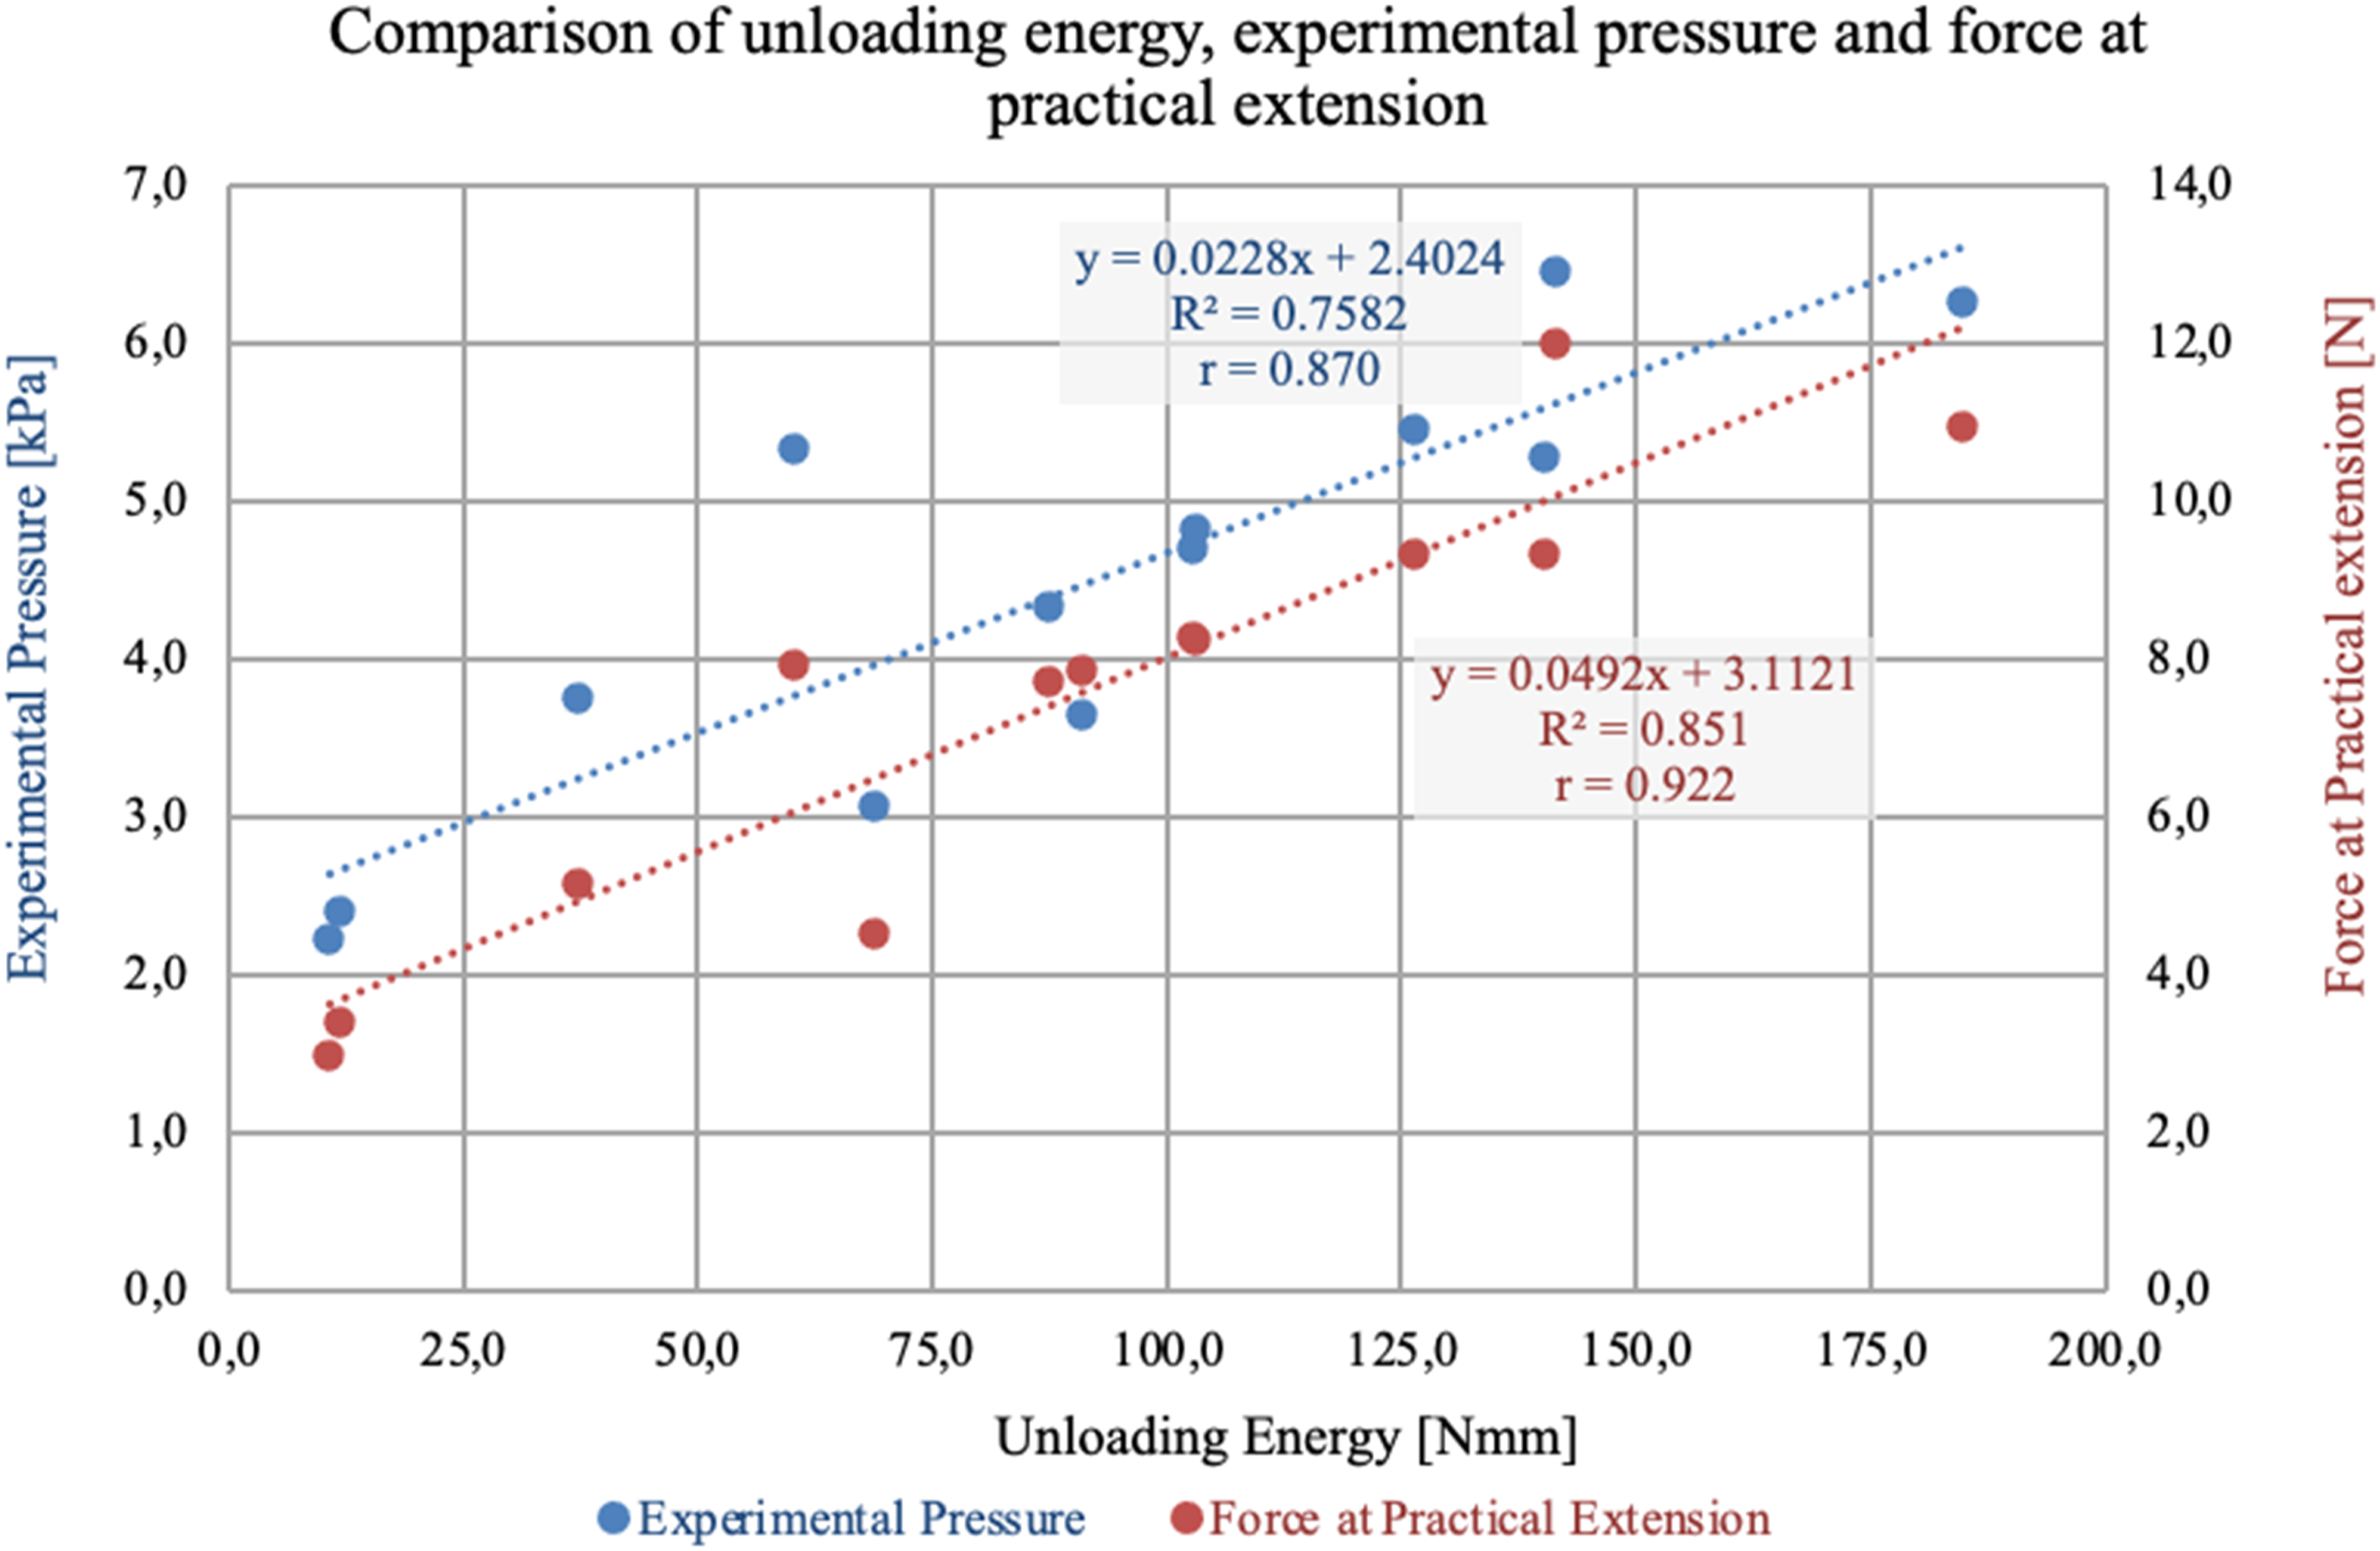
Simple linear regression analysis was also conducted to observe the strength of the influence by the unloading energy (UE) on force at practical extension (R2 -value = 0.851 and r = 0.922) and experimental pressure (R2 -value = 0.7582 and r = 0.870) by measuring the coefficient of the determination value and correlation. These values portray that unloading energy (UE) explains experimental pressure about 75.82% and to force at practical extension 85.1% simultaneously.
Tensile resilience
Figure 14 represented that by increasing the value of the tensile resilience (TR), the pressure value (Ps) and force at practical extension value increases quadratically. The extent of the relationship between predictor; TR was measured based on coefficient of the determination values (R2 value). Simple quadratic regression analysis represents that the strength of the relationship between tensile resilience compared to experimental pressure R2-value = 0.511, r = 0.714) and to force at practical was R2 -value = 0.5563, r = 0.745. These values depict that tensile resilience of the socks’s cut-strips explains 51.1% to experimental pressure and 55.63% to force at practical extension. Tensile resilience and force at fixed extension compared to experimental pressure.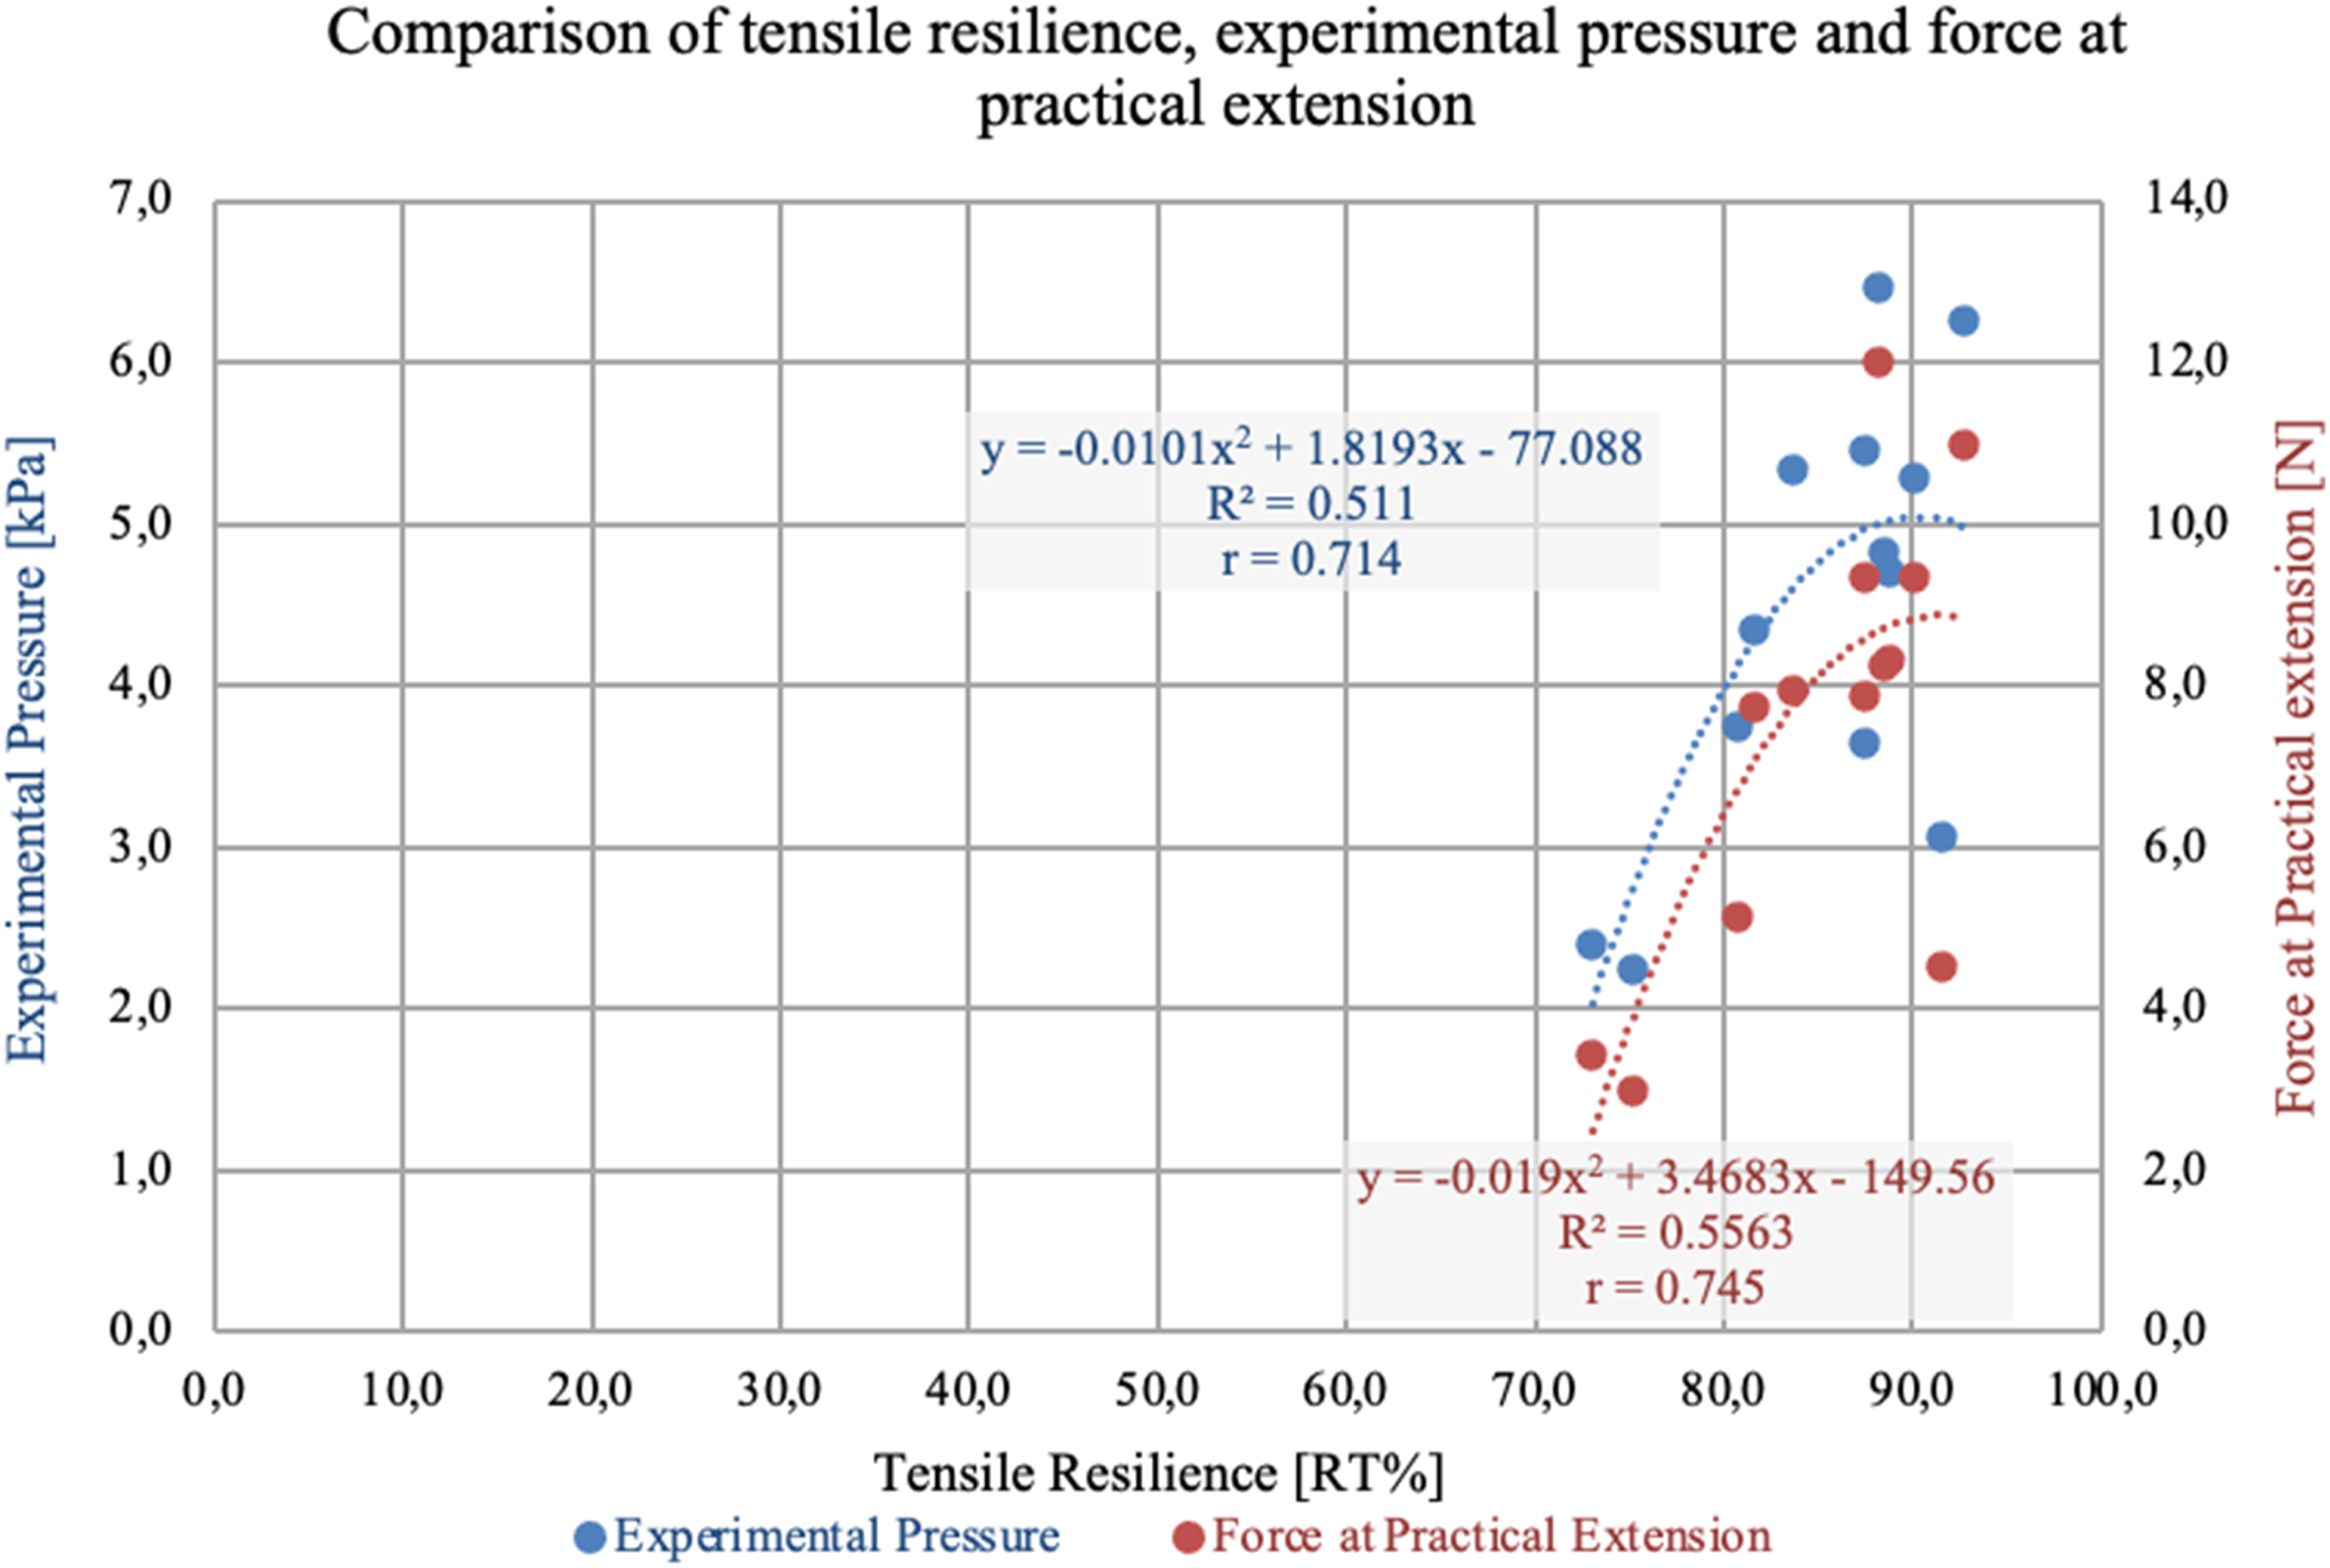
Tensile linearity
Figure 15 Comprised of the relationship between forces at practical extension, tensile linearity, and experimental pressure. To understand their mutual dependency, linear regression analysis was conducted to quantify it. Figure 15 portrays that the tensile linearity explains experimental pressure to 59.92% based on the coefficient of the determination values (R2 -value = 0.5992, r = 0.773). While it explains to force at practical extension about 58.85% based on the coefficient of the determination values (R2 -value = 0.5885, r = 0.7671). Tensile linearity and force at fixed extension compared to experimental pressure.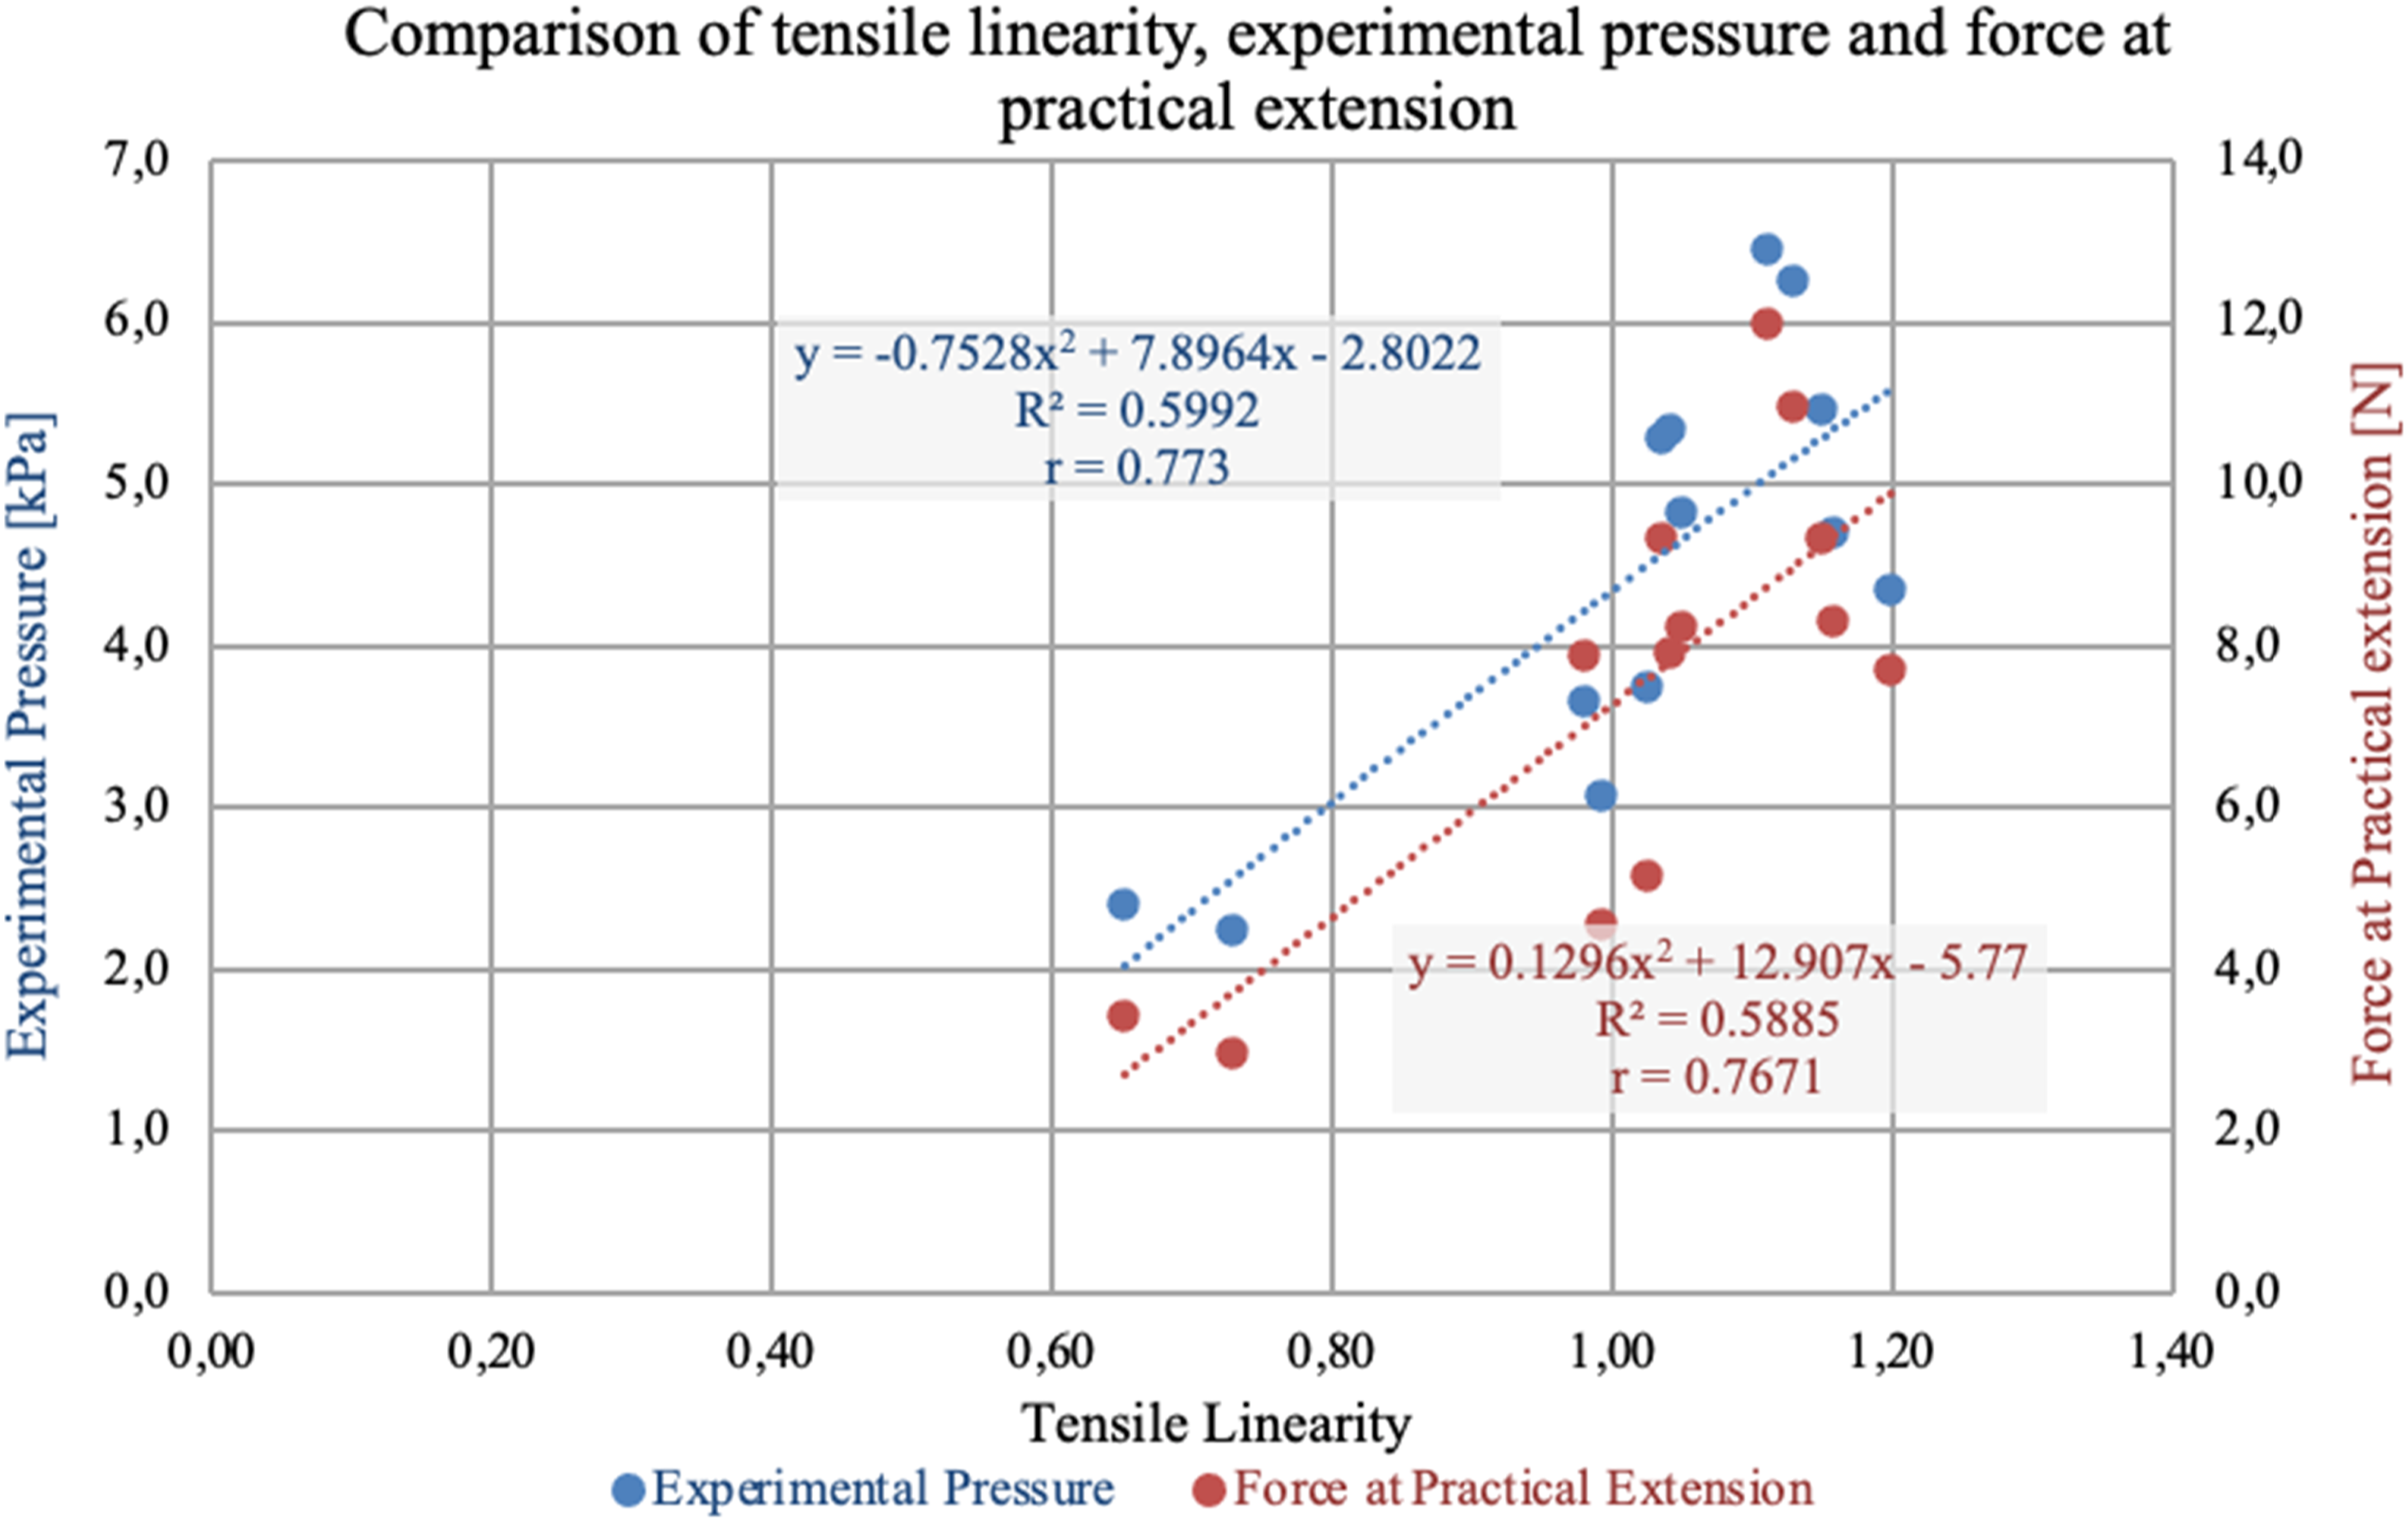
Conclusions
Tensile characterization of the compression socks is of great importance that helps to understand the engineering of compression socks and how these play a role to exert adequate pressure to avoid the insufficiency and reversibility of blood flow. This scientific research was conducted on the wooden leg rather than the human leg to highlight the engineering of these socks not for the treatment of diseased leg. Also, there are various reasons to select the wooden leg, ankle part, and practical extensibility comparable to circumference of the leg at ankle portion. Tensile properties of compression socks are also of great importance to describe the engineering of compression socks. Many of these directly relate to present the intensity of exertion of compression pressure especially Hysteresis, loading energy, unloading energy, tensile linearity, and tensile resilience.
In this scientific result, it was concluded that
Force at practical extension (FL) values context to the circumferential difference between the socks and leg at the ankle portion have a strong relationship with the values of the experimental pressure (Ps).
Tensile indices: especially hysteresis (H), loading energy (LE), unloading energy (UE) combined with the force at practical extension (FL) depicts a strong relationship on compression pressure. While tensile resilience and tensile linearity also portrays a significant relationship between force at practical extension and experimental pressure.
Footnotes
Declaration of conflicting interests
The author(s) declared no potential conflicts of interest with respect to the research, authorship, and/or publication of this article.
Funding
The author(s) received no financial support for the research, authorship, and/or publication of this article.