
Abstract
The sound insulation of the front wall of a car is mainly used to isolate the noise of the engine from being transmitted to the passenger cabin. A front wall is generally a kind of structure of Absorber-Barrier-Absorber (ABA), where A is sound absorption layer and B is sound insulation layer. The sound absorption layer (A) usually consists of porous cotton of superfine fiber or microfiber. In this paper, kapok fiber is used to make the sound-absorbing layer A, and its sound absorption is compared with that of superfine fiber. Microstructure of the two fibers is compared, and it is found that kapok fiber has a large hollow structure. The sound absorbing coefficients of the layer A made with the two fibers are measured and it is concluded that the layer A made of kapok fibers can absorber noise greatly and thus has high sound absorption coefficient. The prototypes of ABA structural are made using two kinds of fibers as layer A, and the sound transmission loss (STL) was measured using reverberation room and anechoic room. The measurement shows that the ABA using kapok fiber as sound absorption layer has better sound insulations, and the STL of ABA using kapok fiber as sound absorption layer is increased by about 3 dB. A model for estimating STL of ABA structure is established and the calculated STL is validated. Using the developed model, the STL of ABA structures with different structural characteristics of Layers A or B is calculated and analyzed.
Keywords
Introduction
Automotive sound package is an effective way for reducing noise transmitted to car cabin. The anti-fire wall between passenger compartment and engine compartment is an important sound package component to reduce cabin noise and to reduce heat transmitted from engine compartment to cabin. The structure of anti-fire wall is a kind of ABA (sound Absorption layer; sound Barrier layer; sound Absorption layer) structure, in which the sound absorption layer (layer A) is made of porous fiber materials, and the sound barrier layer is made from polyethylene (PE) film. Layer A is usually made of porous fiber materials and is mainly used to absorb sound, layer B is usually made of PE film and is used to insulate sound.1–3 Acoustics performances of an Absorber-Barrier-Absorber (ABA) structure are determined by the sound absorption layer A that is to consume sound transmitted energy and the sound insulation layer B that is used to barrier sound transmission to reduce cabin noise. Therefore, the Sound Absorption Coefficient (SAC) of layer A and the Sound Transmission Loss (STL) of ABA structure are important performance indexes of ABA structures.
Fiber materials used to make the sound absorption layer (Layer A) are usually synthetic fibers or natural fibers.4,5 Synthetic fiber is widely used in noise absorption since it is easy to be processed and easy to produce. In contrast, natural fiber6–9 is an environment-friendly fiber material, and the sound absorber layers made of natural fiber and other materials have larger SAC where the original characteristics of natural fibers are remained.
The acoustics characteristics of synthetic fibers are investigated by following researchers. At present, polyester, nylon, polypropylene and acrylic fibers are commonly used synthetic fibers in the automobile industry. Lee and Park 3 analyzed the influence of the synthetic PET fibers with different cross-section shapes on sound absorption and insulation properties. The experimental results show that the SAC increases with the increase of shape factor if the density is the same. Effects of three different bonding processes, namely thermal bonding, chemical bonding and thermochemical mixed bonding, on sound absorption are studied by Sakthivel et al. 6 It is concluded that the nonwovens bonded by thermochemical bounding have better sound absorption properties than that of the other two bonding technologies. Sakthivel et al.4,6 studied thermal and sound insulation performances of sound absorption layers developed from recycled cotton mixed with polyester (recycled cotton/PET) under ratio of 1:1 for construction industry applications. The result disclosed that the layers made from recycled/PET/cotton waste have more than 70% of SAC. The layers made from recycled waste cotton/polyester nonwoven mats also have adequate moisture resistance at high humidity conditions without affecting the insulation and sound-absorbing properties. Yang et al. 7 studied experimentally the sound insulation of superfine glass fiber felt and coarse glass fiber. It is found that the sound insulation of single-layer, double-layer and three-layer superfine glass fiber felt is equivalent to that of three-layer, five-layer and eight-layer coarse of conventional glass fiber felt, respectively. The method of estimating the number of air layers is given by using the slope of sound insulation versus frequency in this paper.
With the requirements of lightweight design and environmental friendly during processing, natural fibers have gradually used for automobile industries. Kapok fiber is a type of renewable natural fiber, and it is abundant, biocompatible and biodegradable. The potential applications of kapok fibers have received increasing attention in industrials. The acoustics characteristics of natural fibers are studied by following researchers. The structure and properties of kapok fiber are reviewed in Ref., 8 and it includes chemical and physical treatments, kapok fiber-based composite materials, and the application of kapok fiber as an absorbent material for sound, oils, metal ions and dyes. Xiang et al. 8 investigated the sound absorption properties of natural kapok fibers, and influences of bulk density, thickness, fiber length and orientation on the acoustical performances of kapok fibers were evaluated. Results show that the kapok fiber has excellent acoustical performance due to its natural hollow structure, and the SAC of kapok fibrous assemblies are significantly affected by the bulk density, thickness and arrangement of kapok fibers but less dependent on the fiber length. The SAC and specific surface impedance of two-layer, three-layer, and four-layer materials using polyethylene (PE) film as reinforced layer and kapok fiber nonwoven fabrics as sound absorber layers have been studied by in the frequency range of 100–2500 Hz by Liu et al. in Ref. 10 Effects of the layering sequence, thickness of PE film and nonwoven fabrics gradient thickness on sound absorption properties at the low frequency are measured.
Other kind of natural fibers used for sound absorption are investigated. Dhandapani and Megalingam 11 explores the tensile, flexural, impact strengths and sound absorption of a reinforced hybrid fiber layer made from natural sisal and palm fiber. It is concluded that the reinforced hybrid fiber layer made of 20% sisal fiber and 15% palm fiber have larger SAC at 1600 Hz, 2000 Hz, 2500 Hz, 3150 Hz and 4000 Hz, respectively. Liu et al. 12 fabricated sound-absorbing material using natural poplar seed fiber and by hot pressing method, and the effects of mass fraction and bulk density of poplar seed fiber on the sound absorption is investigated. The results showed that the SAC decreased with the increase of seed fiber mass fraction. Chen et al. 13 made a novel sound absorbing material using discarded natural luffa scraps and polyester fibers. The sound absorption of the fabricated material is measured and the influences of density and back air gap distance on the sound absorption measures are investigated experimentally. A sound absorption layer (fibrous mats) using luffa fibrous material is made and its sound absorption properties were investigated in Ref. 14 In the developed layer, kapok was used as middle layer between two layers made of luffa fibrous materials to improve sound absorption. Four fibrous mats with different composition of layers were fabricated using thermal bonding. Influence of addition of kapok/cotton, thickness of mats and air gap maintained in the impedance tube during testing on sound absorption have been studied experimentally.
Sakthivel s et al. 6 analyzed the sound absorption of recycled fiber. The measurement show that the average SAC increases with the increase of nonwoven thickness, but decreases with the increase of nonwoven density.
With the application of fiber materials in automobile interiors, it is important to predict the sound insulation performance in different ways. Ma et al. 15 analyzed the sound insulation characteristics of multi-layer structures using finite element methods. The LMS software is used to calculate the Sound Transmission Loss (STL), and influence of the number of layers of the multi-layer structure on the STL is also analyzed. He et al. 16 established a mixed SEA model taking the acoustic material parameters and thickness of the acoustic package as optimization variables, and regarding the sound pressure level at the driver’s right ear and the total mass of the sound package as optimization objectives, acoustic material parameters and the thickness of sound package are then optimized. The coverage rate of acoustic materials, the thickness of materials, the area density of porous foam and EVA are taken as optimization variables, and the STL and weight of the front wall are optimized using NSGA-Ⅱ algorithm 17
Based on the review of the existed references, it is concluded that in order to enhance the acoustic performance of sound absorption layer, different fiber materials or fibers with different cross sections are used. In the current research for sound absorption of materials, the samples are mostly made from synthetic fiber or mixed with natural fiber, or composite samples made of fibers and PE. The acoustic properties of the samples are usually measured with impendence tube that sound is normal incidence. Few papers presented model for estimating acoustic properties under random incidence or with reverberation chamber and anechoic chamber. Thus the contributions and the novelties of this paper are: (1) The unique large hollow structure of kapok fiber was studied using scan electron microscope, and is compared with structural of superfine fiber. The SAC for kapok fiber layer and superfine fiber layer were measured under random incidence and the data are compared. The STL of different ABA structures using kapok fiber layer and superfine fiber layer as layer A were measured using reverberation chamber-anechoic chamber, and the measured data are analyzed. (2) A model to estimate STL of ABA structure is proposed and is validated. The STL of ABA structure with different layer A are calculated, and the effects of sound absorption layer combination way on STL are analyzed and compared.
Materials and ABA structures
Kapok fiber and superfine fiber
The structures of kapok fiber and superfine fiber are shown in Figures 1 and 2, respectively. It is seen from Figure 1 that the shape of kapok fiber along its length is cylindrical, and the surface is smooth but does not turn. The shape of the cross section of kapok fiber is round or oval, and the interior inside the cross section is filled with air. The average length of kapok fiber is from 15 to 28 mm, and the diameter is from 15∼30 μm. The hollow area versus cross section area ratio is more than 80%, maximum up to 90%, so kapok fiber is one of the highest hollow fibers known at present. Structures photo of kapok fibers. (a) Kapok fibers (b) Kapok fibers seen from SEM enlarged by 500 times. Structures photo of superfine fibers. (a) Superfine fibers (b) Superfine fibers seen from SEM enlarged by 500 times.
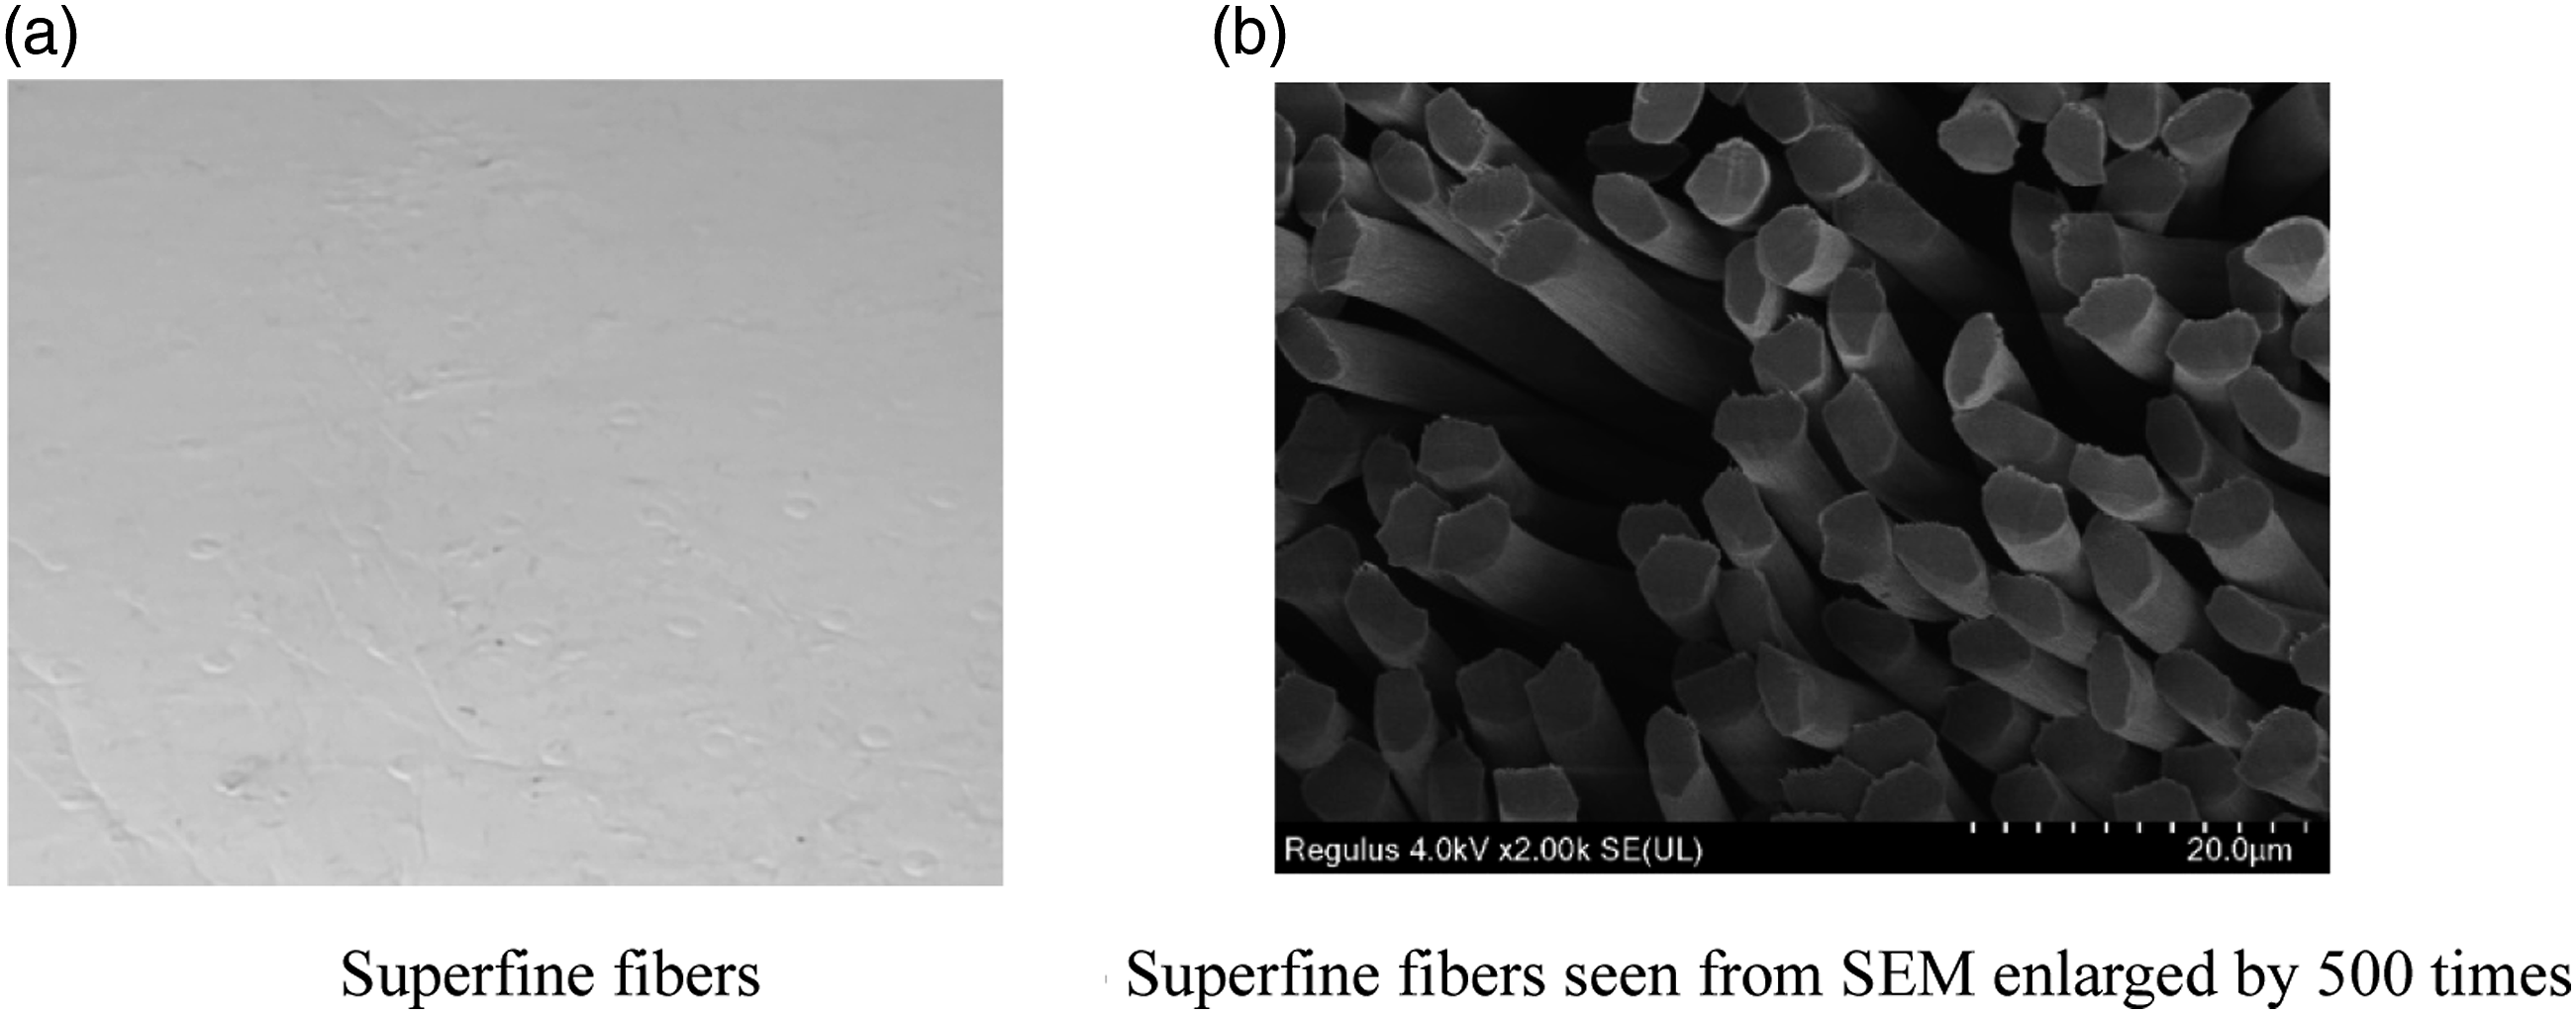
In contrast, it is seen from Figure 2 that the shape of the superfine fibers along its length is flat cylindrical, the diameter is in the range of 5–10 μm, which is smaller than the kapok fiber, it is a kind of polyester fiber, and the surface is relatively smooth compared to that of kapok fiber. The shape of cross section is solid oval, and the fiber thickness is relatively uniform. Compared with superfine fibers, kapok fibers have more hollows inside, so sound transmitted through kapok fibers is not only absorbed greatly through viscosity and but also by friction inside the hollow structures. 18 In addition, kapok fiber is a kind of natural fibers, and it is good at for anti -mildew and anti-moth.
An ABA structure is a typical structure for sound absorption and insulation, sound absorption performance of the sound absorption layer (layer A) is evaluated by the Sound Absorption Coefficient (SAC) under random incidence. The layer A in ABA structure is usually made of kapok fiber or superfine fibers.
In this paper, sound absorption layers (SALs) consisting of kapok fibers or superfine fibers (also named PET fibers) with different thickness are made. One group of SAL has a thickness of 5 mm with area density of 800 g/m2, while the other group has a thickness of 14 mm with area density of 800 g/m2. Under random incidence, the Sound Absorption Coefficients (SAC) of the two groups of SALs were measured and compared.
Absorber-barrier-absorber structures
The structure diagram of an ABA structure is shown in Figure 3. ABA structure diagram.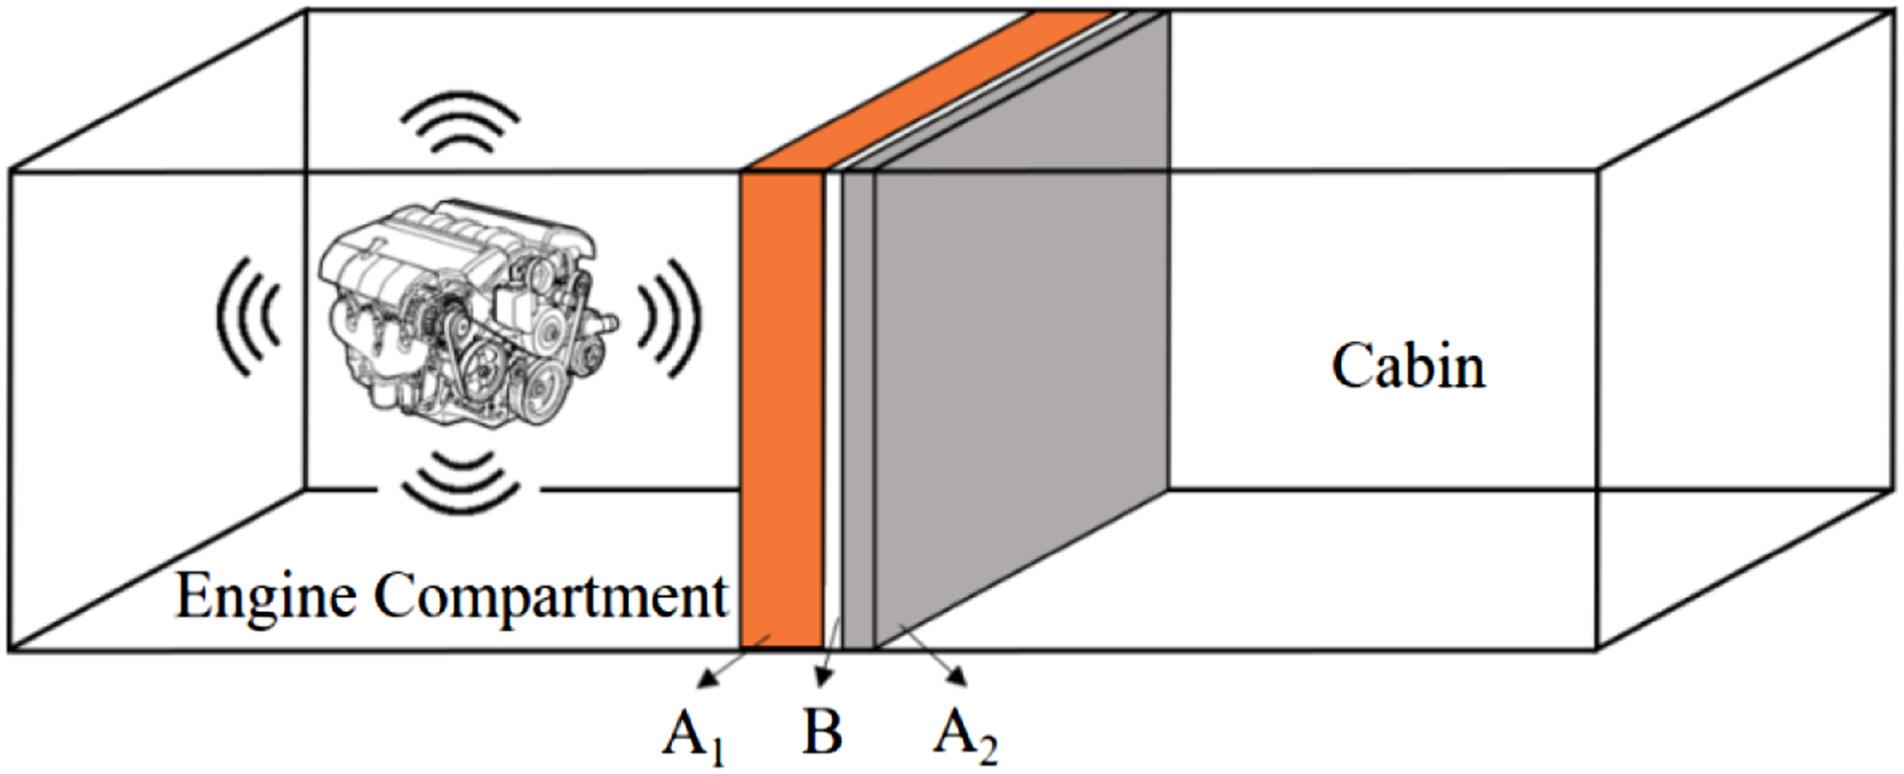
It is seen from Figure 3 that ABA structure consists of three layers: sound absorption layer (A1), sound insulation layer (B) and sound absorption layer (A2). The sound absorption layers are usually made of porous layer or made of fiber materials, and the sound insulation layer is made of PE film. In this study, the A1 layer is assumed to face to engine compartment, and A2 layer is faced to cabin. The layer between layers A1 and A2 and made of thin PE film is named as B layer. The three layers are combined together by glue process. The structure of the layer B may be also designed as kind of metamaterials to perform sound absorption, such as discussed in Ref. 19
Samples S1 and S2 of ABA structure. a

Layer B is a made of PE with thickness of 60 μm and density of 1000 kg/m3.
Methods for measuring materials parameters and STL of ABA structures
Methods for measuring materials parameters
Sound absorption coefficient
Sound absorption performance of the sound absorption layer (layer A) is evaluated by the sound absorption coefficient under random incidence, and sound absorption coefficient is measured in the Alpha cabin reverberation box
20
as shown in Figure 4. Measurement of sound absorbation coefficient under random incidence. (a) Principle diagram of Alpha Cabin (b) Equipment.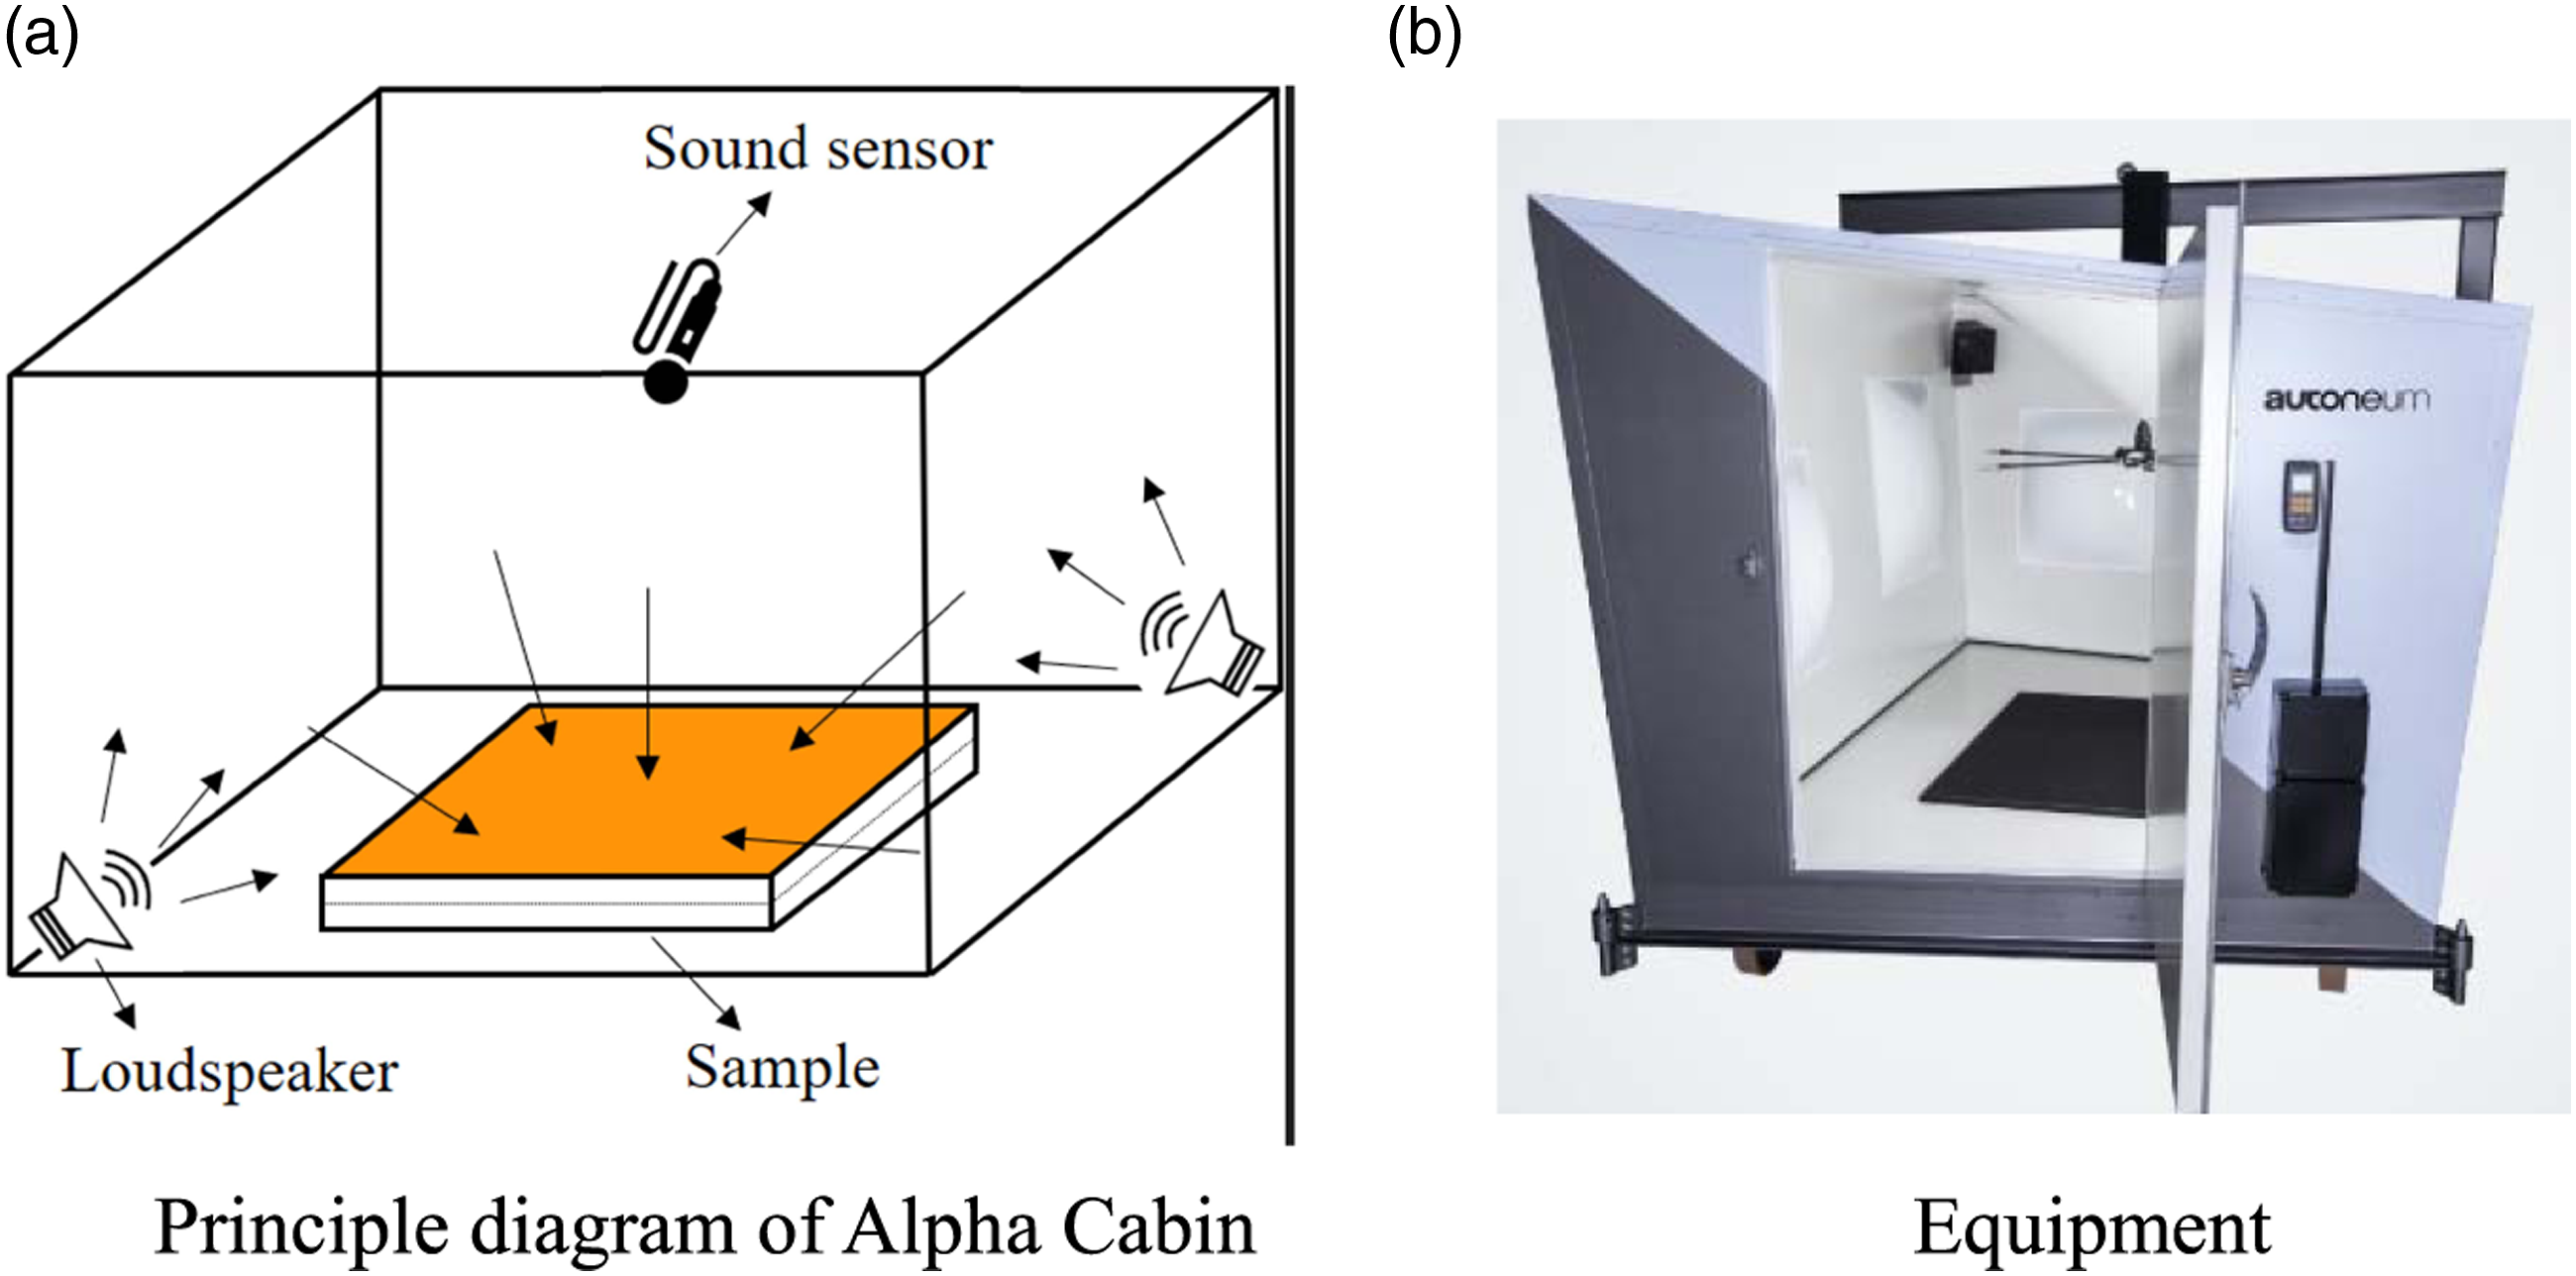
In the measurement, the sample (Layer A) o be measured is placed in the middle of the reverberation box, and a rigid frame is placed around the sample and the bottom of the reverberation box. The gap between the sample and the rigid frame is sealed using gasket ring.
In the measurement, the sound sensor (microphone) is placed on a bracket at the top of the measurement chamber, the bracket rotates around to allow microphone to acuqisize sound pressures at different locations, and then estimates the average sound pressure. Two sound sources are placed at the bottom of the test box, diagonally distributed. The influence of the distance between the microphone and the sound source during measurement is considered and efforts is made to make the influence to be minimum.Sound absorption coefficient is calculated using equation (1):
21

Porosity
Figure 5 shows principle diagram and equipment for measuring porosity. In the measurement, the sample to be tested is placed in the cylinder firstly, the inlet and outlet valves are then closed, and the piston moves down to change the pressure in the cylinder. Principle diagram and equipment for measuring porosity. (a) Principle (b) Equipment.
The porosity of the sample is calculated according to the changes of pressure and volume in the cylinder before and after the piston moves down. Porosity(
Flow resistances
Figure 6 shows the principle diagram and equipment for measuring flow resistances. The sample to be tested is placed in cylinder, the air is pressed to pass through the sample, and the air pressures on both sides of the sample are acquired. Flow resistance (σ) is then estimated by equation (3): Principle diagram and equipment for measuring flow resistances. (a) Principle (b) Equipment.

Using the measured sound absorption coefficient, porosity and flow resistance as input parameters and using FOAM-X software, the tortuosity (


Methods for measuring STL for ABA structures
The Sound Transmission Loss (STL) of an ABA structure is measured in the reverberation chamber -anechoic chamber according to standard of ASTM E2249-2016,
23
and the measurement error is less than 2 dB according to ASTM E2249-2016. The measurement principle is shown in Figure 7(a). It is seen from Figure 7 that the sound sources is placed in the reverberation chamber, and the average sound pressure in the reverberation chamber is obtained by averaging sound pressure form the five microphones. In the anechoic chamber, sound intensity probe is used to measure the average sound intensity on the surface of the sample to be measured. A steel plate with 0.8 mm thickness is existed between the reverberation chamber and the anechoic chamber, and the sample to be tested is fixed on the steel plate. Measurement of STL of ABA structures. (a) Schematic diagram of reverberation chamber -anechoic chamber (b) Reverberation chamber (c) Anechoic chamber and the sample between reverberation chamber and anechoic chamber.
The Sound Transmission Loss (STL) of the sample is calculated using equation (7):
24

Measured materials parameters and STL of ABA structure
Measured physical parameters
Physical parameters for layer A with 5 mm thickness and with different fibers.

Physical parameters for layer A with 14 mm thickness and with different fibers.

It is seen from Tables 2 and 3 that the viscosity characteristic length and thermal characteristic length of kapok fiber felt are very close to that of superfine fibers if the thickness of the felt equal to 5 mm. But if the thickness of the felt equal to 14 mm, the viscosity characteristic length and thermal characteristic length of kapok fiber felt are much greater than those of superfine fibers. The reason is that kapok fiber is soft with poor fiber stiffness, When the material is pressed into a thin layer of 5 mm, the large hollow structure of the kapok fiber is disappeared and became a flat fiber, so it has similar pore length with the superfine fibers in 5 mm thickness in microstructure.
Sound absorption coefficient of different fibers
SAC of layer A with 5 mm thickness and different fibers
The measured Sound Absorption Coefficient (SAC) of 5 mm thickness SALs consisting of kapok fiber or superfine fiber are shown in Figure 8. It is seen that the sound absorption coefficient of kapok fiber increases firstly with the increase of frequency, and the largest sound absorption coefficient is 0.6 at 2000 Hz; With the increase of frequency, the sound absorption coefficient decreases slightly and tends to be stable data. Sound absorption coefficient of layer A with 5 mm thickness.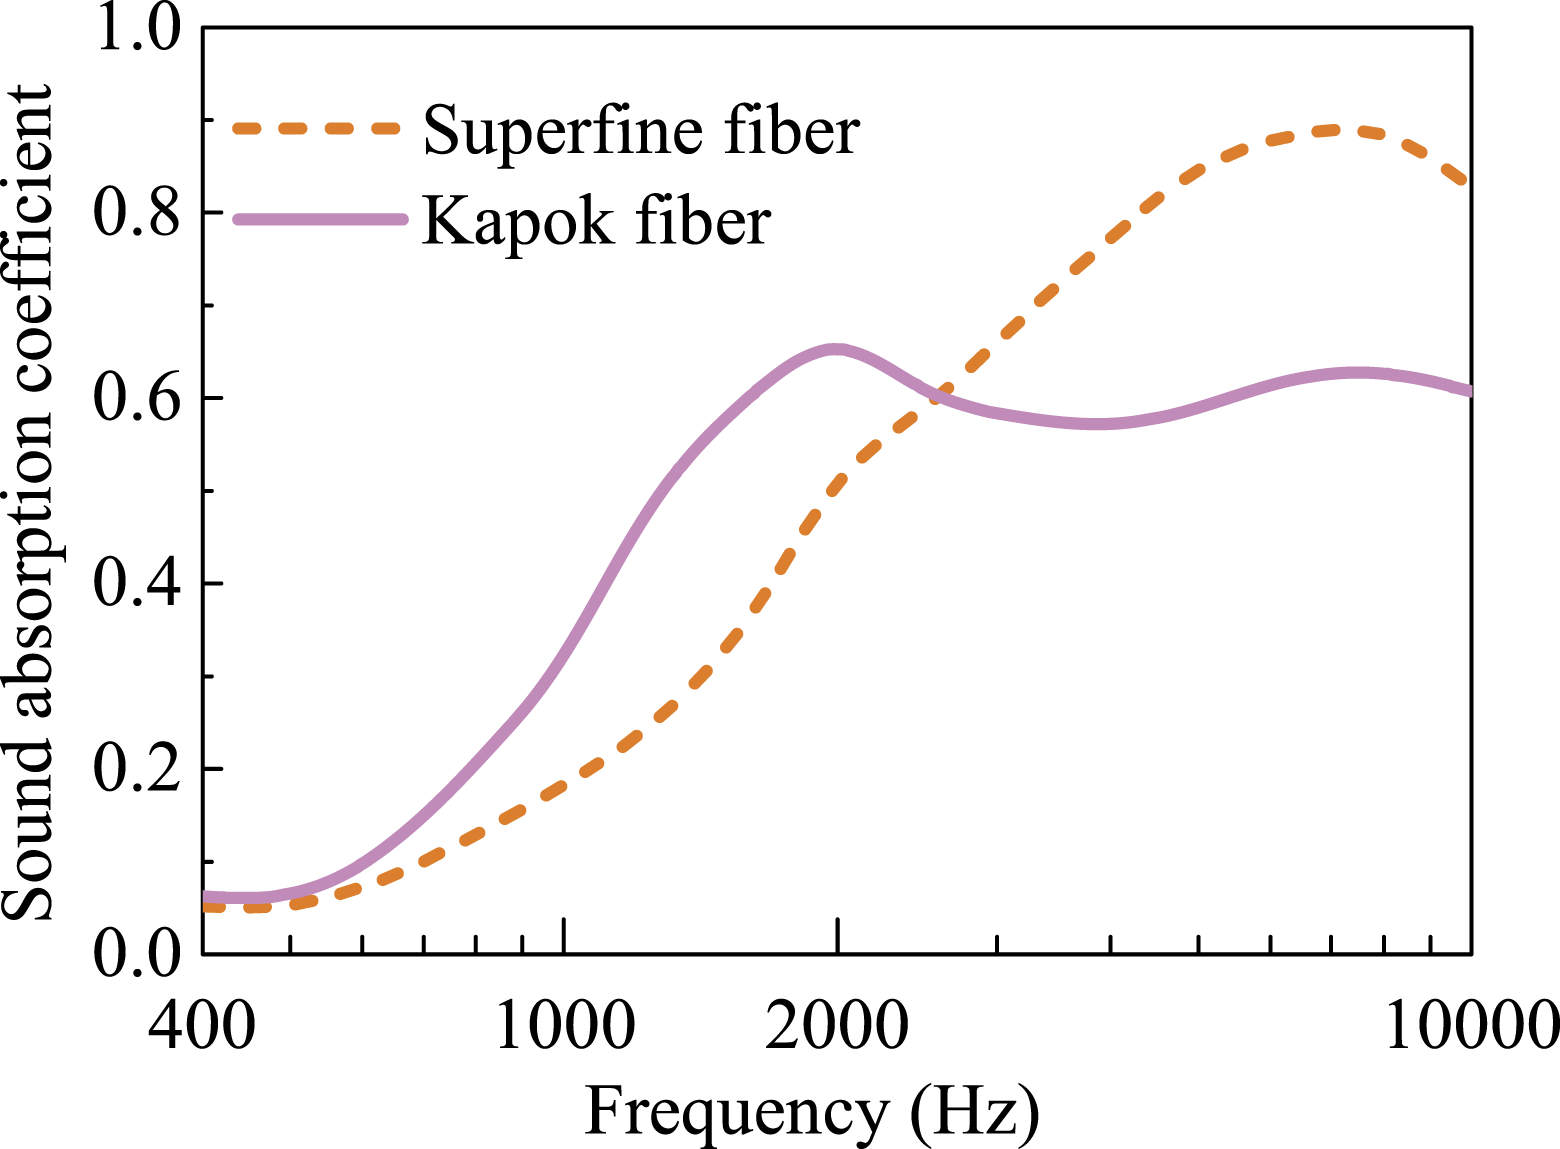
The SAC of superfine fiber also increases firstly with the increase of frequency. SAC reaches to the highest in 6300 Hz, and then decreases with the increase of frequency. The average SACs at center frequency of 1/3 octave for the two fibers are calculated, and are equal to 0.41 and 0.44, respectively. The results show that the average SAC of kapok fiber felts is slightly lower. However, considering the SAC versus frequency, if kapok fiber is used in sound absorption layer (layer A) of ABA structure, sound absorption at lower-to medium- frequency will increase greatly with less thickness, which is good for enhancing sound insulations of ABA structures.
The average SAC at center frequency of 1/3 octave is defined using equation (7):
It is seen from Table 2 that the flow resistance of kapok fiber in layer A of ABA structure is greater than that of superfine fiber. To analyze this reason, the fiber deformation in kapok fiber is observed by SEM, and the structure of kapok fiber is shown in Figure 9. Structure of kapok fiber in layer A in ABA sample from SEM enlarged by 500 times.
It is seen form Figure 9 that the hollow structure of kapok fiber is flattened during the forming process of Layer A. This is due to the pressure of kapok fibers resulting from structural changes during high temperature molding. Because the fibers in the Layer A made of kapok fiber are flattened, the flow resistance becomes larger, the incident sound is difficult to enter the fibers, and the high frequency sound energy cannot be consumed through viscosity and friction, resulting in little sound absorption at high frequency. However, due to the flat shape of the kapok fiber, it could improve the sound insulation performance if A2 layer of ABA material has high flow resistance.
SAC of layer A with 14 mm thickness and different fibers
The measured Sound Absorption Coefficients (SAC) of Layer A made of kapok fibers and superfine fibers with a thickness of 14 mm are shown in Figure 10. Sound absorption coefficient of layer A with 14 thickness.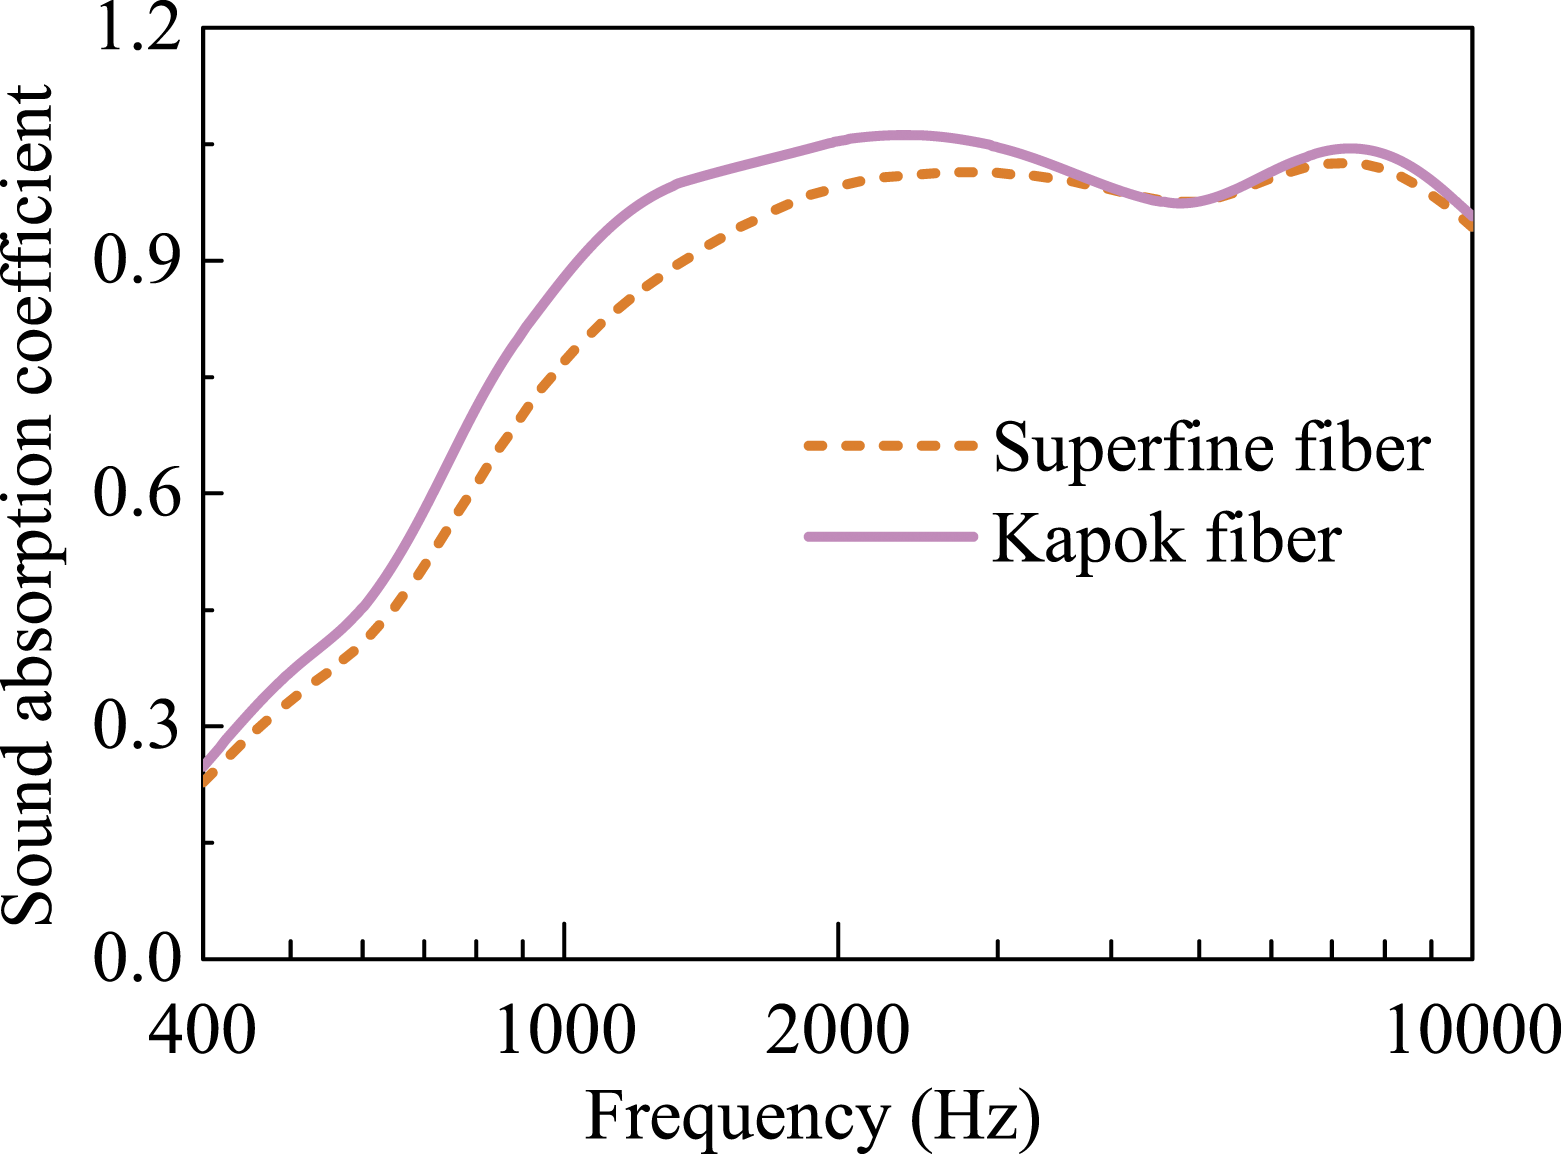
It is seen from Figure 10 that the SAC of the two fiber increases gradually with the increase of frequency, reaches the maximum value at 2500 Hz, and then fluctuates slightly with the increase of frequency after 2500 Hz. The average SACs estimated using equation (8) of the two fiber are equal to 0.78 and 0.74, respectively, and the SAC of Layer A made of kapok fiber is increased by 0.04. It is also seen from Figure 10 that the SAC versus frequency curve that using kapok fiber as sound absorption layer (Layer A) can enlarger sound absorption at medium to high frequency range.
It is from Table 3 that the thermal- and viscous- characteristic length of kapok fiber are much greater than those of superfine fiber with the same thickness and area density, but the sound absorption of kapok fiber layer is better than that of superfine fiber layer. The results demonstrate that kapok fiber layer consume more sound energy.Its sound absorption can be improved or keep same level by reducing the surface density
STL of ABA structures with different A layers
The STL of sample S1 and S2 is measured using reverberation chamber- anechoic chamber, and the measured STL are shown in Figure 11. Sound transmission loss of the two ABA samples.
It is seen from Figure 11 that if kapok fiber is used to make layer (A) of ABA sample, the STL at high frequencies can be enlarged greatly. The maximum STL is 48 dB, but the STL at lower frequencies is lower that of ABA with superfine fiber as layer A.
To compare the STL of S1 and S2 samples, the average STL at the center frequencies of 1/3 octave is calculated using equation similar to equation (7) and are equal to 19.73 dB and 16.93 dB, respectively. It is seen that the STL of S1 sample is increased by about 3 dB.
It is seen from Figure 11 that there is a valley value of STL versus frequency relationship. The STL’s valley is caused by the resonance of the double wall structure. There is a steel plate between the reverberation chamber and the anechoic chamber. The steel plate and A2 layer of ABA structure are regarded as double walls. There is A1 layer which is soft and low density between the steel plate and A2 layer, this structure can be regarded as a spring mass system since the air space has mass and stiffness. If the frequency of the incident sound wave is close to the natural frequency of the double wall structure, it will resonate, thus the STL at this frequency is turned into negative.
Modeling of STL of ABA
Model for estimating STL of ABA
Young’s modulus and damping loss factor of fibers.

The STL of ABA structures is calculated by NOVA software, and the model is shown in Figure 12. The calculation steps are as follows: Sound insulation calculation model.
(1) Define the material properties of layers A and B. The layer A made of fiber is modeled with elastic model. The parameters required for elastic model are: acoustic materials parameters (such as flow resistance, porosity, and tortuosity), viscous characteristic length and thermal characteristic length, mechanical parameters (such as density, thickness, Young’s modulus and damping loss factor). The layer B made of PE is characterized with impervious screen model, and the model parameters are: density and thickness. The parameters of steel plate are young’s modulus, damping loss factor and thickness.
(2) Define the laying sequence and boundaries. Starting from the sound source side, laying sequences are defined as: steel plate, air gap (1 mm), A1 fiber layer, B layer and A2 fiber layer. The end boundary is an infinite cavity. The length and width of ABA sample are 0.508 m, and the incident angle is set to 0–90°.
Finish transfer matrix method (FTMM) algorithm
24
is used for calculation STL of ABA, and the calculated STL is shown in Figure 13. Sound insulation calculation results of sample S1 and S2.
It is seen from Figure 13 that the STL versus frequency for S1 and S2 samples decreases firstly and then increases with the increase of frequency. To validate the proposed model, the calculated and the measured STL of S1 and S2 samples are compared in Figure 14, and it is shown that there is a good agreement between the calculation and the measurement STL if the frequency is above 630 Hz. Comparison of calculated and measured STL for sample S1 and S2. (a) Calculated versus measured STL of sample S1 (b) Calculated versus measured STL of sample S2.
The average STL of S1 and S2 samples estimated using equation (8) are equal to 19.35 dB and 16.77 dB, respectively. In the frequency range of 200 Hz to 630 Hz, the error existed but the curve trend is the same. In the calculations, the porosity and flow resistance of fibers is obtained from many measurements with different samples, and then averaged the measured parameters are used. and it is concluded that the established model can be used to predict the STL of ABA structure.
Influences of layer A on STL of ABA
Influence of layers A1 and A2 on STL of ABA structure
Layer A characteristics of ABA structures for sample S3 and S4. a

aLayer B is a made of PE with thickness of 60 μm and density of 1000 kg/m3.
The calculated STLs for ABA structures named with S1 to S4 is shown in Figure 15. It is shown that STL of the four ABA samples with different layers A1 and A2 decreases firstly and then increases with the increase of frequency. The average STL for S1, S2, S3 and S4 ABA structures are 19.35 dB, 16.77 dB, 18.52 dB and 17.63 dB, respectively. Calculated STL of sample S1 to S4 of ABA structures.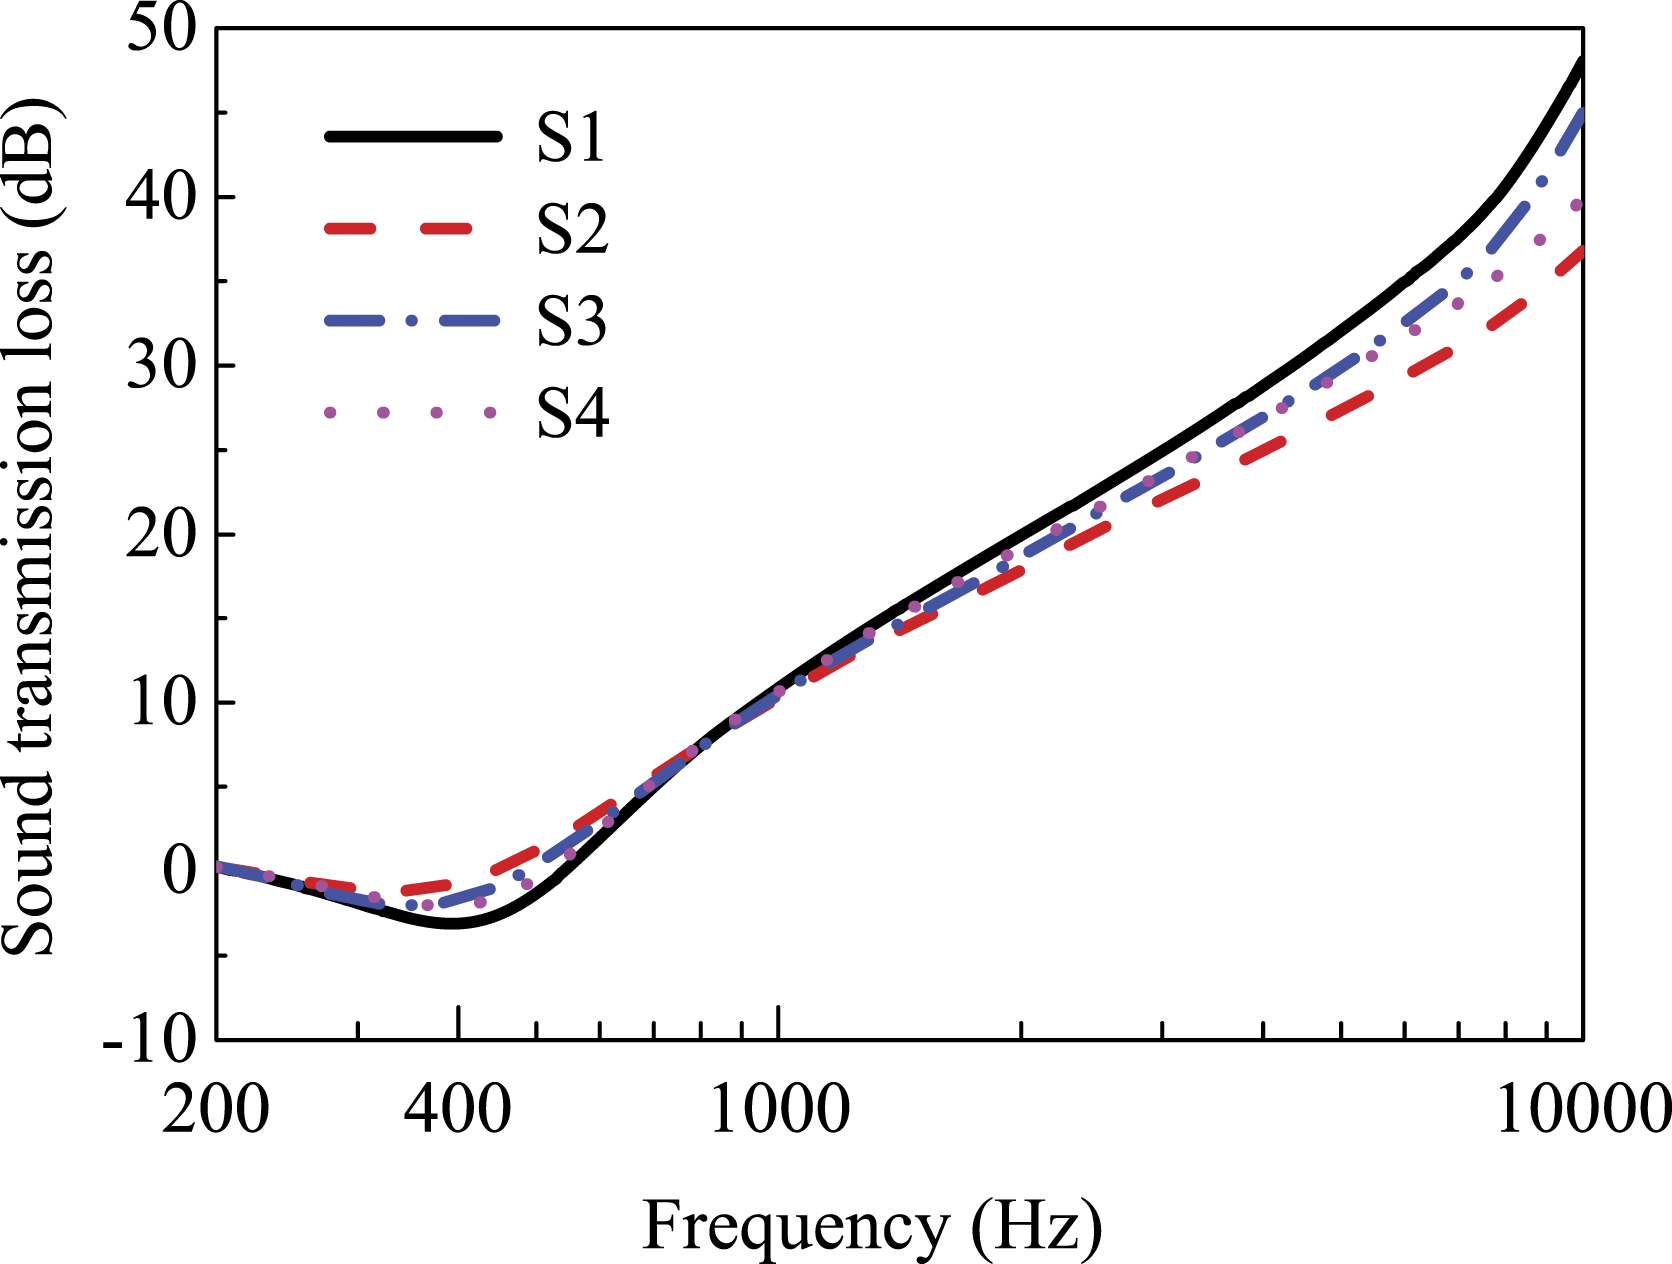
By comparing STL of S1 and S3 samples, it is seen that increasing flow resistance of layer A2, the STL of ABA increases since the A1 layers for S1 and S3 are the same, and the surface density for layer A2 of S1 and S3 is the same. The similar conclusion that increasing flow resistance of layer A1 the STL of ABA increases is also obtained by comparing STL of S2 and S3 samples.
It is also seen from Figure 15 that STL of ABA is increased if kapok fiber is used as layer A in ABA structures. If the A1 and A2 layers of ABA structure are all made of kapok fiber, the STL at high frequency is the increased, and the maximum STL is to 48 dB.
Influences of thickness of A1 on STL of ABA structure
Physical parameters for kapok fiber with 8 mm thickness.

Layer A characteristics of the ABAs for sample S5 and S6. a
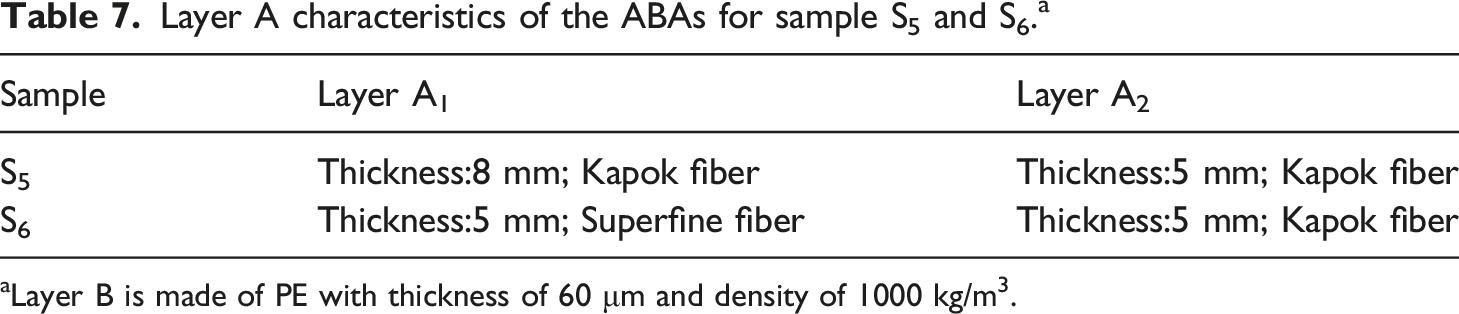
aLayer B is made of PE with thickness of 60 μm and density of 1000 kg/m3.

Influence of thickness of A1 on STL of ABA.
It is seen from the Figure 16 that if the layers A2 and the area density of A1 for ABA samples of S5 and S6 are the same, STL of an ABA is decreased if thickness of the A1 is decreased.
The average vales of STL for S1, S5 and S6 ABA samples are 19.35 dB, 14.8 dB and 14.21 dB respectively, so it is concluded that the thickness of A1 layer has great influences on STL in the medium frequency range and has small influences on STL at high frequency range. With the decrease of the thickness of layer A1, the frequency at valley value of STL is increased.
Influences of layer A2 thickness on STL of ABA
Layer A characteristics of the ABAs for sample S7 and S8. a

aLayer B is made of PE with thickness of 60 μm and density of 1000 kg/m3.

The influence of A2 layer thickness on STL of ABA.
It is seen that from Figure 17 that if the thickness of layer A2 is increased, the STL of ABA structures at firstly decreases and then increases if layers A1 and area density of A2 are the same. With the increase of A2 layer thickness, the amplitude of the double wall resonance will be reduced so the STL at valley frequency is increased.
Influence of layer B on STL of ABA
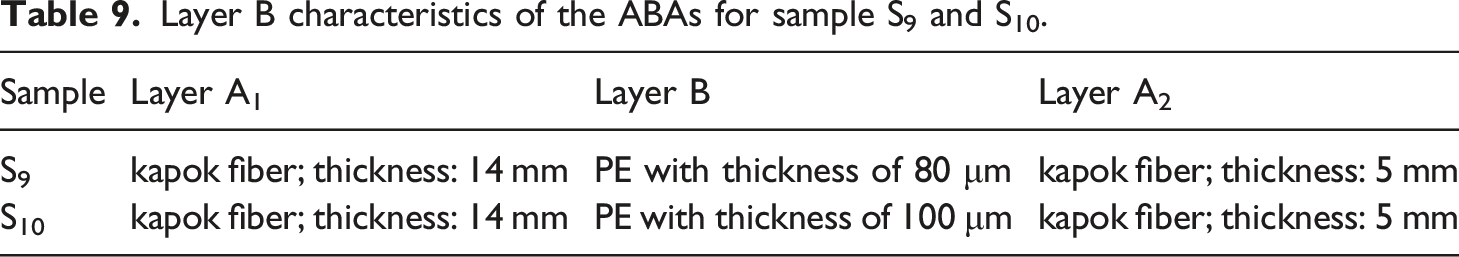
Layer B characteristics of the ABAs for sample S9 and S10.
The STL of S1, S9 and S10 is calculated using the presented model in Section 3.1, and the calculated results are shown in Figure 18. The influence of layer B thickness on the STL of ABA.
It can be seen from Figure 18 that the STL for the three ABA structures decreases firstly and then increases with the increase of frequency. In the low frequency range, the STL versus frequency for the three ABA structure is similar. At high frequency range, with the increase of PE film thickness, the STL the ABA is slightly increased, but the change of PE film thickness has little effect on the STL. The average values of the STL of the three ABA are 19.35 dB, 19.47 dB and 19.64 dB, respectively, so the STL of the three ABA are almost the same. The impervious screen model used for layer B in ABA model is insensitive to the weight of layer B.
Conclusions
By using experiment, modeling and calculation methods, the following two conclusions are obtained.
(1) Compared with superfine fiber, kapok fiber has a unique large and complex hollow structure. Kapok fiber is not only good for sound absorptions by consuming sound energy using the viscosity of air between fibers, but also absorb sound energy using hollow structure inside kapok fiber. Therefore, layer A of ABA structure made of kapok fiber has better sound absorption performance.
(2) The ABA structure using kapok fiber as the layer A has larger STL. By comparing the STL of ABA samples with kapok fiber and superfine fiber as the layer A, it is concluded that the ABA structures with kapok fiber as layer A have larger STL in the high frequency range, and if kapok fiber is used in both layers A1 and A2, the STL at high frequency is increased.
The future research on this topic includes: to take more natural fibers as studying objects to study SAC and STL; to study acoustic performances of mixed fibers of natural and synthetic fibers; to study the relationship between kapok fiber microstructure and the physical parameters, such as flow resistivity and characteristic length.
Footnotes
Declaration of conflicting interests
The author(s) declared no potential conflicts of interest with respect to the research, authorship, and/or publication of this article.
Funding
The author(s) received no financial support for the research, authorship, and/or publication of this article.