
Abstract
Ply splicing design is a crucial technology to realize the precise manufacturing of woven composite components with various complex shapes. This paper reports two ways of splicing, inter-layer splicing, and in-plane splicing. Two factors affecting the tensile properties of carbon fiber/epoxy laminated woven composites with ply splicing are discussed, including the number of continuous fabric layers on the surface and in-plane splicing spacing. The deterioration of the composites induced during the tensile test is characterized by acoustic emission and digital image correlation. The results reveal that the damage of the laminated woven composites with ply splicing occurs mainly at the butt jointing location and leads to fracture failure. Ply splicing has little effect on the tensile modulus of the composites. The tensile modulus is slightly reduced between 2% and 5%. But ply splicing has a more significant effect on its tensile strength. The total number of continuous fabric layers at the splice position approximately determines the strength retention ratio. The more the number of continuous fabric layers on the surface are, the higher the tensile strength of the composites. When the number of continuous fabric layers on the surface is three layers, the tensile strength retention ratio reaches 69%. The larger the splicing spacing is, the better the tensile properties of the composites. When the splicing spacing is increased to 30 mm, the tensile strength retention ratio reaches 77%.
Keywords
Introduction
Woven composites have excellent characteristics of light weight, high specific strength and modulus, good fatigue resistance, and strong designability. Because of these outstanding properties, woven composites are widely applied in aerospace components. 1 For the preparation of large-size and special-shaped composite structural components, ply stacking is a very mainstream method at present. Experts and scholars have also done a lot of research on the mechanical properties of laminated composites, such as tensile behaviour, 2 flexural behaviour, 3 interlaminar behaviour,4,5 impact behaviour 6 etc. Due to the limited deformation ability of the woven fabric, it is easy to produce wrinkles on the complex curved surface.7,8 Wrinkle formation occurs readily for the complex-shaped components with a non-deployable curved surface shape. Consequently, it is necessary to adopt the strategy of fabric layer cutting and ply splicing to meet the complex shape laying requirements.9,10 Therefore, ply splicing design is a crucial technology to realize the precise manufacturing of woven composite components with various complex shapes.
Ply splicing refers to a structural design process in which fabric layers with edge matching are spliced, and fabric layering is carried out according to the required preform thickness. Fabric layer cutting and splicing would introduce initial macroscopic defects into the composites, resulting in reduced performance. The factors affecting the mechanical properties of composites with ply splicing include the number of splicing layers, splicing angle, splicing spacing and the number of continuous fabric layers on the surface etc. Worldwide some scholars have studied the material properties of composite materials with spliced layers. For example, Li et al. 11 found that the shear stress of carbon fiber laminates with ply splicing is significant near the ply splicing area, and the delamination failure mainly depends on type II fracture toughness. Stable crack propagation was observed at the splice during the tensile test of a specimen with spliced layers. Wang et al. 12 studied the effect of oblique splicing on the tensile properties of carbon/polyurethane laminates. They found that the fracture occurred at the splicing gap, and the oblique splicing would greatly influence the stiffness of the composite laminates. At the same time, the strength was mainly determined by continuous layers. Chen 13 studied the effect of different splicing angles and component geometry on unidirectional laminate composites. The study revealed that the fracture would occur at the splicing part and develop at the interface between the splicing and the continuous layer. This study also demonstrated that the numbers of the continuous layer determined the fracture strength. Current research shows that ply splicing leads to a decrease in the composites’ performance. Therefore, rational ply splicing design is the crucial technology to meet the performance requirements of composite materials and to realize the preparation of composite components with complex shapes.
The research of laminated composites with ply splicing is not sufficient and has great research value and development space. This paper will make some new attempts and efforts to enrich the research in this field based on the previous research. Therefore, in this study, two splicing methods, inter-layer and in-plane splicing, are designed. The effects of two splicing parameters, the number of continuous fabric layers on the surface and splicing spacing, on the tensile properties of woven laminated composites were investigated by tensile tests. Acoustic emission (AE) technology and digital image correlation (DIC) technology are used to characterize the damage mechanism during tensile tests and to obtain the optimal design criterion for the ply splicing of the woven composites.
Experimental
Specimens fabrication
The specimens were prepared by two-dimensional woven fabric lay-up and RTM process, with a size of 220 mm × 20 mm × 3 mm, and each group consisted of three specimens. The laminated fabric is made of TG800-6k carbon fiber (Shanxi Gangke carbon material Co., Ltd, China) five-harness satin weave fabric, and the warp density and weft density are both 6.5 picks/cm. The matrix material is TDE-86 epoxy resin (Tianjin Jingdong Chemical Composite Material Co., Ltd, China). The fiber volume fraction of composites by weighing method in this paper is 53%.
The warp yarns of the laminated fabrics are arranged along the length of the specimen, and 10 layers of fabrics are laid sequentially from bottom to top. During the lay-up process, some fabric layers are cut and spliced along the width direction of the specimen to form a composites specimen with ply splicing. To magnify the effect of ply splicing, two adjacent layers of fabrics were used as a unit to cut and splice, which was defined as the ply splicing unit. The two types of ply splicing methods are rationally designed as shown in Figure 1. Figure 1(a) shows the inter-layer splicing method; the two ply splicing units are symmetrical about the midplane of the specimen. And the butt jointing location is located in the middle of the specimen. The number of continuous fabric layers covered on the surface of the specimen is taken as the variable, namely, the variable m shown in the Figure 1(a). The values of m are taken as 1 layer, 2 layers and 3 layers, respectively. The variable n will change with the change of m, and the corresponding value are 4 layers, 2 layers, and 0 layers, respectively. The corresponding types of specimens are recorded as LOD1, LOD2 and LOD3. Figure 1(b) shows the in-plane splicing method. Two ply splicing units are placed in the middle four layers of the specimen. The in-plane splcing spacing of the two ply splicing units is taken as the variable, namely, the variable d shown in the Figure 1(b). The values of d are taken as 0 mm, 10 mm, 20 mm, 30 mm, and 40 mm, respectively. The parameter values are selected reasonably according to the specimen size and practical engineering technical reference process data. The in-plane splcing spacings are symmetrically arranged in the middle of the specimen as shown in the Figure 1(b). The corresponding types of specimens are recorded as LID00, LID10, LID20, LID30, and LID40, respectively. The specimens without the spliced layers were used as the control specimens and recorded as COM. The schematic diagram of the ply splicing scheme.
Experimental procedures
The ASTM D 3039 standard norm was used for the tensile test,
14
applying a loading speed was 2 mm/min. The test equipment is a force testing instrument (PSD-30TSJTT, Lishi Scientific Instruments Co., Ltd, China), of which the load-displacement is recorded during the test. A DIC system(GOM, Germany) was used to measure the full-field strain on the specimen, and an AE system(PAC, USA) was employed to collect the sound signals generated by the internal damage to the specimen. The tensile test instrument is displayed in Figure 2. The tensile test instrument and its components.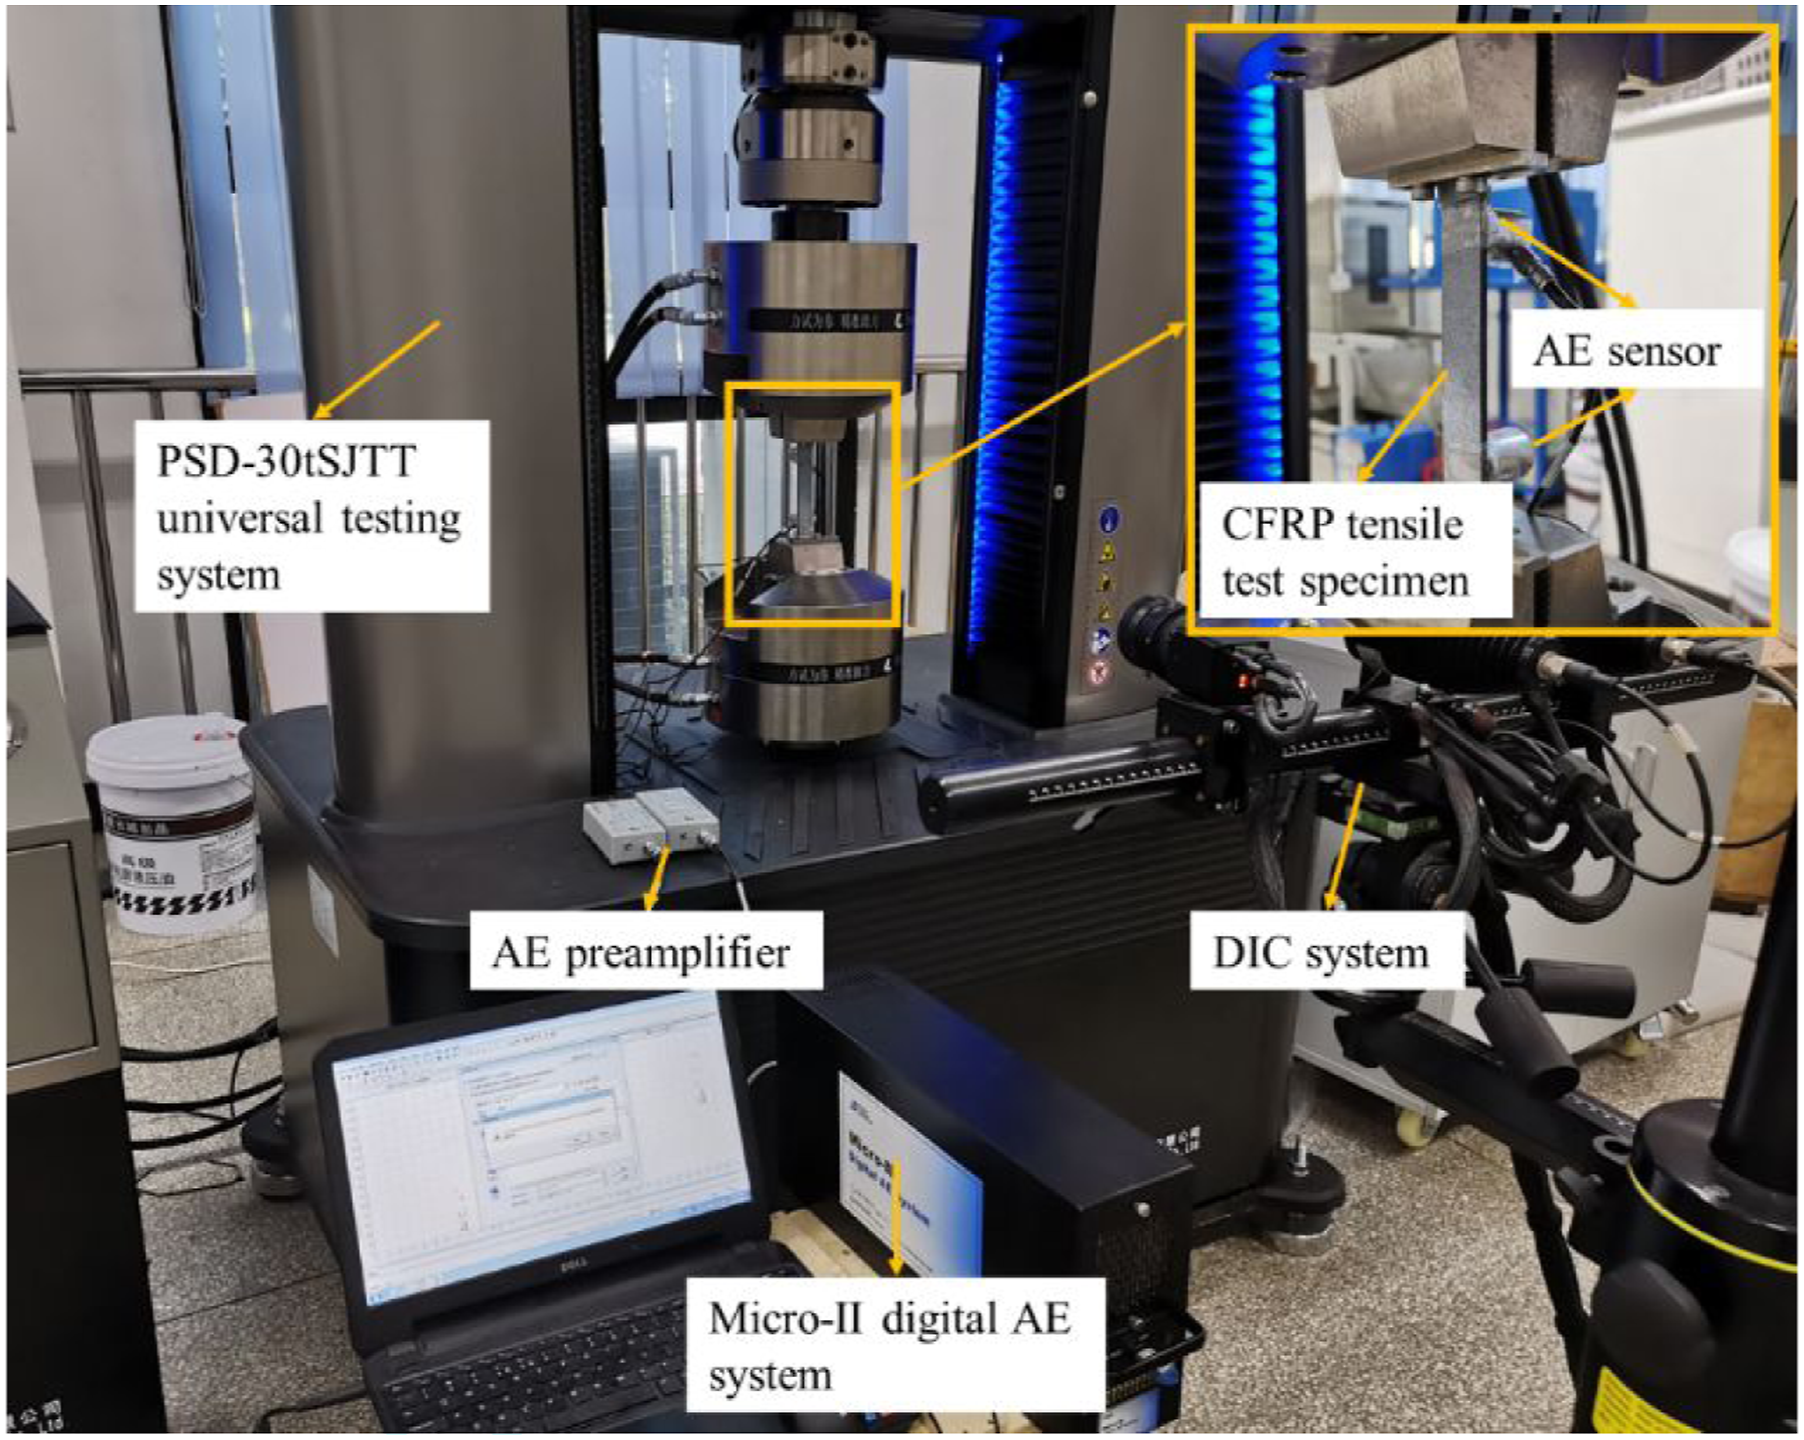
As a non-destructive testing technology, AE is often used to monitor the damage behavior of materials under load. The mechanism is the rapid release of strain energy caused by microstructure damage in the stressed material producing transient elastic waves.15,16 The arrangement of the specimen and sensor is shown in Figure 3. The distance between the two sensors is 80 mm. According to the ASTM-E−976-15 test standard,
17
the AE sensor is calibrated by the method of breaking the lead core to ensure a good connection between the surface of the specimen. Before each test, the center position of the upper AE sensor is used as the AE location origin, which carried out AE wave source counting and location analysis at the damage location of the specimens.18–20 With Δt, the time difference between the sensors S1 and S2 from point Q of the AE wave source, and v, the wave speed is, the positioning formula can be written as The schematic diagram of tensile specimen and acoustic emission sensor configuration position.

Results and discussion
Influence of the number of continuous fabric layers on the surface on tensile properties of laminated composites with ply splicing
The butt jointing locations of LOD1, LOD2, and LOD3 of the three inter-layer splicing specimens are located in the middle of the specimens, about 40 mm away from the AE positioning origin, see Figure 1(a). The splicing layer consists of four layers; two layers form a unit, which is symmetric on the middle plane of the specimen. The number of continuous fabric layer on the surface is one layer, two layers, and three layers, respectively. Tensile properties of three inter-layer spliced specimens and COM specimens without splicing, were tested and compared. The test results displayed in Figure 4. The stress-strain curves of the inter-layer spliced specimens and the COM specimens show linear characteristics with an approximately similar slope of the curves, shown in Figure 4(a). Compared with the specimens without splicing, the tensile modulus of inter-layer spliced specimens shows no noticeable change, and the tensile fracture strength and fracture strain of inter-layer spliced specimens are significantly reduced. The average values of tensile strength of COM, LOD1, LOD2 and LOD3 were 925.35, 522.58, 603.32, and 641.02 MPa respectively, and the standard deviations were 16.613, 10.926, 11.343 and 0.631 MPa respectively, seen as Figure 4(b). The average values of tensile modulus were 71.86, 69.25, 69.95, and 70.22 GPa respectively, and the standard deviations were 0.907, 0.028, 1.054 and 0.924 GPa respectively. Compared with the specimens without splicing, inter-layer splicing has a reduced effect on the tensile modulus of the composites. However, it has a more significant effect on the tensile strength of the composites. Compared with COM without splicing layers, the tensile modulus of LOD3, LOD2 and LOD1 with inter-layer splicing decreased by 3.63%, 2.66% and 2.29%, respectively.The splicing decreases the composites’ tensile strength and fracture elongation, and the fewer the continuous fabric layer on the surface, the more significant the effect. Compared with COM specimen, the tensile strength retention ratios of LOD3, LOD2, and LOD1 of inter-layer splicing specimens were 69%, 65%, and 56%, respectively, and the proportion of continuous layers near the splicing was 60%, which was determined by the number of all continuous layers at the splicing. The experimental results show that when the number of continuous fabric layers on the surface is more than 2, the tensile strength retention ratio of the composites is higher than the proportion of continuous fabric layers at the splicing. Tensile properties of inter-layer splicing composites; (a) The stress-strain curves of the four specimens; (b) Tensile strength and tensile modulus.
During the tensile test, the DIC strain field, the position information of the AE wave source, and the failure morphology of the specimens were collected, as shown in Figure 5. Comparing and analyzing the specimens without splicing and the inter-layer spliced specimens, the DIC strain change and the AE information are highly correlated with the inter-layer butt jointing location during the loading process. Also, the fractures of the specimens occur at the layer butt jointing location. Apparent strain field, acoustic emission localization information, and fracture morphology of composite specimens with and without inter-layer ply splicing.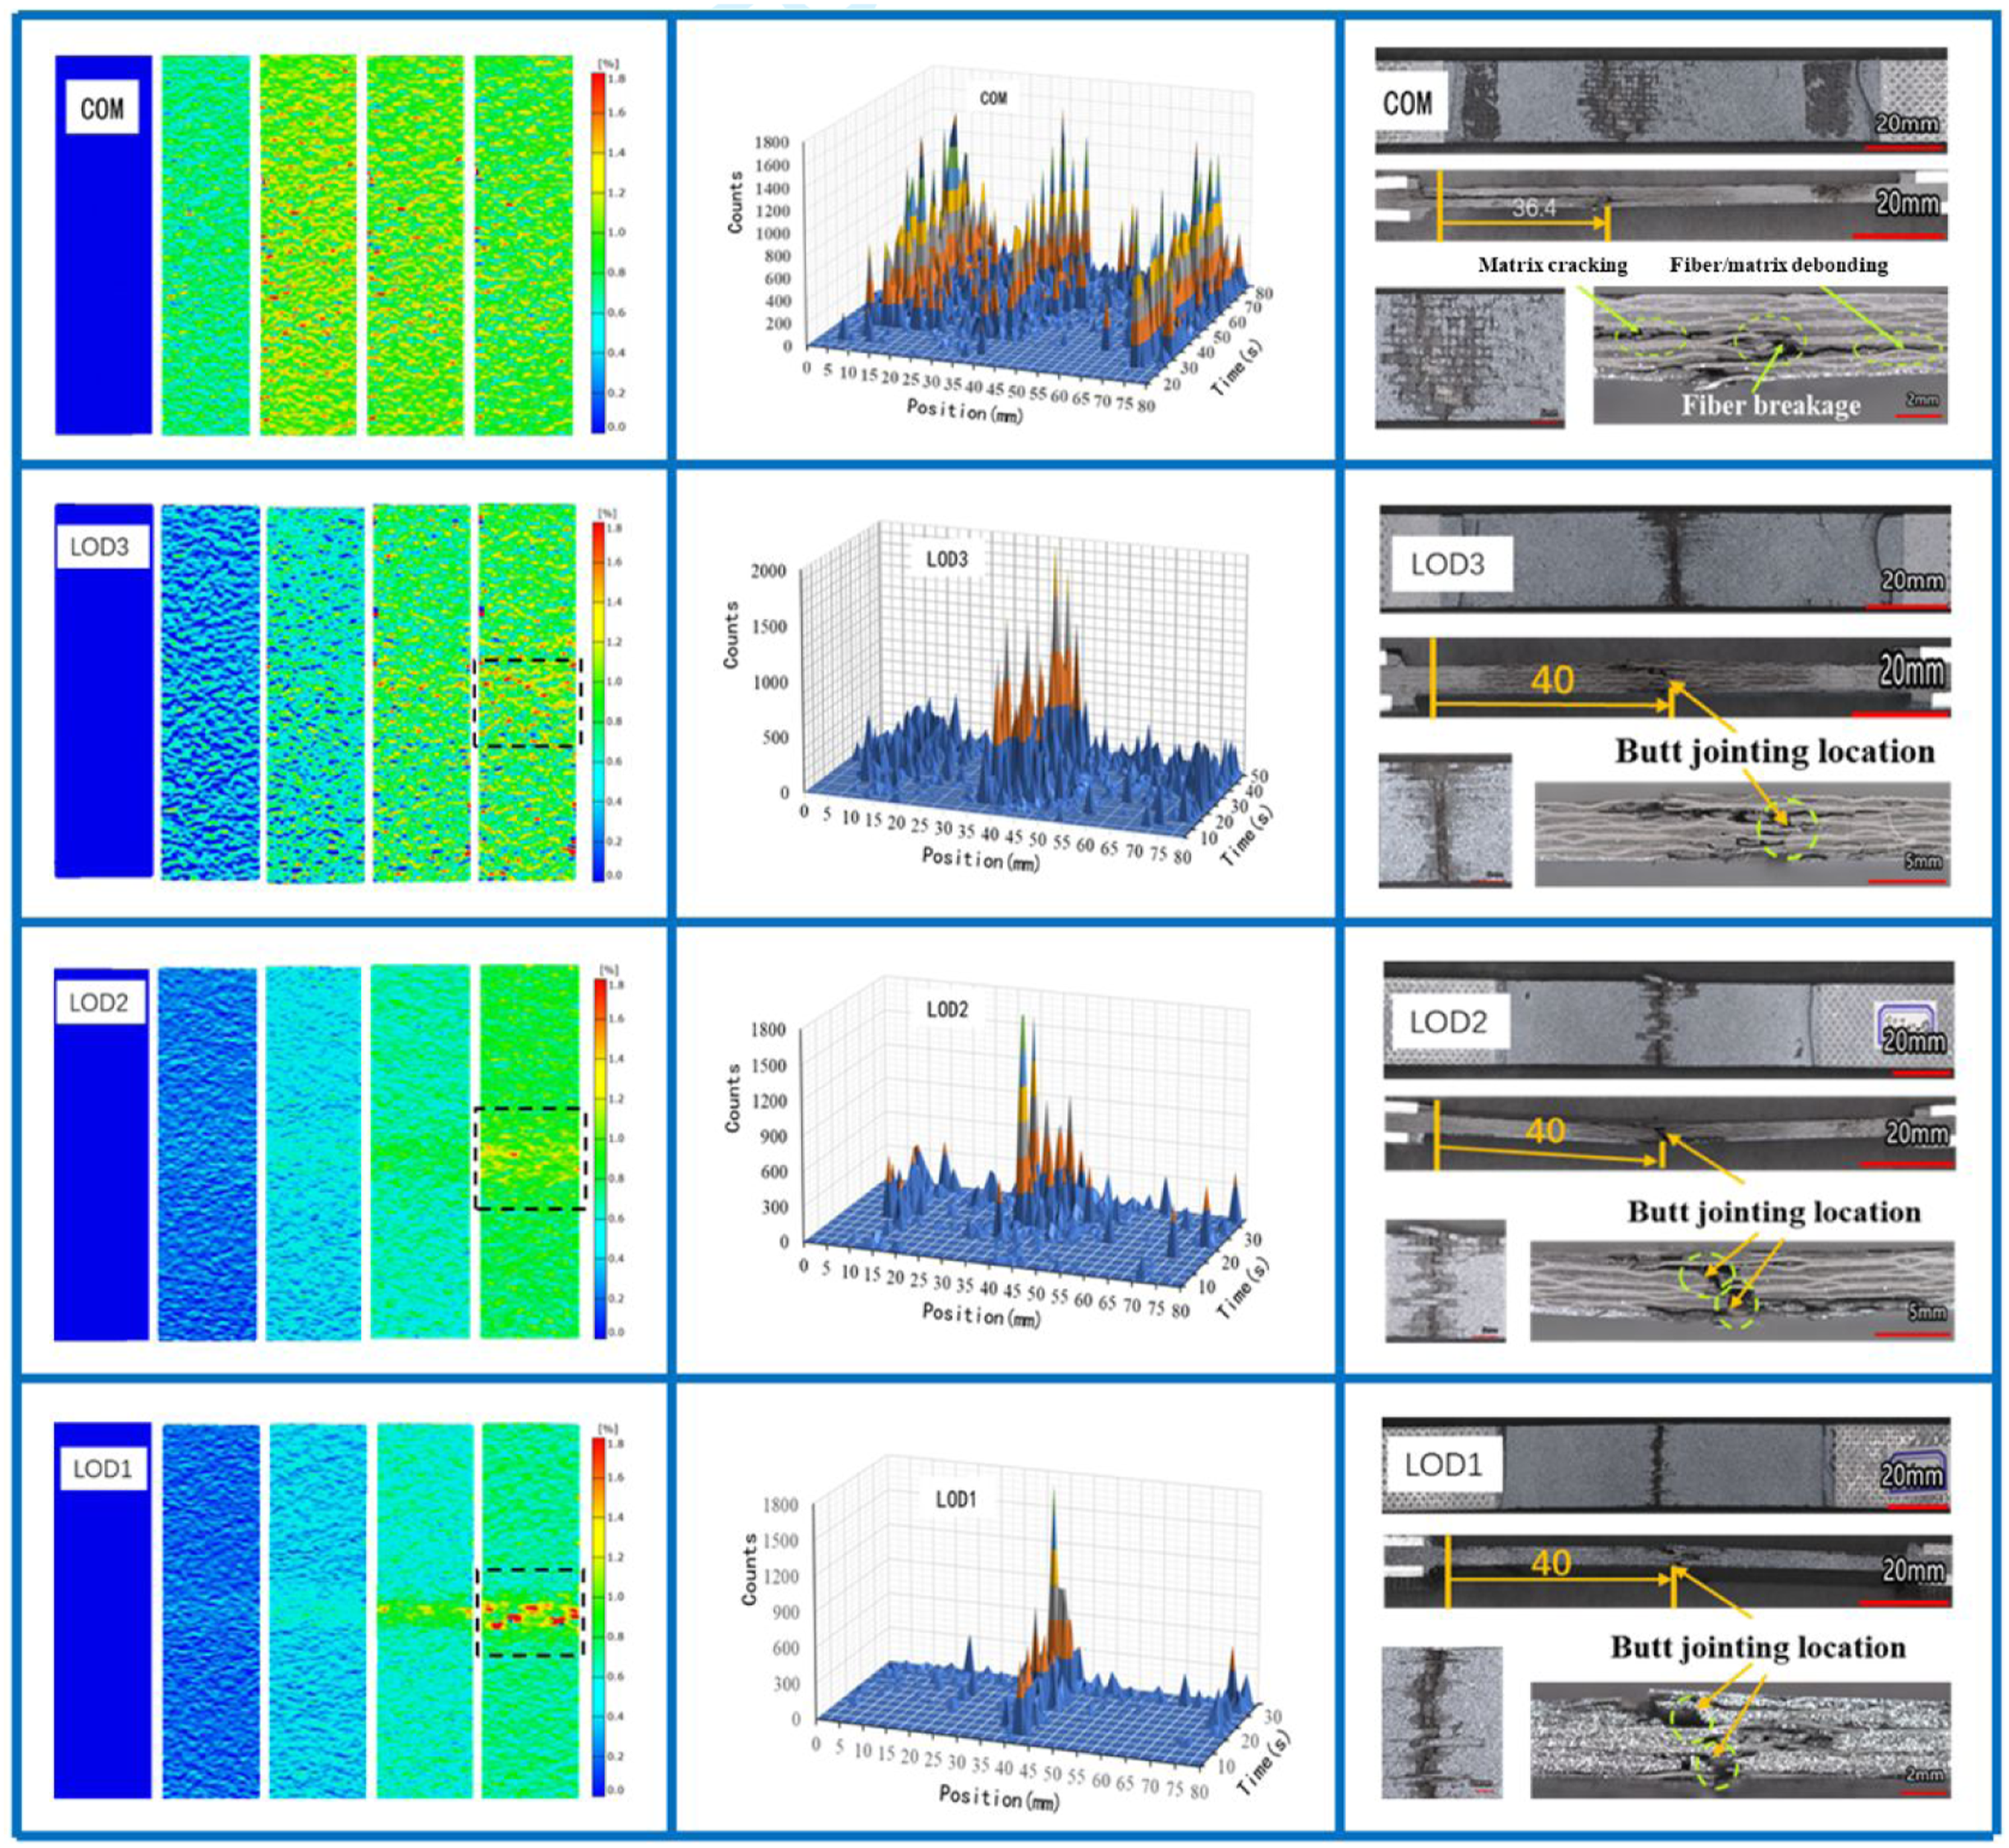
The DIC strain diagram and AE diagram of the COM specimens indicate that the strain of the specimens is small at the initial stage of loading, and the AE count is silent. The AE signal starts to be received when the load reaches 20 s, and the corresponding damage location is at 70.4 mm. The strain of the specimens increases gradually, the strain field is evenly distributed, and the counts of AE gradually increase, which are concentrated in the 0–15 mm, 30–40 mm, and 70–80 mm areas of the specimens. Before the specimen breaks, the specimen strain is uniform, and the 0–40 mm area AE counts increased. Compared with the tensile failure morphology of the COM specimen, the specimen surface of the COM specimen exhibits apparent damage at the positions corresponding to the three AE count peaks. The final fracture position of the specimen was 36.4 mm, and the delamination failure occurred in the 0–40 mm region. The AE duration is about 80 s. The failure topography of the COM specimen discloses that the failure modes of the specimen mainly include matrix cracking, fiber/matrix debonding, and fiber breakage. Matrix cracking and debonding damage occurred at the initial stage of loading and were accompanied during the whole loading process, resulting in a large number of AE counts. For example, the peaks of AE counts of the COM specimen at 0–15 mm and 70–80 mm correspond to obvious traces of resin damage on the specimen surface. As the loading time increases, the resin damage accumulates and generates cracks that cause fiber breakage resulting in specimen fracture.13,21 The release of energy at the moment of fracture of the specimen causes the rapid expansion of cracks resulting in delamination failure.
The DIC strain diagram of the specimen in Figure 5 shows the three inter-layer splicing specimens containing the same number of spliced fabric layers and continuous fabric layers at the ply splices. However, due to the different numbers of continuous fabric layers on the surface of the specimens, the strain field on the surface of the specimens has different characteristics. During tensile loading, the maximum strain area of the three specimens emerges at the butt jointing location. This is because the position of ply splicing is mainly supported by the continuous fabric layer, resulting in stress concentration. On average, the fewer the continuous fabric layers on the surface of the specimen, the more obvious the stress effect would be, which corresponds to the maximum strain area. Therefore, the specimen LOD3, with three continuous fabric layers on the upper and lower surfaces, has a wider maximum strain area in the DIC strain diagram. For the specimen LOD1, with one continuous fabric layer on the upper and lower surfaces, the maximum strain region in the strain diagram is narrow and prominent. Furthermore, the maximum strain region of specimen LOD2 is between the strain region of specimens LOD1 and LOD3. The smaller the number of continuous fabric layers on the surface of the inter-layer splicing specimens, the more concentrated the surface stress, resulting in a decrease in its tensile strength and elongation at break. As shown in Figure 4(a), the tensile strength and elongation values at the break of the specimen LOD3 are the largest while those of the specimen LOD1 are the smallest.
The AE diagram of the specimens in Figure 5 indicates that the initial AE signals time received of LOD3, LOD2 and LOD1 are 9.7 s, 11.1 s and 11.4 s, respectively, and the corresponding damage location are at 36.8 mm, 38.4 mm and 40 mm, respectively. That is, the initial time of AE signals of specimens with splicing layers is earlier than that of COM without splicing layers. This indicates that the initial damage time of the specimens with splicing layer is advanced. In addition, the initial damage of the specimens with splicing layer was located at or near the 40 mm position where the butt jointing is. With tensile loading, the AE count peaks of the three specimens are located in the region near the ply butt jointing location. The AE duration of specimen LOD3 is the longest, LOD1 displays the shortest, and the AE duration of LOD2 is in between. All these durations are less than the AE duration of specimen COM. Comparing the failure morphologies of the specimens, the three LOD specimens all broke at the butt jointing location. The fewer the number of continuous fabric layers on the surface, the more serious the surface stress concentration. The longer the loading time of the specimens to fracture, the narrower the surface fracture failure range and the more the tensile strength decreases.
There will be AE signals with different characteristics corresponding to different damage modes of specimens during loading including matrix cracking, fiber/matrix debonding and fiber breakage.22,23 At present, the mainstream method of pattern recognition is the clustering method based on multi-parameter analysis.21,24,25 Cluster analysis based on time and frequency characteristics shows that peak frequencies of AE signals can represent specific damage mechanisms. 26 The low-frequency stage represents matrix cracking, the middle-frequency stage signifies fiber/matrix debonding, and the high-frequency stage represents fiber breakage. According to research results of Groot et al. and Sobhani et al.,27,28 the peak frequencies of the three damage modes of specimens under load, namely matrix cracking, fiber/matrix debonding and fiber breakage, are set at 50–180 khz, 180–300 khz and 300–500 khz, respectively.
Figure 6 displays the time-peak frequency scatterplots of COM, LOD3, LOD2 and LOD1 specimens. It can be roughly seen from Figure 6 that there are obvious differences in the distribution of different types of specimens in different frequency stages. This indicates that different inter-layer splicing structures affect the distribution of damage modes. However, they all show the characteristics of dense distribution in low-frequency stages and sparse distribution in middle and high-frequency stages. In addition, as shown in Figure 6, with the decrease of the continuous layer on the surface, the reflected damage content decreases and the time required for specimen failure reduces. The results show that the specimen is destroyed faster while the continuous layers on the surface is reduced. Time-peak frequency scatterplots: (a) COM (b) LOD3 (c) LOD2 (d) LOD1.
Quantitative statistics of peak frequencies were made according to the frequency stage corresponding to the three modes, as shown in Figure 7. The proportions of COM in the three frequency stages are 96.71%, 2.45%, and 0.84%, respectively. COM belongs to control specimens without a splicing layer and exhibits a large amount of micro-strain in the specimen during loading. The micro-strain distribution is relatively uniform and can be compared with the strain cloud diagram in Figure 5. The data also reveals that matrix cracking is the primary damage mode, followed by fiber/matrix debonding and fiber breakage, confirming the specimen failure process described above. Column chart of the proportion of damage modes of inter-layer spliced composites.
The proportions of LOD3 with splicing layers in the three frequency stages are 95.26%, 4.04%, and 0.70%, respectively. The proportions of LOD2 with splicing layers in the three frequency stages are 96.06%, 2.79%, and 1.15%, respectively. The proportions of LOD1 with splicing layers in the three frequency stages are 95.29%, 3.21%, and 1.49%, respectively. The data discloses that the fiber/matrix debonding damage mode of LOD3 is more than that of LOD2 and LOD1, the matrix cracking damage mode of LOD2 is slightly more than that of LOD3 and LOD1, and the fiber breakage damage mode of LOD1 is more than that of LOD3 and LOD2. These findings indicate that different inter-layer splicing structures will cause the difference in the proportion of damage modes. With the decrease of the continuous layers on the surface, the proportion of fiber breakage increased. Comparing with the failure morphology of the specimens in Figure 5, it can be seen that the failure of the specimens with inter-layer splicing layers is mainly caused by fiber breakage, so the bearing capacity reduced and tensile strength reduced correspondingly, which further supports the above argument.
Influence of in-plane splicing spacing on tensile properties of composites with ply splicing
Tensile properties of five in-plane spliced specimens LID00, LID10, LID20, LID30, LID40, and specimens COM without splicing, as shown in Figure 1(b), were tested and characterized. The test results are shown in Figure 8. The stress-strain curves of the in-plane spliced specimens and the specimens without splicing show linear characteristics, and the slope of the curves is approximately the same, see Figure 8(a). However, the tensile fracture strength and fracture strain of in-plane spliced specimens declined compared with those specimens without splicing. Figure 8(b) shows the tensile strength and modulus of specimens COM, LID00, LID10, LID20, LID30, and LID40. The average tensile strength is 925.35, 641.02, 568.55, 680.06, 719.29, and 716.59 MPa, respectively, and the standard deviations are 16.613, 0.631, 28.282, 24.813, 40.883 and 31.696 MPa, respectively. The average values of the tensile modulus are 71.86, 70.22, 68.29, 70.27, 68.68, and 69.54 GPa, respectively, and the standard deviations are 0.907, 0.924, 1.411, 0.594, 2.070 and 0.484 GPa, respectively. Compared with the specimens without splicing, in-plane ply splicing has little impact on the tensile modulus of the woven composites. The tensile modulus of the specimens with in-plane splicing layers is slightly decreased, and the reduction ratio is between 2% and 5%. But compared with the specimens without splicing, in-plane ply splicing has a great effect on the tensile strength of the woven composites. In-plane ply splicing results in a obvious decrease in tensile strength of composites. When the splicing spacing is 10 mm, the tensile strength retention ratio of the material is the lowest, which is about 61%. With the increase of the in-plane splicing spacing, the tensile strength of the material gradually rises. When the in-plane splicing spacing increases to 30 mm, the tensile strength retention ratio of the composites rises to about 77%, which is close to the proportion of the all continuous layers at the butt jointing location (80%). Tensile properties of in-plane splicing composites: (a) The stress-strain curves of specimens; (b) Tensile strength and tensile modulus.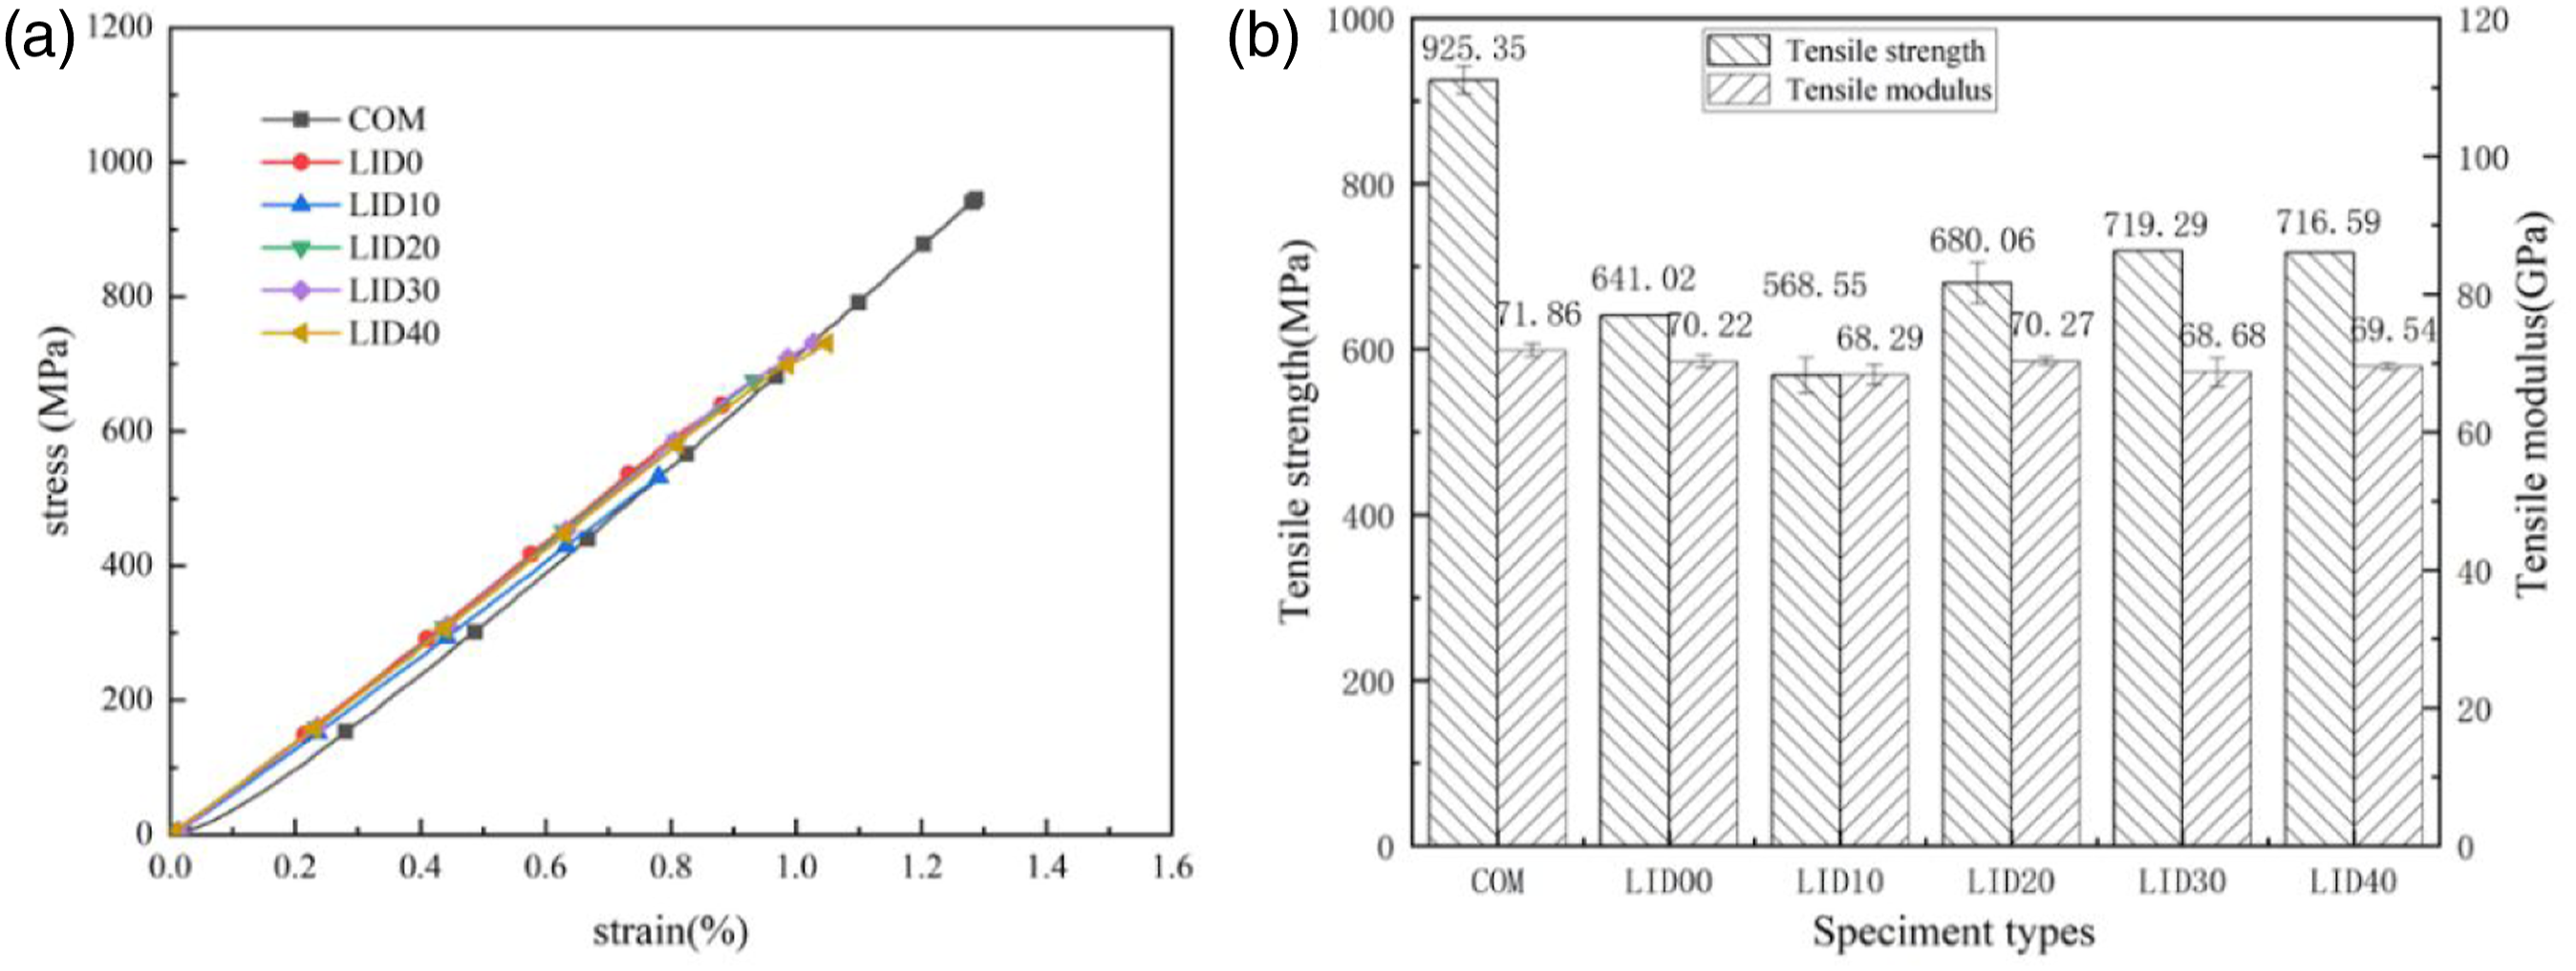
During the test, the DIC system was used to collect the apparent strain field of the specimens, and the AE system was used to collect the position information of the AE wave source, as shown in Figure 9. The tensile failure evolution mechanism of the in-plane ply splicing composites can be revealed by comparative analysis of the DIC strain changes, the AE system locationing, and the failure morphology of the specimens. Apparent strain field, acoustic emission location information, and fracture failure morphology of composite specimens with in-plane ply splicing.
The specimen LID00 contains two ply splicing units, and the in-plane spacing of the butt jointing locations is 0 mm; namely, the two ply splicing units are spliced at 40 mm in the middle of the specimen. As shown in Figure 9, for the specimen LID00, the AE signal starts to be received when it is loaded at 9.7 s, and the corresponding damage location are at 36.8 mm, which is near the 40 mm position of the ply butt jointing location. With the increase of loading time, the AE count peak appears around 40 mm of the ply butt jointing location. The DIC strain diagram of the specimen LID00 reveals that with the loading of the load, the maximum strain area of the strain field of the specimen gradually appears at the position of the ply splicing. The tensile failure morphology results of specimen LID00 disclose that the fracture failure of the specimen occurred at 40 mm from the butt jointing location, and delamination failure occurred in the fracture area. Furthermore, the initial time of AE of LID00 was earlier than that of the specimen without splicing, and the starting position of the damage is near the ply butt jointing location. This indicates that the ply splicing introduces the initial macroscopic defects inside the specimen, that is, the fiber at the ply butt jointing location is in the fracture state. Therefore, the introduced initial macroscopic defects by splicing layers induced resin cracking, interface failure and crack propagation during loading. In addition, specimen LID00 has four spliced layers and six continuous layers at 40 mm from the butt jointing location. During tensile loading, stress concentration occurs at the butt jointing location. As the stress increases, the fibers of the continuous layers break, the specimen becomes destroyed, and its tensile failure strength is approximately 69% of that of the COM.
In Figure 9, the in-plane spacing of ply splicing units in specimens LID10, LID20, LID30, and LID40 are 10, 20, 30, and 40 mm, respectively. That is, the positions of the two units of the splicing layers are 35 mm and 45 mm, 30 mm and 50 mm, 25 mm and 55 m, 20 mm and 60 mm, respectively. As the AE diagram shown in Figure 9, the initial AE signals time received of LID10, LID20, LID30 and LID40 are 13.9 s, 10.5 s, 10.1 s and 10.2 s respectively, and the corresponding damage location are at 44.8 mm, 49.6 mm, 25.6 mm and 20.8 mm, respectively. That is, the initial time of AE signals of specimens with splicing layers is earlier than that of COM without splicing layers. This indicates that the initial damage time of the specimens with splicing layers is advanced. In addition, the initial damage of the specimens with splicing layers was located near the position where one butt jointing unit is. The positioning deviation is within 1 mm with high accuracy. The DIC strain field changes and AE counting rules of the four specimens have a good correspondence with the ply splicing methods. The AE diagrams of the four specimens indicate that the AE counting peaks of the specimens all appear between two butt jointing locations. DIC strain maps of the four specimens also show that two large strain zones appear in all the specimens during the tensile loading process and correspond to the position of ply splicing. The fracture failure of the four specimens also showed the same morphology. Each specimen contained two fractures, which were located on the upper and lower surfaces of the specimens, respectively, corresponding to the position of ply splicing. The delamination failure of the four specimens occurred between the two fractures. As shown in Figure 1(b), the butt jointing locations of two ply splicing units in the four specimens were misaligned at different spacing. Distinguished from specimen LID00, the four tests contained two splicing layers and eight continuous layers at each butt jointing location.
Compared with specimens COM without splicing, the tensile fracture strength retention ratio of specimen LID10 is about 61%, which is much lower than the continuous layer proportion of 80% at ply splicing. Compared with specimen LID00, LID10 has more continuous layers of fabric at the butt jointing location, and its tensile strength retention ratio is lower than that of specimen LID00. This is mainly due to the small in-plane spacing between two butt jointing locations of specimen LID10, which leads to the coupling effect and cumulative effect of splicing defects. Therefore, the damage is concentrated in the position and vicinity of the two splicing units in a broader range, which would have a greater negative effect than that of specimen LID00. As shown in Figure 9, the AE duration of specimen LID10 is less than that of specimen LID00, indicating that specimen LID10 fracture failure soon occurs. By comparing the AE duration of the specimens in Figure 9, the AE duration of specimens LID10 and LID20 is shorter than that of specimens LID30 and LID40, of which LID10 showed the shortest AE duration. With the gradual increase of in-plane splicing spacing, the coupling effect weakens, and the tensile strength of the composite gradually rises. The tensile strength retention ratio of specimen LID20 increases to 74%, and the tensile strength retention ratio of specimens LID30 and LID40 rises to 77%, which is close to proportion of the continuous layers at butt jointing location for 80%.
Figure 10 shows the time-peak frequency scatterplots of LID00, LID10, LID20, LID30 and LID40 specimens. Figure 10 reveals differences in the distribution of the different types of specimens in different frequency stages. These differences indicate that various in-plane splicing structures have particular effects on the distribution of damage modes. However, all specimens show dense distribution characteristics in low-frequency stages and sparse distribution in middle and high-frequency stages. The damage content is the lowest for specimen LID10. These results indicate that LID10 specimens fail faster compared with other types of in-plane splicing specimens. Time-peak frequency scatterplots: (a) LID00 (b) LID10 (c) LID20 (d) LID30 (e) LID40.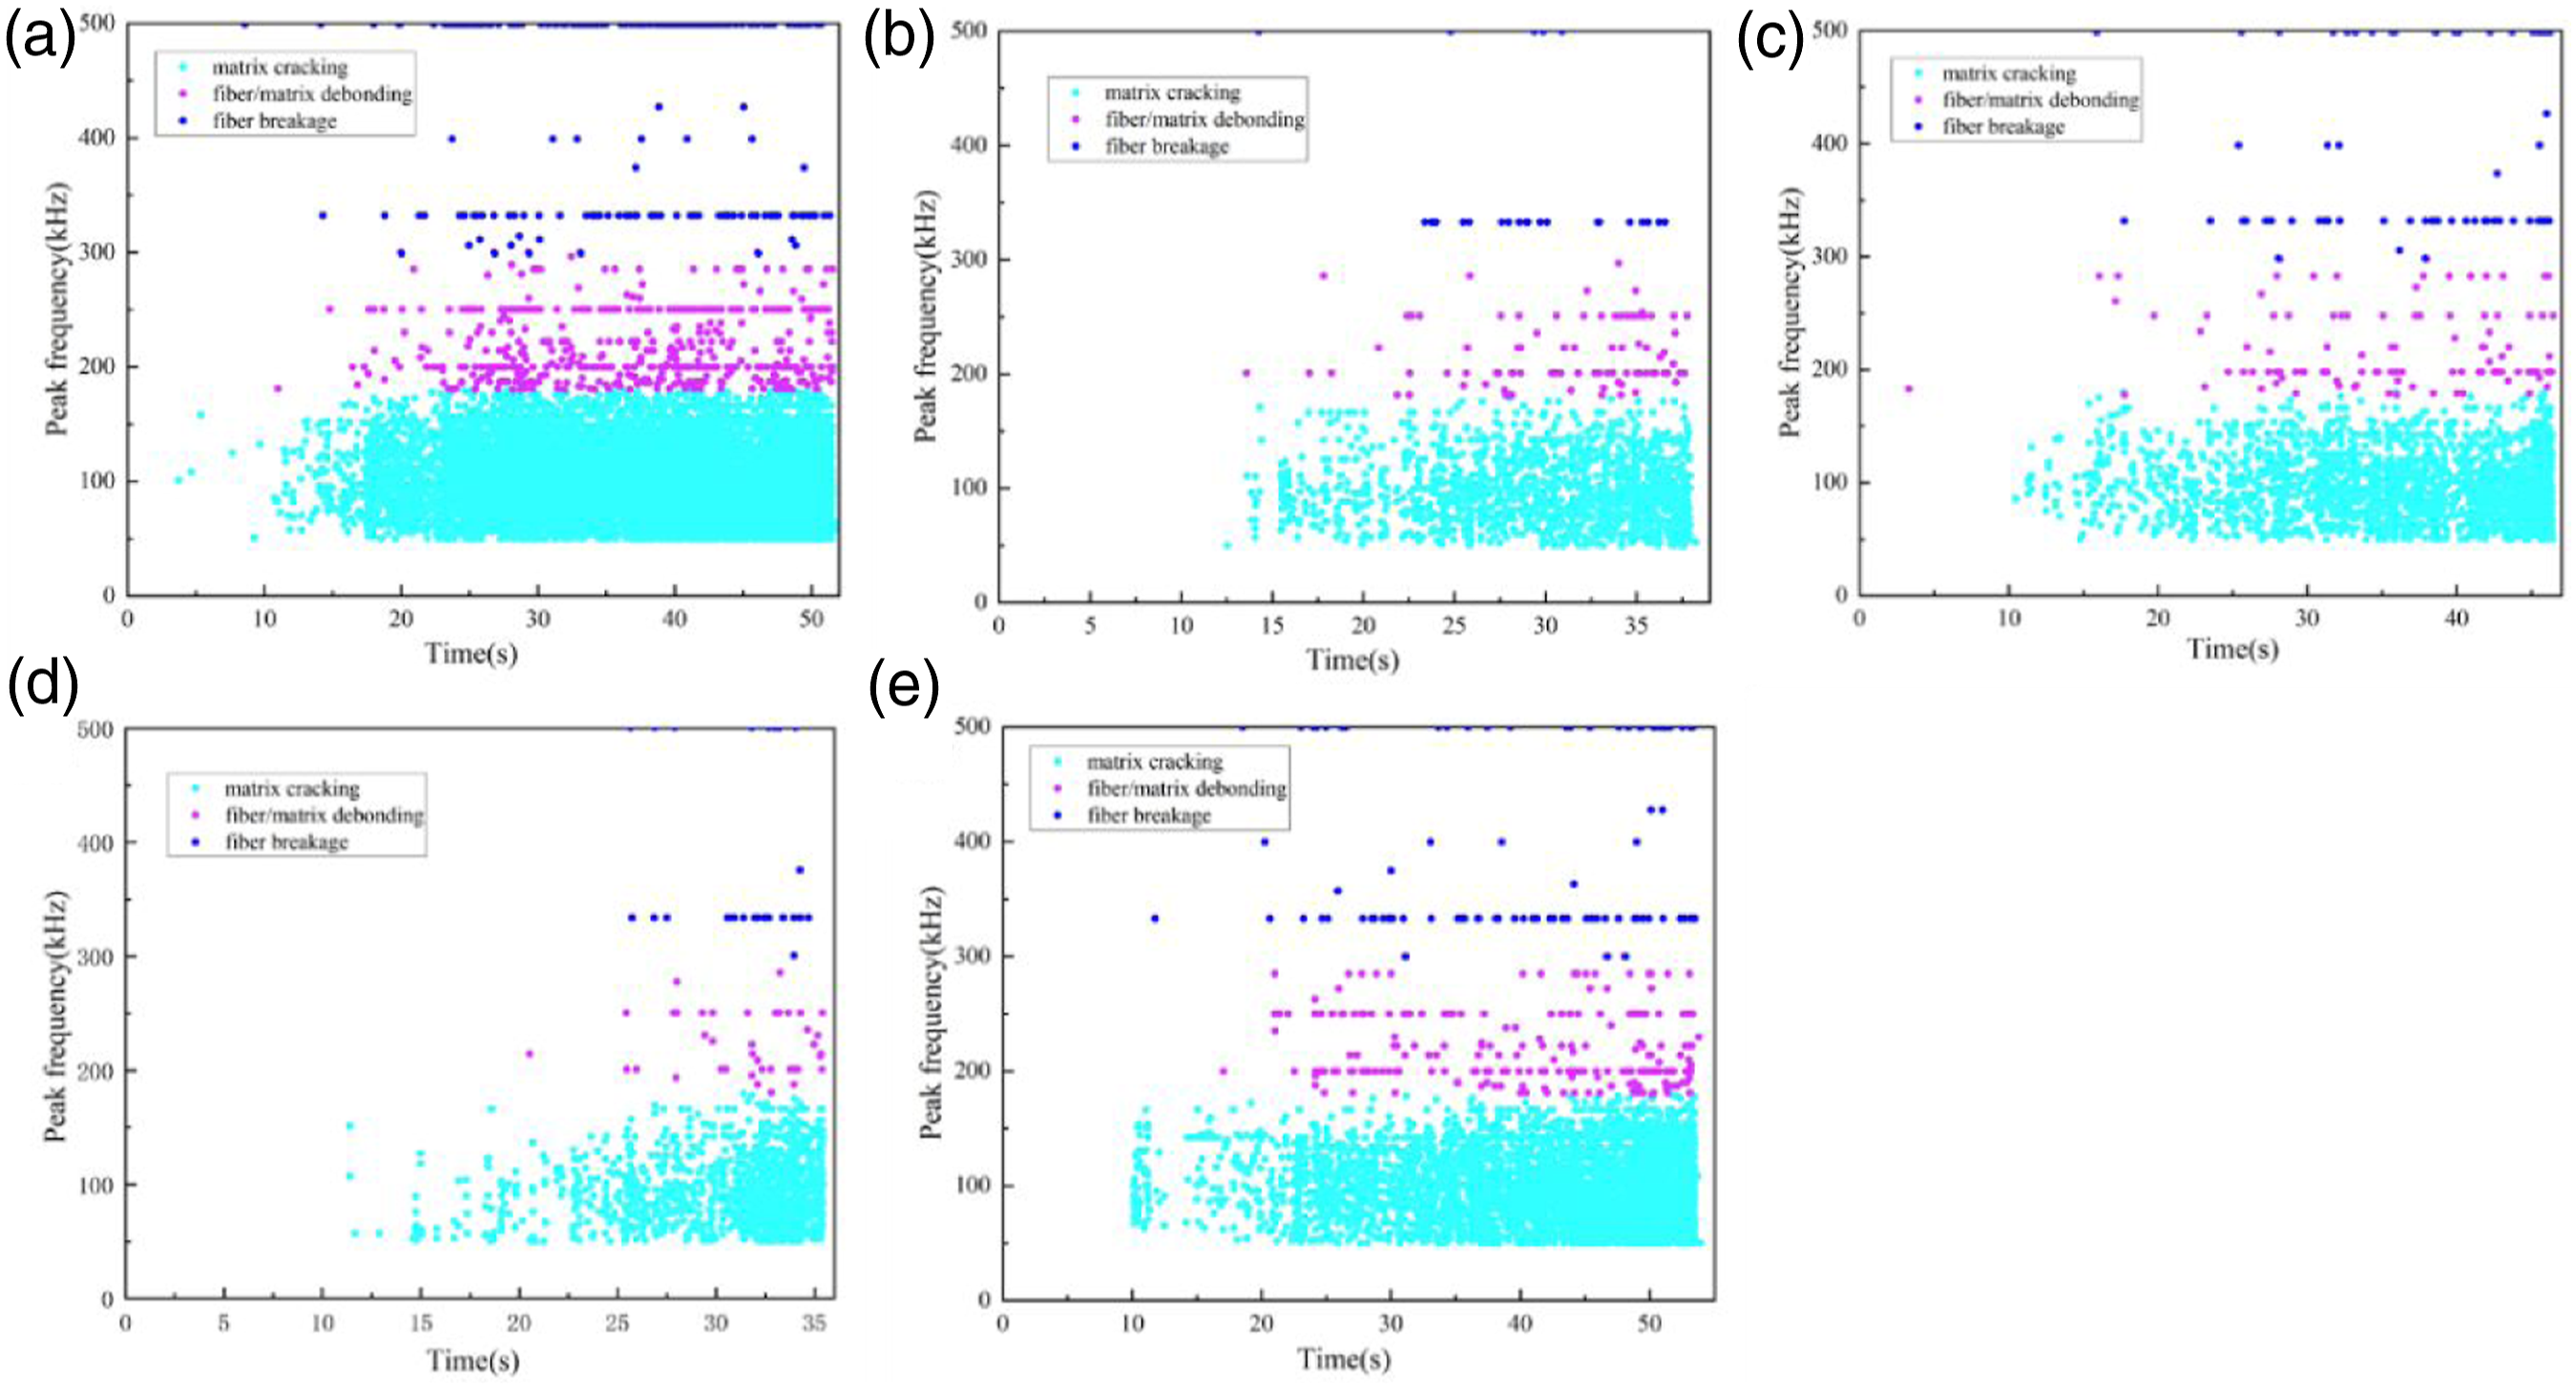
Quantitative statistics of peak frequencies were made according to the frequency stage corresponding to the three modes, as shown in Figure 11. The proportions of the specimens with splicing layers in the three frequency stages are: for LID00 95.26%, 4.04%, and 0.70%, respectively; for LID10 93.11%, 5.52%, and 1.37%, respectively; for LID20 94.11%, 4.30%, and 1.59%, respectively; for LID30 96.07%, 3.02%, and 0.92%, respectively; and for LID40 95.03%, 3.84%, and 1.13%, respectively. Hence, different in-plane splicing structures will cause a difference in the proportion of damage modes. Column chart of the proportion of damage modes of in-plane spliced composites.
The proportion of the matrix cracking damage sequence is LID30 > LID00 > LID40 > LID20 > LID10, with the LID30 specimen having the highest proportion of matrix cracking damage. The contribution of fiber/matrix debonding damage sequence is LID10 > LID20 > LID00 > LID40 > LID30, with the LID10 specimen having the highest proportion of fiber/matrix debonding damage. The trend for the percentage of fiber breakage damage is LID20 > LID10 > LID40 > LID30 > LID00, with LID20 specimen having the highest proportion of fiber breakage damage. Comparison with the failure morphology of the specimens from Figure 9 reveals that the failure of the specimens with in-plane splicing layers is mainly determined by fiber/matrix debonding damage and fiber breakage damage. By combining the proportion of the two damage modes, the following trend is obtained: LID10 > LID20 > LID40 > LID00 > LID30. This sequence indicates that LID10 specimens has the lowest bearing capacity and tensile strength. With the increase of in-plane splicing spacing, the tensile strength shows a rising trend. When the in-plane splicing spacing is 30 mm, the tensile strength reaches the maximum value. All above is consistent with the conclusion of the previous analysis.
Conclusions
Two kinds of laminated woven composites with ply splicing of inter-layer splicing and in-plane splicing were designed rationally. The effect of ply splicing on the tensile properties of the composites was investigated experimentally. The strain field variation and damage evolution mechanism of the composites were analyzed using DIC and AE techniques, and the following conclusions can be made: 1. Under tensile load, the AE information revealed that the internal damage of the ply splicing woven composite was concentrated at the butt jointing location. The DIC strain showed the maximum strain emerges at the butt jointing location, and the composite finally broke at the butt jointing location. 2. There are differences in the proportion of damage modes of laminated materials with different ply splicing structure. In other words, the tensile damage mechanism of laminated materials with different ply splicing structure is different. The failure of inter-layer spliced specimens is mainly caused by fiber breakage. The failure of in-plane spliced specimens is mainly caused by fiber/matrix debonding damage and fiber breakage damage. 3. Ply splicing has little influence on the tensile modulus of laminated woven composites, but it has a significant influence on the tensile strength. Ply splicing reduces the materials' tensile strength, which is approximately determined by the number of continuous layers at the ply butt jointing location. 4. The more the number of continuous fabric layers on the surface, the higher the tensile strength retention ratio of the laminated woven composites with ply splicing. When the number of continuous fabric layers on the surface is higher than 2, the strength retention ratio of the laminated woven composites with ply splicing is higher than the proportion of the continuous fabric layers at the ply butt jointing location. 5. The larger the in-plane splicing spacing, the higher the tensile strength retention ratio of laminated woven composites with ply splicing. With an in-plane splicing spacing of more than 30 mm, the strength retention ratio is close to the proportion of the continuous fabric layers at the ply butt jointing location.
Footnotes
Declaration of conflicting interests
The author(s) declared no potential conflicts of interest with respect to the research, authorship, and/or publication of this article.
Funding
The author(s) disclosed receipt of the following financial support for the research, authorship, and/or publication of this article: This project was supported by the National Science and Technology Major Project (2017-VII-0011-0177), Major Science and Technology Special Project of Shanxi Province (20181102022), Innovation Team Training Program of Tianjin Universities (TD13-5043).