
Abstract
This study focuses on determining the effects of the upper material of running shoes on the mechanical power flows of the muscles of the lower limbs during the support phase of running. Two models of running shoes—differentiated only by the upper structure and material—have been used, being randomly assigned to 19 participants. Five measurements of each participant per shoe model were obtained at 3.3 m·s−1 to perform inverse dynamic analysis with the data obtained. Statistically significant differences have been found between the two models for the muscle power flow variables in the ankle, knee and hip joints, as well as at the ends of adjacent segments. The KNIT-upper model (model 2) presents higher generation (8.87 ± 7.63 W/kg; p < .001; d = -.13) and less absorption (−5.11 W/kg; p < .001; d = −6.7) of mechanical power in the ankle compared to the MESH-upper model (model 1). The mechanical power flows in the knee and hip indicate that with model 2, greater mechanical power is generated and absorbed by the flexor and extensor muscle groups of these joints compared to model 1 (-.38 ± 2.9 W/kg vs -.22 ± 2.54 W/kg for the knee and −1.75 ± 2.91 W/kg vs −1.15 ± 2.07 W/kg for the hip, respectively). Therefore, it can be concluded that the upper material has an influence on mechanical power flow patterns. However, more studies are needed in order to accurately and reliably establish the impact that the upper material of the shoes has on performance and on the prevention of sports injuries.
Introduction
The human musculoskeletal system, highly specialized in locomotion and running, interacts with the environment via the feet and footwear. Currently, running is one of the most played sports worldwide, with a width variety of specific footwear dedicated to it. A great amount of recreational runners run every day all around the world, 1 while a huge market has developed around the running shoe industry. 2 There are a number of investigations related to the total thickness of the midsole and the drop. 3 However, few researchers have focused on studying the effect of the upper.
Some studies, such as those of Onodera et al.,4,5 have found the upper to be a significant element of running shoes in terms of its effect on the biomechanics of running. However, these studies have focused on the entire shoe (rather than the upper in isolation), so it is impossible to identify which characteristic of the shoes studied has the greatest influence on the biomechanical changes observed during the run. 4 Despite this, the upper is the part of the shoe that varies the most in its characteristics. Materials are one of these factors that have a particular influence on running biomechanics, 5 although none of them had been investigated in the past with respect to the mechanical power flows of the muscles of the lower limbs during running. The application of new materials and components in the manufacture of sports shoes has opened up a debate regarding what is known as biomechanical doping. Different upper materials could limit, for instance, the dorsiflexion, and it could have a direct influence in the mechanical power flows. So that, the study of the effect of the upper material on the mechanical power flows of the muscles is of great interest for runners population.
Most running shoes are manufactured to reduce the chance of injury while trying to optimize the athletic performance. 6 Runners are among the most frequently injured athletes 7 ; indeed, Fields et al. 8 estimate that the half of runners experience an injury every year that stop them from running, with the knees being the location that suffer the most damage. 9 Likewise, it is not fully understood why there are different answer to footwear´s modifications, so that suggesting suitable footwear for each person is not an easy task. 6 In fact, when it comes to choosing one shoe model over another, users often tend to choose the most comfortable shoes according to their own comfort perception. 10 Even so, it is well known that different characteristics of shoes modify the mechanics of running. 11
For instance, the shock absorption systems embedded in the shoes boost the ground reaction forces and the net joint moments at the ankle. 12 Similarly, regarding performance, each type of footwear has a different effect on the energy consumption (metabolic cost) of runners, 13 while also playing a significant role in the mechanics of the ankle and, to a lesser extent, the mechanics of the knee and hip joints. 14 To understand this better, the biomechanical energetics variables must be taken into account because they contain the most information. 15 Thus, the mechanical energy of the segments can be computed from kinematic and kinetic data by way of the power flow analysis. 16 The change in the mechanical energy of a segment can be attributed to both the articular translation power and the muscle rotational power, through which muscle groups generate, absorb and transfer energy.15,17 These two factors are calculated by combining joint reaction forces and moments with joint and segment kinematics through inverse dynamics, 18 a methodology that is broadly used to calculate joint forces and moments. 19
In this way, since the upper has a large area of contact with the foot, it has a great influence on the fit and comfort, which in turn has a notable impact on the kinematic and kinetic strategies of users during sports practice. 5 Nevertheless, to the best of our knowledge, upper materials have not been investigated about how they could affect to mechanical power flows of the muscles during running. Therefore, the present study aims to determine the effect of the upper on the muscle mechanical power flows in the lower limbs during the support phase of running. Likewise, our hypothesis establishes that the influence of the upper on the running mechanics is sufficient to significantly modify the biomechanical variables in the study.
Methods
Participants
Nineteen recreational runners (13 males [height: 1.78 ± 0.04 m; body mass: 73.73 ± 5.65 kg] and 6 females [height: 1.64 ± 0.06 m; body mass: 57.18 ± 4.84 kg]) participated in the study. The participants were between 18 and 40 years old and they were amateur runners that ran an average of between 30 and 40 kilometers per week spread over 3 or 4 days. Criteria for inclusion included no history of lower extremity injuries within the last year, and no history of foot and ankle surgery within the past 2 years. The research was carried out in accordance with the stipulations of the University ethics committee (no. 1635313). All participants signed an informed consent form prior to the commencement of the study.
Experimental protocol
First, the participants performed a ten-minute warm-up on a treadmill wearing their own running shoes. Once the warm-up was finished, the participants were equipped with the motion capture system, and one of the two shoe models to be studied was randomly assigned to them. To control the running speed during the stance phase on the force platform with the dominant leg of each participant, a system of two photoelectric cells (Fotocélulas/IBV, Valencia, Spain) connected to the force platform was used. Running executions were determined as valid if the contact between foot and platform occurred when the participant had a running speed of 3.3 m·s−1 ± 10%. These executions were performed on a 14-meter walkway; the distance between the start and the force platform was 7 meters. Five valid executions for each participant per shoe model were considered. After changing from one shoe model to another, the calibration of the inertial sensor system was performed again.
The measurement systems used were the Xsens inertial motion capture system (Xsens MVN Awinda, Xsens Technologies B.V., Enschede, Netherlands) and a force platform (Dinascan/IBV, Valencia, Spain), embedded in a walkway at a sampling frequency of 100 Hz and 1000 Hz, respectively. The body dimensions of each participant were measured and entered in the Xsens MVN Analyze software, Version 2020.1 (Xsens Technologies B.V., Enschede, Netherlands) while the inertial sensors were placed in those anatomical locations recommended by the manufacturer: dorsal side of the foot, lower leg (flat surface of the tibia), upper leg (lateral side), pelvis, sternum, shoulders, upper arm (lateral side), wrists, dorsal side of the hands and head. The two analysed KELME models of running shoes (Figure 1) have the same composition and design for the soles, midsoles and insoles, but different structures and materials for the upper. The sole features Phylon Tech and Cushion Tech technology with a neutral tread and medium cushioning, and a drop of 10 mm. Shoe model 1 (Condition 1) incorporates an upper made out of a 47% MESH material having a double-layered exterior with a porous surface of the outer shell, and a 53% of synthetic leader bands for reinforcements in the lateral and anterior side of the shoe, while model 2 (Condition 2) has an upper manufactured with seamless one-piece engineered KNIT and synthetic leader only for the logo of the brand in the lateral side, without any reinforcements in the upper. Running shoes model 1 with MESH upper (down) and shoes model 2 with KNIT upper (up).
Experimental procedures
Due to an absence of literature providing inertial parameters and the relative positions of toe segments, 20 the Xsens® biomechanical model (the original kinematic model) was modified to fit the link-segment model (as defined by De Leva) in order to establish both the inertial characteristics and the linear kinematic variables of the segments. The calculation of the forces and moments of articular forces was carried out through inverse dynamic analysis. The positions, velocities and linear accelerations exported by the Xsens MVN Analyze software are derived from the origin of each segment. 21 Therefore, to apply these variables into the inverse dynamics equations, a translation towards the centre of mass of the segments is required. For this, the position vector was calculated using the anthropometric scaling measurement based on the adjustment of the Zatsiorsky-Seluyanov inertial parameters carried out by De Leva, 22 which converts the Zatsiorsky-Seluyanov data to the form established by Dempster 23 and Hanavan. 24 Likewise, according to the method developed by Dapena 25 for scaling the segment moment of inertia values established by Whitsett, 26 both the masses of the segments and their moments of inertia were defined from the linear scaling of the total mass of the body and the radii of gyration, using the values defined by Winter 15 with respect to the proportions of the masses and lengths of the segments, respectively.
The muscle mechanical power is defined by calculating the net joint moment and the angular velocity of each segment. These muscle mechanical power flows in the joints are defined by the difference in muscle power between the proximal and distal ends of the segments that make up each of these joints.27,28 The positive power at the ends of the segments indicates the Watts/kilogram (W/kg) of mechanical power that are entering the respective segments through the transfer of mechanical energy by the muscle groups responsible for the rotation of said segments. Conversely, the negative power at the ends of the segments indicates the W/kg that are leaving the segments. Therefore, power flows determine the W/kg that are being generated or absorbed by the muscle groups responsible for the movement of the segments. 29 In this way, the power flow between segmentsis defined by the muscle power values of its distal and proximal ends. Thus, the computed variables in this study were the proximal and distal net muscle mechanical power values of the lower limb segments and the mechanical power flows through the ankle, knee and hip joints.
Data analysis
To synchronize in time the measurement systems, the initial instant was established as the frame in which the motion capture system and the force platform registered the foot contact and the centre of pressure, respectively. The signals recorded at 100 Hz with the inertial sensor system were extended to 1000 Hz to match the force platform sampling rate. The spatial synchronisation was carried out during the support phase. For this, the centre of pressure position and the external moment of force were expressed with respect to an external contact point. This corresponds to the vertical projection of the ankle on the platform when the foot hits the platform with the heel or, conversely, the vertical projection of the metatarsophalangeal joint in case of forefoot contact. The segment angular velocities and accelerations, as well as the linear accelerations of the origins of each segment, were filtered with a second-order low-pass Butterworth filter with a cut-off frequency of 6 Hz. The same filter was applied to the ground reaction forces and the external moments of force but with the cut-off frequency set at 15 Hz. The calculation of the target variables and the data processing were performed by a software application developed with Python (Version 3.8.5). Figure 2 displays a block diagram depicting the algorithm that has been used to process the data and to compute both the model´s kinetic variables and the muscle mechanical power flow variable. Algorithm’s block diagram to compute the muscle mechanical power flow. d = anthropometric dimensions, m = mass, l = length, p = position, CP = centre of pressure. The subscript i denotes the i-th segment´s variable, while the subscript o indicates that the variable is defined in the origin of the segment.
Statistics
The statistical program SPSS (IBM, SPSS, v. 27.1, IBM Corporation, Amonk, New York) was used to carry out the statistical analysis of the net muscle mechanical power of the body segments and their respective power flows. Specifically, after checking the normality of the variables, the T-test for related samples was used to study the influence of the two shoe models on the studied variables. Significance was set at α = 0.05. The results are presented as mean ± standard deviation (SD). In addition, the effect size was assessed using Cohen’s d (≥0.2, small; ≥ 0.5, moderate; ≥ 0.8, large). 30
Results
Mean, standard deviation (SD), significance (p-value), and effect size (Cohen’s d) with 95% Confidence Interval (CI) of the paired-sampled T test regarding to segment ends mean powers and to the muscle mechanical power in the joints during the stance phase for shoes model 1 and 2.
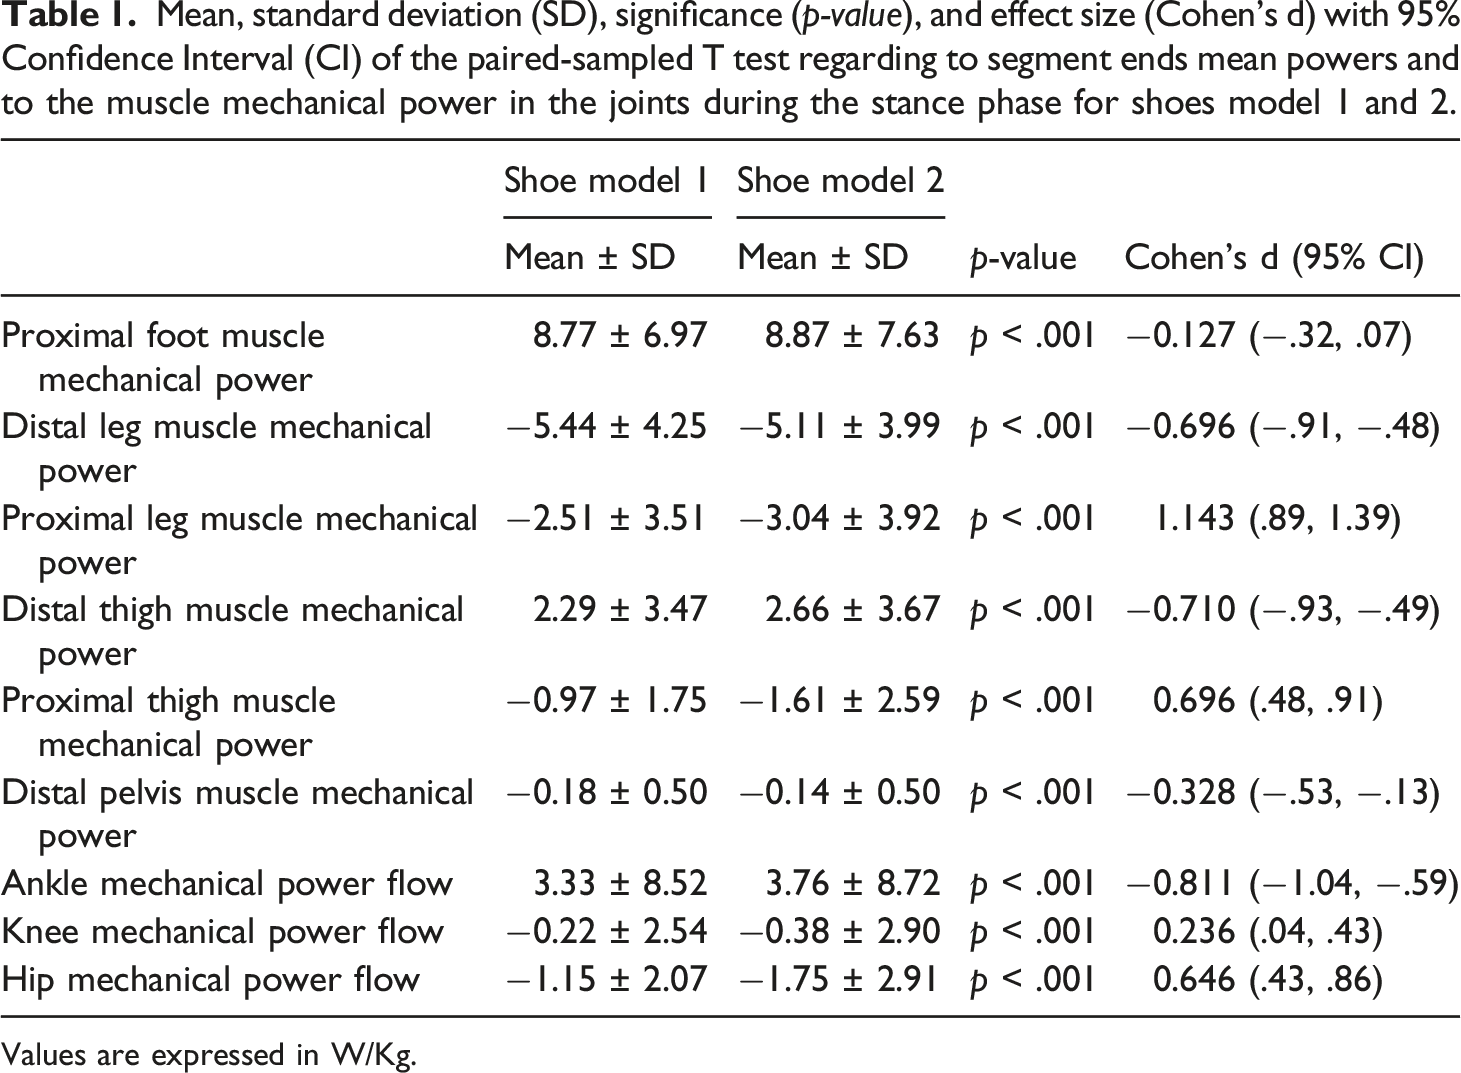
Values are expressed in W/Kg.
Figure 3 illustrates the three-dimensional muscle rotational mean mechanical power curves (W/kg) of the proximal and distal ends of the leg and thigh segments of the proximal ends of the foot and the distal ends of the pelvis for both Condition 1 and Condition 2. For the ankle joint, with shoe model 1, a peak mechanical power flow of 18.94 W/kg and a minimum of −8.26 W/kg were recorded, while corresponding figures of 19.86 W/kg and −7.82 W/kg were observed with model 2. For the knee joint, a maximum mechanical power flow of 3.98 W/kg and a minimum of −5.46 W/kg were recorded with model 1, while model 2 yielded a maximum value of 4.10 W/kg and a minimum of −6.44 W/kg. Finally, for the hip joint, values of 1.17 W/kg maximum and −5.84 W/kg minimum were obtained with model 1, with the values for model 2 being 1.38 W/kg maximum and −7.93 W/kg minimum. Tridimensional mean muscle mechanical power (W/kg) of the proximal and distal foot, leg, thigh and pelvis ends and the ankle, knee and hip mechanical power flows during the stance phase for the shoe models 1 and 2.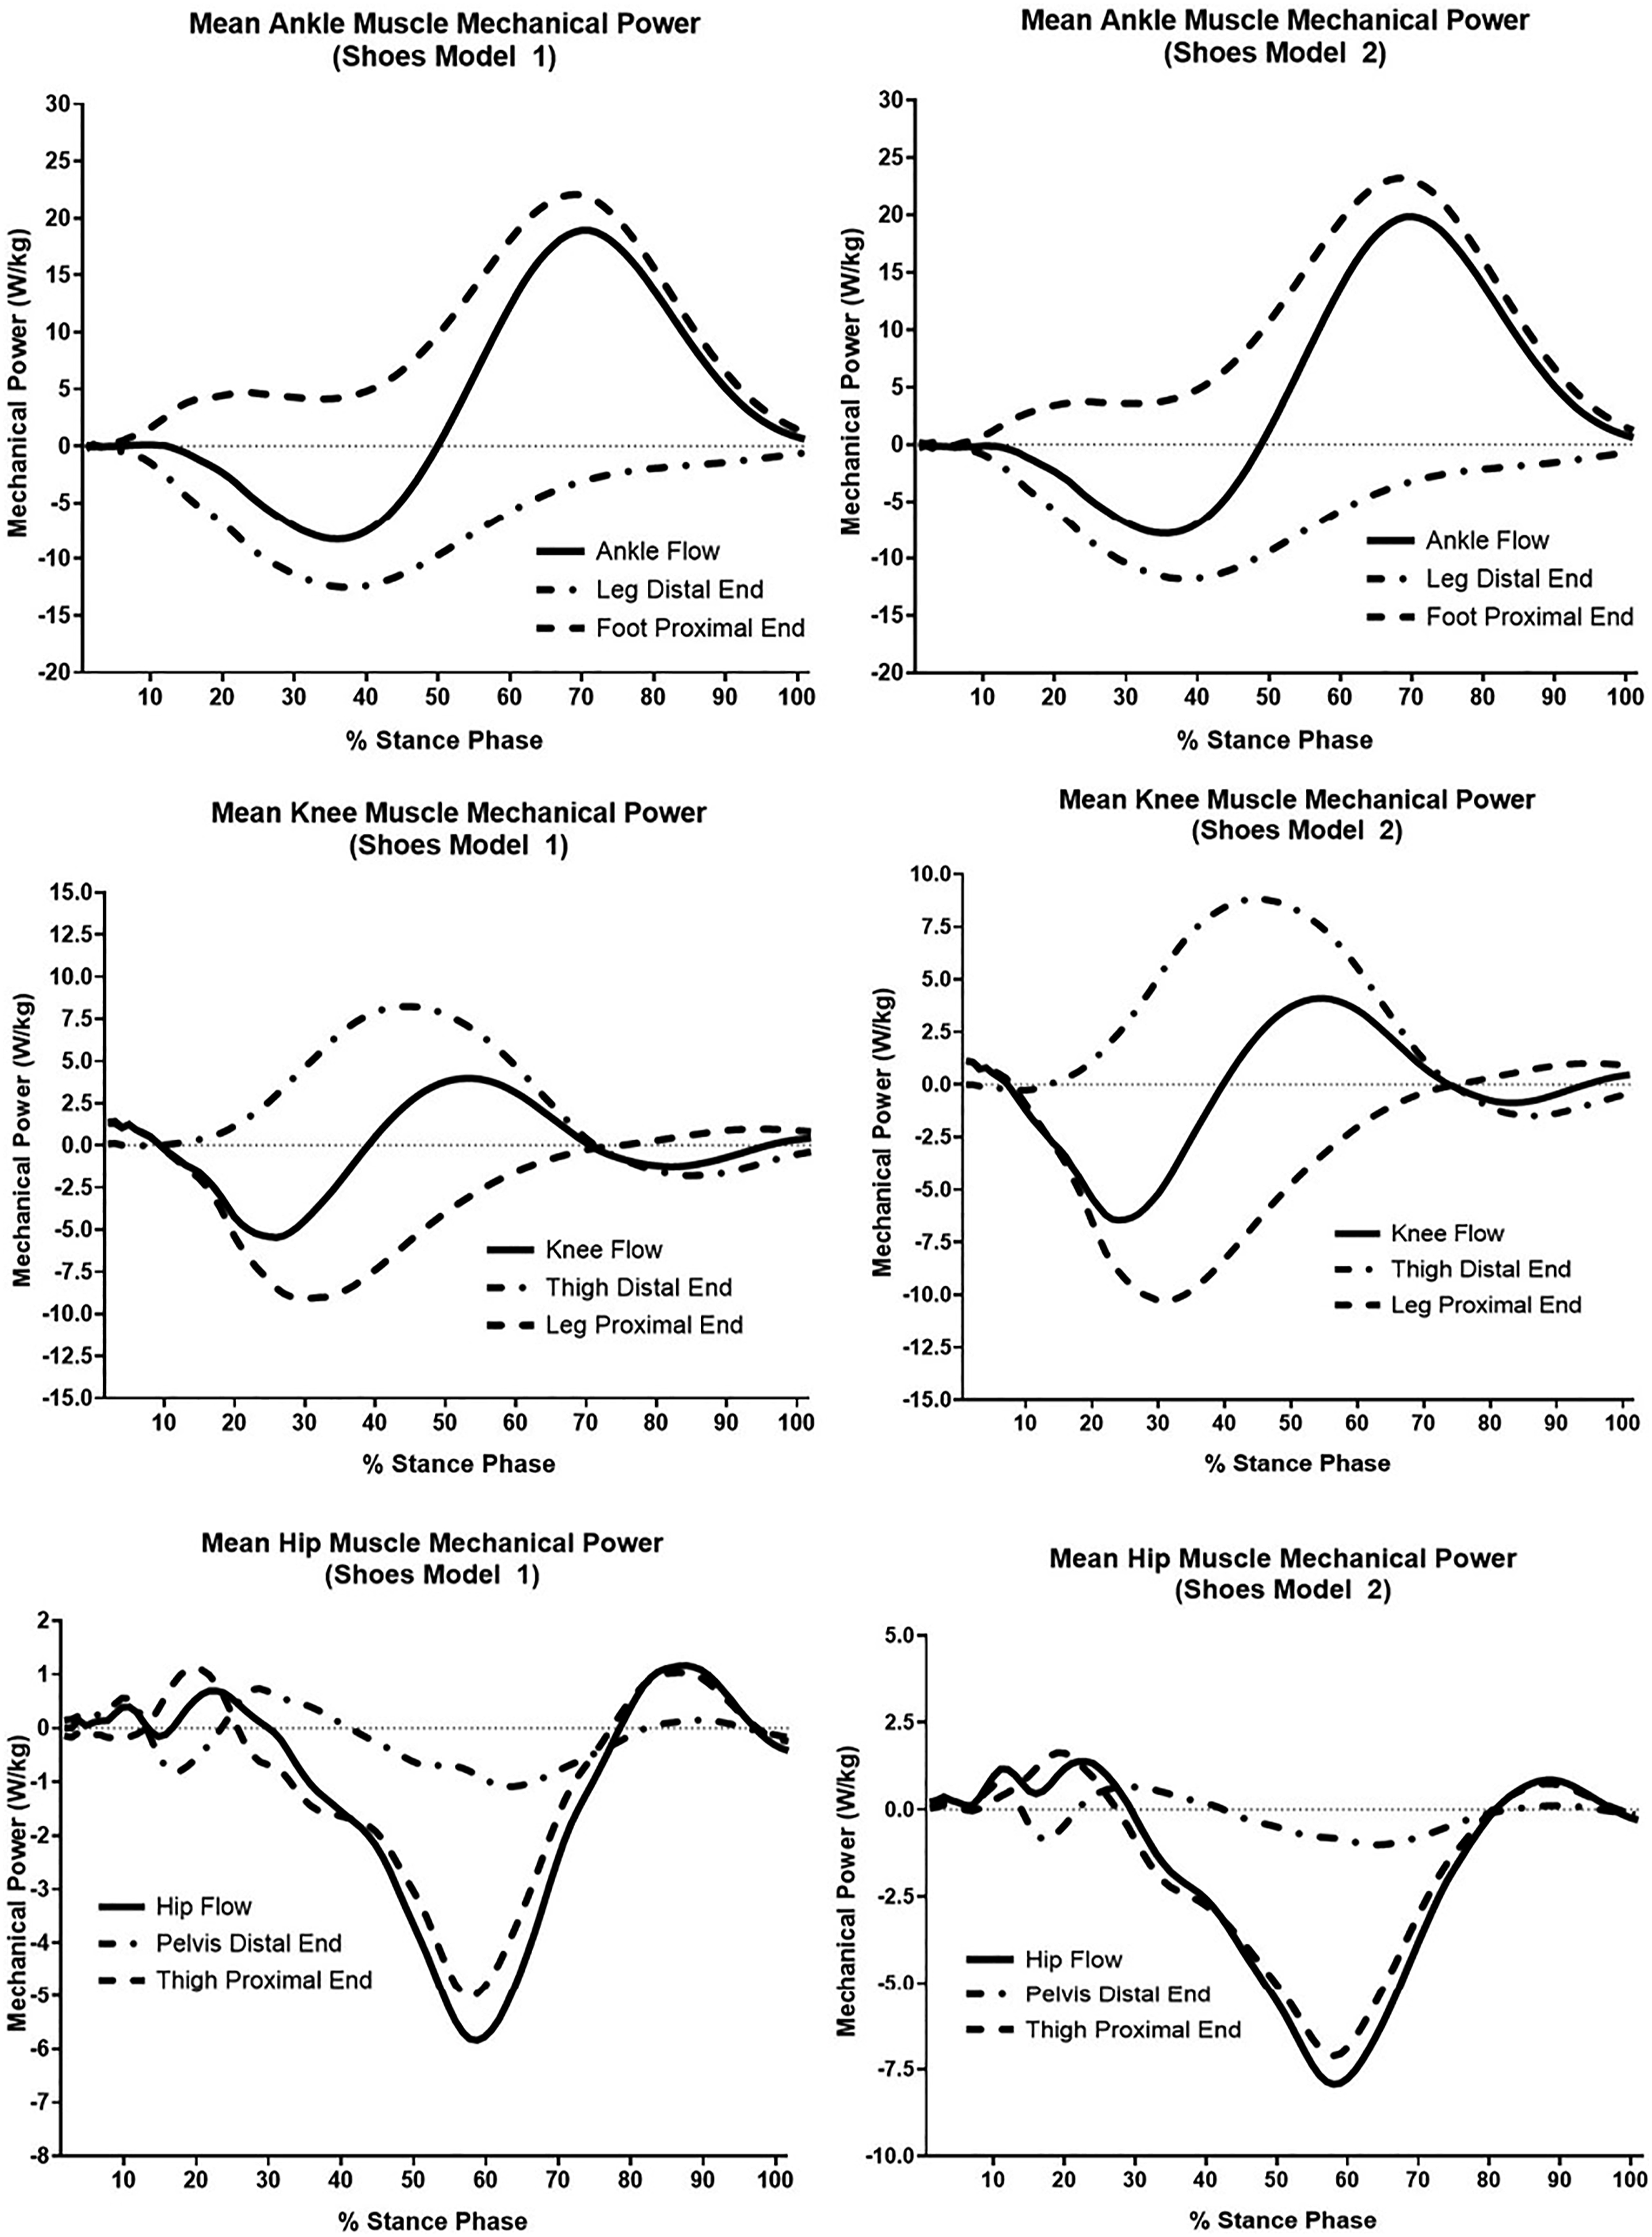
Discussion
This work aims to determine the effect of the running shoe upper on the mechanical power flow of the lower limbs during running. There is little research examining the effect of the upper on running biomechanics, while studies of its effect on power patterns and mechanical energy are non-existent. Such studies as there are have investigated, on the one hand, the influence of the type of construction of the upper on plantar pressure distribution 4 and, on the other, its effect on joint angles and external reaction forces. 5 Therefore, the current investigation has attempted to alleviate the absence of studies on the upper section of shoes. Although the influence of the upper on biomechanics is not clear, 4 this study revealed significant differences between the two shoe models in terms of the variables of muscle mechanical power (Table 1).
In the present study, for both shoe models, the same pattern of muscle contractions during the stance phase of the run was observed. This pattern, according to that presented by Winter 31 for each joint, was characterized in the ankle by an eccentric contraction of the plantar flexor muscles followed by a concentric contraction of the plantar flexors. Regarding the knee joint, an eccentric and concentric contraction pattern occurred, firstly in the knee extensor muscle groups and then in the flexors. In the hip, three distinct phases were noticeable: one of eccentric and concentric contraction of the extensor muscles, another of eccentric contraction of the flexors, and a final phase of concentric contraction of the hip extensor muscle groups. Regarding mechanical power, shoe model 2 obtained more mechanical power in the three joints studied, having the larger difference in the ankle joint (d = −0,81), possibly meaning that this model of running shoe requires greater mechanical stress to move the segments, which could lead to a deterioration in physical condition. 19 This, in turn, could mean a higher metabolic rate which would translate into a decrease in performance. 32 On the contrary, since model 2 also absorbed more mechanical energy in the knee and hip, it could pose a greater risk of injury to the muscle groups that control these joints, since this absorption is related to the eccentric contractions of those muscle groups. 15
Regarding rotational mechanical power, what are known as active flows of mechanical power 15 could be observed. As shown by the curves in Figure 3, in the ankle joint it was observed how, during the entire stance phase, the mechanical power tended to transfer from the leg to the foot. At the same time, the muscles responsible for the plantar flexion of the foot initially absorbed the power that was transferred from the leg but was not picked up by the foot and, finally, ended up generating the power that reaches the foot in greater quantity than that being transferred from the leg. This could suggest that in inter-segment coordination, the effects on mechanical energy of the opposing net muscular moments were focused on controlling the power flows within each segment, which could have a benefit to the joints similar to that of co-contraction. 33 Similarly, and supported by the power flows presented by Hoga et al., 34 in the knee joint there was a mechanical power transfer from the leg to the thigh—except at the end of the stance phase, where said transfer is reversed. In this process, the muscles that are responsible for the extension of the knee absorb mechanical power at the beginning of the stance phase. Next, these muscles generate power and, finally, the knee flexor muscles absorb the mechanical power that is not transferred from the thigh to the leg. In the hip, there was a predominant pattern of mechanical power absorption by the hip flexor muscles—due to the predominant occurrence of a flexor moment—which coincided with the loss of mechanical power in the pelvis and thigh. In contrast, at the beginning and at the end of the stance phase, an extensor moment of the muscle groups of the hip joint took place, characterized by the generation and transfer of mechanical power from the pelvis to the thigh. Even using different models not applied to running, these findings were consistent with those obtained by Riley et al. 35 and Neptune et al. 36 where the plantar flexor moments of the ankle mainly added mechanical power, while in the hip, the power was absorbed by the flexor moments. During the stance phase, the muscle mechanical power calculated for the ankle and knee joints showed a pattern similar to that recorded by Buczet and Cavanagh. 37 Furthermore, as mentioned above, these calculated variables allowed the muscular contribution of the uniarticular muscle groups to be determined, but not the contribution of those that crossed two joints. 38 According to the findings of Winter 31 and the results obtained in the present study, it can be deduced that in the stance phase during running, the ankle and knee muscle groups were both absorbers and generators of mechanical power. Nevertheless, the ankle was the main power generator while the knee and hip muscles were the main mechanical power absorbers. It should also be noted that mechanical power levels were higher in the ankle than in the knee and hip.
Finally, the present study has defined the flows of muscle mechanical power that characterize the support phase of running based on the upper part of shoes. This information can be of great help in choosing one particular shoe model over another, taking into account the individual running patterns of each user. However, more research is required before a viable scientific guide for this part of the shoe can be produced.
Regarding the limitations of the study, the synchronization of both systems (motion capture system and force platform) was not done automatically by any software but it was performed just before every repetition, being time-consuming. Otherwise, electromyographic signals could be of interest to measure electrical muscle activity in this study, although authors have planned to do in the short future.
Conclusions
During the support phase in the run, compared to the MESH-upper model, the KNIT model of running shoes showed a greater generation of mechanical power, as well as a lower absorption thereof due to the flow of mechanical power in the ankle. In addition, the mechanical power flows in both the knee and hip indicated that the KNIT model had more mechanical power and absorption by the flexor and extensor muscle groups of these two joints compared to the MESH model. It can be concluded that the upper has an influence on mechanical power flow patterns, so that practitioners and manufacturers can take into account these results when choosing and designing new models of running shoe. However, more studies are needed to accurately and reliably establish the nature and extent of the impact of the shoes’ upper material on performance and the prevention of sports injuries.
Footnotes
Acknowledgements
The authors would like to thank the KELME company for providing all shoe materials used in this study without any commercial interest.
Declaration of conflicting interests
The author(s) declared no potential conflicts of interest with respect to the research, authorship, and/or publication of this article.
Funding
The author(s) received no financial support for the research, authorship, and/or publication of this article.