
Abstract
The woven fabric composites were used in different industries for their special specification. This study aimed to address failure mechanisms in single-layer woven fabrics. The acoustic emission (AE) technique and wavelet transform were used for composite structural health monitoring and failure rate evaluation. From a mechanical study viewpoint, the load-displacement behavior of plain-woven glass composite was examined under tension in the principal directions (0 and 90°) and off-axis (30, 45, and 60°). The results indicated that off-axis samples are deformed and curled due to the slippage and rotation of warp and weft yarns. The mechanical measurements were synchronized with the AE data in an acousto-mechanical study. The load-displacement behavior of samples was zoned out with two criteria: frequency and energy. Eventually, three failure modes were identified: matrix damage, interface damage, and fiber breakage. The results showed that events with a frequency above 400 kHz at different angles could be attributed to fiber breakage. Also, the applied force angle effectively affects the type of fiber failure (tensile and shear failure). It was found that in addition to tensile failure, shear failure also increases sharply by increasing the angle between the main directions. So that the maximum number of shear fiber failures occurred at the angle of 45° between the main directions. On the off-axis, the number of fibers exposed to the load also increased, increasing the number of breakages.
Keywords
Introduction
Woven fabrics are among reinforcement textiles. This type of reinforcement shows different functions from uni-directional reinforcement due to its complex woven warp and weft interlaced yarns. In order to study the properties of composites, it is necessary to subject composites of layered structures and design angles to tensile loads. Woven fabric characteristics and load conditions affect the failure mechanisms of this kind of composite. One of the nondestructive methods to monitor composites’ failure is Acoustic Emission (AE). In the AE technique, the fracture-caused sounds are transmitted to the data logger as a received frequency wave is converted into a data descriptor, such as frequency, energy, amplitude, cunt, and time. 1 Acoustic emission can represent different types of loads, including tensile, fatigue bending, compression, and impact loads applied to structures, demonstrating their effects on the mechanical properties of a structure. 2 More than one descriptor can be used as criteria in each research to measure failure and classify failure modes because more criteria help prohibit overlapping data and clarify classification.3,4 There are different clustering methods, including K-means,5,6 C-means, 7 and sentry function. 8 One of the methods is wavelet transform, which uses two criteria of frequency and energy and classifies data by the entropy method. 9 Some researchers have used a combination of wavelet transform and other methods. 10
Some researchers have tested a single fiber with a tensile test and examined its failure and failure sequence by acoustic emission. 11 Moreover, this method is used to recognize fibers. 12 Some examine the tensile of yarn by the acoustic emission method and the fiber breakage sequence in the yarn. 13 Some researchers have studied uni-directional laminates under tension by acoustic emission. 14 Some others have analyzed UDs at different tension angles. 15 Some researchers have studied the effect of pattern weave on composite mechanical properties, 16 some types of different layered configurations, and hybrid reinforcements. 17 Some researchers have used a combination of acoustic emission and other methods to evaluate structural health. 18 In all cases, the acoustic emission results agreed with the mechanical results and SEM images. Acoustic emission has long been recognized as a reliable method.
In the loading of composites, it is crucial to examine the initiation and propagation of cracks and predict damage propagation. 19 Some other researchers studied other failure stages, i.e. matrix-fiber interface breakage and fiber breakage apart from matrix breakage. 20 Delamination is among the most important and frequent failure phenomena in composites, examined in many studies. The delamination time and location are crucial in structural failure investigations. 21 Delamination was mentioned as macro-damage in some studies. 22 In general, delamination has serious effects on the mechanical properties of the composite and reduces strength. Moreover, acoustic emission parameters, such as the sensor type, piezoelectric type, the number of sensors, and connection type, significantly affect the results. 23 Most studies evaluate classifications using microstructural observations, such as scanning electron microscopy (SEM), C-scan, digital camera images, and X-ray tomography.24,1
A literature review indicated that the effects of tension directions on failure mechanisms of single-layered plain-woven fabrics had not been reported using acoustic emission. The present study primarily seeks to evaluate the performance of the single-layered reinforcement structure under tensile loading in different directions and identify the effects of the fabric structure on the tensile behavior of the fabric using load-displacement curves and acoustic emission parameters at the same time (acousto-mechanical). Wavelet transform is used to classify failure mechanisms, such as matrix, fiber fracture, and debonding of fiber-matrix in different loading directions. Also, this study addresses the occurrence of some events, such as structural reinforcement changes in different directions in plain-woven fabrics.
Materials and methods
Materials
The present work employed glass/epoxy composites.
Woven fabrics
In order to fabricate the composites, plain-woven glass fabric was utilized. Figure 1 shows a plain-woven structure. Plain woven scheme.
25

Specification of the reinforcement fabric.
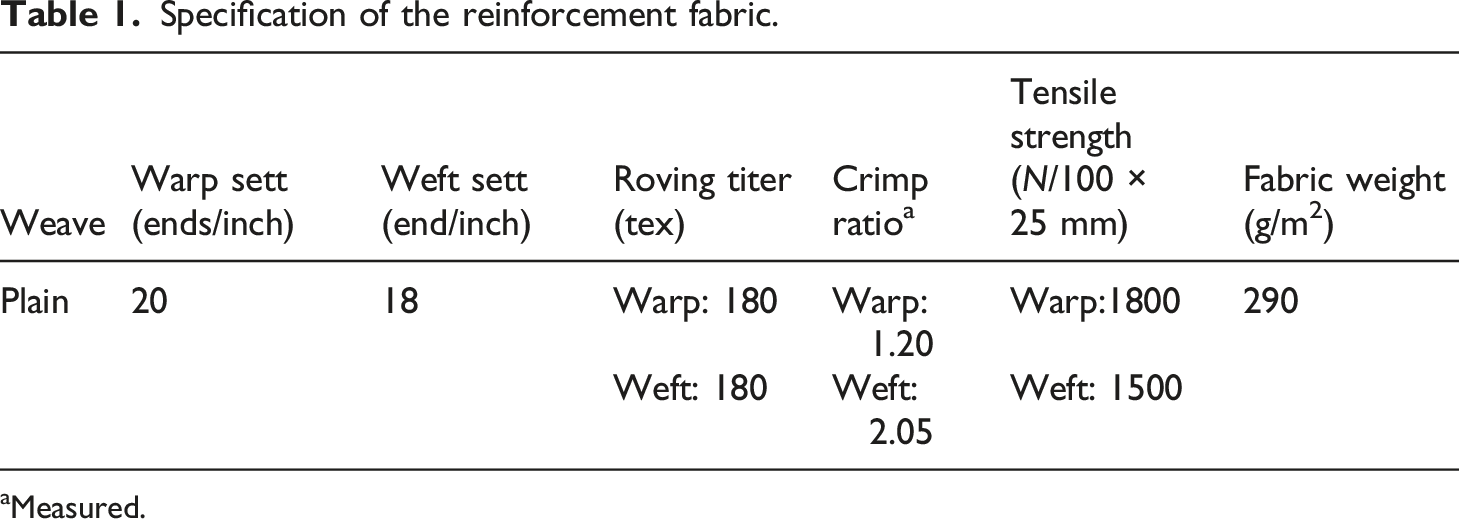
aMeasured.
Polymer matrix
Mechanical properties of EPL-1012 resin.

Methods
Fabrication of composites
The present study fabricated five composite sheets using the vacuum infusion process (VIP) at 0.7 bars. In VIP, it is required to eliminate bubbles (voids) from the resin-hardener mix. Composite sheets were exposed to the ambient temperature for 7 days so that the resin would be completely cured. The composite sheets had a size of Composite cutting inclinations.
Five specimens were subjected to the tensile test and acoustic emission at each inclination. It should be noted that the specimens had a size of
Specimens
Specimens and warp inclinations.

Specification of the composite specimens.

Due to the use of VIP method to make the composite and the existence of a minimum void, the value of VVF is ignored.
Tensile test
Based on the tensile composite standard (D-3039-D3039M), the composite specimens were subjected to a 5-ton HIWA tensile test machine with a 2 mm/min rate. The tensile test results were evaluated using load-displacement/acoustic emission diagrams. 26
Acoustic emission
Acoustic emission waves are elastic waves arising from the abrupt failure-induced strain energy release in a structure. It should be noted that these failures stem from internal or external stresses. The measurement and identification of elastic waves can provide valuable insights into, for example, failure causes. A PCI2 system with a data record rate of 1 Ms/s and AE-Win were used to record the acoustic data. Two broadband single-crystal piezoelectric R-D50 PICO sensors manufactured by PAC Company were used. The sensors had a resonance frequency of 513.2 kHz and an optimal operating range of 100–700 kHz. The sensed waves were amplified using a preamplifier with an amplification coefficient of 40 dB. Silicon grease improved signal permittivity between the specimens and sensor and provided a sufficient connection to the specimen surface. A threshold of 35 dB was applied to eliminate background noise during sampling. Sounds arising from composite variations would be received by the sensors and sent to a data logger to be analyzed. One of the sensors was placed on top of the specimen and near the upper jaw, while the other sensor was positioned almost in the middle of the other side of the specimen.
Wavelet transform
Wavelet transform is a relatively new approach to processing signals and images. Useful information can be derived by analyzing signals and waves in applications. Any sound extracted from the sample under test is a signal. Each signal has several wave types. In reinforced polymeric composites, Daubechies family waves are used to process. Wavelet transform is divided into discrete wavelet transform (DWT) and continuous wavelet transform (CWT). Discrete wavelet transform uses only high frequencies, while much information is available at low frequencies that give us accurate information, as shown in Figure 3 schematically. Therefore, both low and high frequencies are used in continuous wavelet transform. A schematic of the CWT tree (L: low-frequency part, H: high-frequency part).
24

Mathematically, it can be said that a wavelet is a wave with a limited period and an average of zero. Function Ψ is referred to as the mother wavelet (or wavelet) if

If Ψ is limited in the time-domain (b) and frequency-domain (a), then
The present study adopted the continuous wavelet transform (CWT), where both high and low frequencies are utilized


Each wavelet has finite energy and lies in a different position from the other wavelets at the time axis. It approaches zero at a sufficiently far position from its central position. Concerning acoustic emission signals, signal analysis is performed based on energy since each failure level has a different distribution. Then, it can be decomposed into wavelet sub-signals as a continuous wavelet transform
Thus, energy can be classified into distinct levels. The given level of energy is calculated as follows
Also, the total energy is obtained as follows
The energy distribution ratio of a given level is given by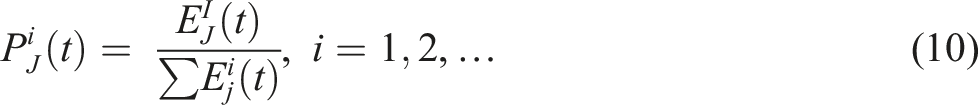
Hence, the failure mode and damage extent (percentage) can also be found by the frequency and energy percentage of all failure modes approach.27,28
Microstructural observations
To capture detailed images of composite failure, SEM was employed. The specimens were fixed on a carbon fixture and covered by gold to obtain sufficient conductivity. The specimens were cut into a size of (1×1) cm 2 . The present study employed an Sc7620 machine manufactured by Seron Technology Co. with a solution of 3.5 nm. The SEM images were exploited to validate the acoustic emission results.
Results and discussion
Mechanical properties
Figure 4 shows the load-displacement curves of the first specimen of each group at different angles. Load-displacement curves of P1 at different inclination angles.
As shown in Figure 4, the displacements at the angles 0 and 90° were smaller than those at the other angles. That can be explained by the load acting directly on the reinforcement yarns at these two angles since the yarns and tensile load have the same direction, and the elongation of glass yarns is small. This small elongation arises from the flattening (open) of warp crimps. According to Figure 5(b), the largest displacement occurs at 45°. At this angle, some of the tensile load are transformed into shear load in the fibers.29,30 Thus, the load is not directly applied to the yarns. The rest of the tensile force tends to align warp and weft yarns to the tensile direction. The warps and weft yarns undergo rotations and slippage (this phenomenon especially happens in single-layered composite). As a result, the displacement is maximized at 45°. According to Figure 5(a), strength is higher at the angles 0 and 90° than at the other angles since the load acts directly on the reinforcement yarns at these two angles. Glass fibers have low shear strength. As a result, strength is lower at other angles than 0 and 90°. Figure 5(a) demonstrates that strength is higher in the warp direction (i.e. 90°). That can be attributed to the lower warp yarn density (11%), reducing crimps, and enhancing strengths. It should be noted that a lower density refers to fewer yarns (Table 1). Increasing crimp in principal direction and off-axis reduces strength and improves the interface and strength, respectively. In principal directions, 90° has 60% more strength than 0° relating to fewer crimps, and the displacement difference is insignificant. 45° reduce strength by 145% rather than warp direction on the off-axis. This amount for 30 and 60° is 98% and 142%, respectively. Average peak strength at all the angles (a) and peak displacement (b).
Displacement comparison for 45° increases 133% rather than tensile direction, and this amount for 30 and 60° is 115% and 56%, respectively.
Acoustic emission behavior of the specimens
The signals released by the specimens during the tensile test were analyzed using the acoustic emission technique. A total of 26 describer parameters, including energy, frequency type, count, time, and domain, were obtained from the test. The mechanical properties and damage of the composites can be more accurately evaluated using these parameters. 1 It should be noted that the peak frequency and cumulative energy (sum of the released energies) were two criteria for analyzing the composite by acoustic emission. Finally, an energy-based wavelet transform was used to classify failure modes. To obtain further insights, tensile and acoustic emission tests were synchronized to get more useful information about failure modes and called acousto-mechanical.
Acousto-mechanical behavior at 0 and 90°
Here, the mechanical behavior of single-layered composites is analyzed to examine the failure development behavior of the specimens through the acoustic emission frequency and cumulative energy. Figures 6 and 7 show the peak frequency and cumulative energy diagrams. The diagrams were divided into four sections based on tensile curve variations. Frequency classification was carried out based on Ref. 28 Introduction section shows no significant damage, and the load-displacement curve linearly rises. Also, there is no signal of energy (Figures 6 and 7(b)) or frequency (Figures 6 and 7(a)). Materials and methods section shows the initiation of matrix and interface micro-cracks and some signals of frequency and energy. A small load increase significantly increases the displacement due to the crimp interchange in Materials and methods section. Diagrams of (a) peak frequency and load and (b) cumulative energy and load versus time for P1-0. Diagrams of (a) peak frequency and load and (b) cumulative energy and load versus time for P1-90.

Increased load reduces the warp crimps and increases the weft crimps called crimp interchange, leading to jamming yarns. 31 In Results and discussion section, a rise in the load increases micro-cracks and results in micro-crack aggregation in the matrix and interface. Micro-cracks change to macro cracks by increasing the signal energy level (Figure 6(b)). An increase in the load induces cracks in the matrix, which is the difference between Materials & methods section and Results & discussion section. Cracks propagate forward but cannot break the fibers when they reach them. They propagate along the fibers, separating the matrix from the fibers. Thus, Results and discussion section can be referred to as the fiber-matrix separation zone. Also, major changes occur in the mechanical behavior of the load, with the signal energy level rising. These distinguish Results and discussion section from Materials and methods section. In Conclusion section, cracks significantly grow, and the matrix cannot resist the crack force. The load act on the fibers, and the fibers begin to break as the load increases, leading to an abrupt rise in the signal energy level. As shown in Figure 6(a), fiber breakage aggregation gradually rises. According to Figure 6(b), the signal energy level of fibers appears and undergoes a significant elevation in two stages, leading to a structural failure (not yield). Thus, Conclusion section can be referred to as the fiber breakage zone at angles 0 and 90°. Introduction section and Materials & methods section are very small, with no clear distinction since the present study investigated single-layered composites.
Note: In Figures 6, 7, 9, and 10, charts were divided as Figure 6(b).
It should be noted that the matrix and interface were not required to be separated since the specimens were single-layered composites. However, the matrix and interface are well separated by the energy-based wavelet transform. The authors would have analyzed delamination if the specimens had been multi-layered composites. Figure 7 shows the peak frequency and cumulative energy versus time for P1-90.
Figure 8 shows the photos of the composite failures at the angles 0 and 90° after the tensile and acoustic emission tests. As mentioned, fibers are responsible for resisting the load at the angles 0 and 90° and undergo linear breakage. Samples after the tensile test kept planar shape, and no 3D deformation happened. In Fig. 8(b), samples were cut linearly after changing the behavior, for which we could not find a logical reason. The composite breakages at the angles (a) 0 and (b) 90°.
Acousto-mechanical behavior at 30 and 60°
The behavior of the single-layered composites at angles 30 and 60° was shown in Fig. 9. Introduction section contains no signal of frequency and energy at angles 30 and 60°, implying that no breakage occurred. Materials and methods section shows the initiation of micro-cracks and crimp interchange. Also, energy signals are observed for matrix and interface breakage. In Results and discussion section, composites show significantly different behavior as the load increases by increasing the signal energy level. That can be attributed to micro crack aggregation and macro crack initiation.
Most importantly, the tensile load at angles 30 and 60° transforms into a shear load. As mentioned, glass fibers have low shear strength. Shear failure is higher in locations where fibers are weak. Conclusion section shows a significant growth of cracks. The load directly acts on the fibers. That can be inferred from elevated signal energy levels and higher fiber breakage. All four sections agree with the mechanical results regarding the peak frequency and cumulative energy. As the composite had the same behavior at angles 30 and 60°, only the diagrams corresponding to 30° are provided.
Acousto-mechanical behavior at 45°
The composites showed very different behavior at 45°. Figure 9 shows the peak frequency and cumulative energy diagrams at 45°. As can be seen, Introduction section shows no breakage or frequency/signals. The composite had completely elastic behavior in Introduction section. Materials and methods section shows the crimp interchange; however, the crimp interchange is much lower than that at 0 and 90°. In particular, fibers undergo rotations and slippage at 45°. However, rotations and slipping are very small, with no frequency and energy levels. Diagrams of (a) peak frequency and load and (b) cumulative energy and load versus time for P1-30.
In contrast to the other angles, in Results and discussion section, fibers first begin to break since these angles have the largest tensile-to-shear load transformation, and fibers have low shear strength and easily break. As shown in Figure 10, Results and discussion section experiences large load rises. This is further confirmed by the energy and frequency levels. That suggests that fibers have lower shear strength than the matrix. Conclusion section at 45° is the same as Results and discussion section at 0 and 90°, meaning that fibers break, and the matrixes break as the load increases, along with separating fibers from the matrix. It should be noted that the failure sequence is confirmed via the mechanical and acoustic emission results. Ultimate failure occurs in Conclusion section due to numerous fiber breakages. Diagrams of (a) peak frequency and load and (b) cumulative energy and load versus time for P1-45.
Generally, fiber breakage occurs later at angles 0 and 90° than at 30, 45, and 60°, increasing the test duration and postponing the failure. However, the rotation and slippage of warp and weft yarns and the transformation of the tensile load into shear load are also influential factors.
It should be noted that, among the angles 30, 45, and 60° (off-axes), Results and discussion section experienced fiber breakage only at 45° due to the maximum transformation of the tensile load into a shear load. Figure 11 shows the photos of the broken specimens at 30 and 45°. As can be seen, the failure section is inclined at 30° (and 45 and 60°), suggesting the transformation of the tensile load into a shear load. Also, since the specimens were single-layered composites, the load transformation and warp/weft rotation and slippage completely changed the structures of the specimens, leading to a curling deformation. Actually, residual tensile force (not change to shear) aligns warp and weft to tensile directions. Failure photos of the specimens at (a) 30 and (b) 45°
Failure mechanism evaluation using wavelet transform
There are numerous signals with different waveforms for each specimen under the tensile test and acoustic emission. Daubechies waveforms are typically employed in composites. Once the acoustic emission signals were derived, they were introduced to MATLAB to use wavelet transform. The classification code of MATLAB was used, and the third-order (third level) signal analyses were selected based on the entropy criterion and previous studies.32,33 MATLAB produced eight graphs for frequency analysis and eight for energy analysis, as shown in Figure 12. Wavelet transform results for (a) frequency domain of each sub-signal in the third order and (b) energy distributions of the third-order sub-signals for P1-0.
Contributions of the failure mechanisms.

As given in Table 5, all 25 specimens were studied in terms of signal energy. The results properly demonstrated the three failure mechanisms, as shown in Figure 13. In general, it can be said that fiber breakage was lower at 90° and 0° due to lower yarn density and thus lower weave angle. Moreover, since fibers provide lower matrix support, matrix breakage is higher. The higher weakness of fibers at 0° leads to a greater separation of fibers from the matrix. Average failure mechanisms in all directions.
Analyzing fiber failure frequency
Fiber breakage frequencies in all samples at different angles (400–2000 kHz).
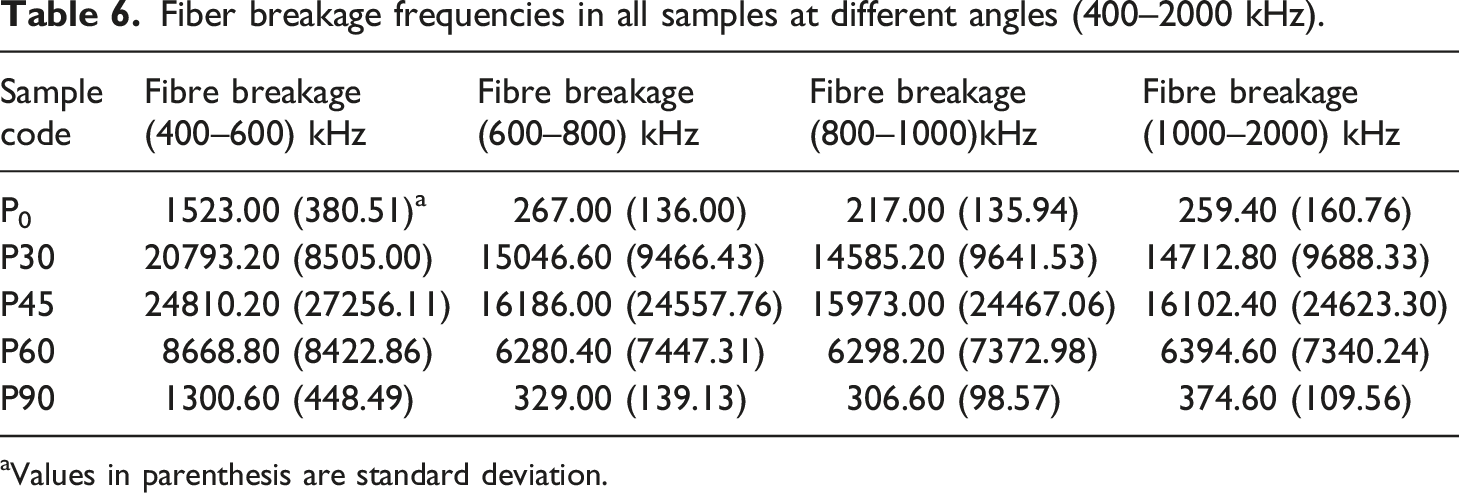
aValues in parenthesis are standard deviation.
Figure 14 shows the average number of broken fibers in different frequency ranges and angles. In general, as the tensile angle increases relative to the principal angles, the number of failures increases to a maximum of 45%. Then, the number of failures decreases again. The important point in this diagram is the significant difference in the number of fiber failures in the range of 400–600 kHz compared to other frequency ranges. This difference increases significantly by increasing the angle up to 45°, and after a 45°, this difference decreases again. In order to justify this behavior, it is assumed that the fibers have two failure modes: first, the shear failure mode, in which the fiber failure frequency range is 400–600 kHz, and second, the tensile failure mode, which can be the fiber failure interval in the tensile mode. In the range of 600–2000 that there is uniformity in the number of failures at all angles Figure 14. Therefore, it can be concluded that there are both failure modes at all angles, but on the off-axis, the number of fiber failures in the shear mode significantly increases compared to the tensile failure mode. It is important to note that the number of fibers exposed to stress increases by changing the applied stress angle relative to the principal directions. Because in the off-axis, both yarns and wefts are under stress. This inference can be confirmed by how the fibers are applied to the fibers at a 45°. Fiber breakage in different angles and frequency ranges.
SEM images
Ten of the 25 specimens were selected and subjected to three rounds of SEM. Figure 15 shows three SEM images representing all failure mechanisms: matrix breakage, interface breakage, and fiber breakage, emphasizing tensile and acoustic emission tests. Figure 15(a) and (b) shows the SEM image of P3-0 and P4-90 with a ×57 and ×60 magnification, respectively. According to the figure, in the main directions of the structure of the samples, after the tensile test, they do not have much confusion and maintain their coherence. Also, the shape of the fibers is cut linearly (perpendicular to the direction of the force), indicating the tolerance of tensile forces by the fibers directly. However, Figure 15(c) and (d) depicts the SEM images of P4-45 and P5-45 with a ×27 and ×50 magnification, respectively. As can be seen in the figure, in the off-axis directions of the structure of the specimens, after the tensile test, they become distorted and lose their cohesion and become tubular. This deformation indicates the rotation and slippage of the warp and weft yarns on each other and the movement in the tension direction. Also, the shape of the fibers is cut diagonally (relative to the tension direction), representing the existence of shear force. Due to the weakness of glass fibers against shear force in off-axis directions, especially at 45°, the main strength is the responsible for the interface. Table 5 shows that the percentage of breakage in the interface is less than at other angles, demonstrating its higher strength. SEM images of (a,b) principal direction for P3-0 P4-90 and (c,d) off-axis direction for P4-45, P5-45.
Conclusion
This research uses the acoustic emission technique to investigate the plain-woven glass/epoxy composite failures synchronized by the tensile testing. Three failure modes, matrix, interface, and fiber breakage, happened in tensile testing. The effect of different load angles (0, 30, 45, 60, and 90°) was examined on composite as below: 1. In the acoustic emission test, chosen frequency and energy as criteria show three failure modes as a mechanical test. The highest frequency and cumulative energy related to the fiber and the lowest related to the matrix between them have interface breakage. At the angle 45°, the frequency and energy of fiber breakage started from the third region, which explains the weakness of glass fibers against shear force. 2. Three modes of failure (matrix, interface, and fiber breakage) approach by wavelet transform use frequency and energy as criteria in acoustic emission, the percentages obtained from this method, it was obtained that the highest failure rates are related to the matrix, fibers, and interface, respectively. 3. Frequencies above 400 kHz were considered as fiber breakage. It was observed that by changing the load angle, the number of fiber breakage increases, and its maximum is at 45° and decreases again. 4. At frequencies above 400 kHz, the number of broken fibers in the range of 400–600 kHz with intervals above 600 kHz is significantly different. 5. In this study, to justify the number of fiber failures in the range of 400–600 kHz, it was assumed that this interval could be attributed to the shear failure of the fibers. 6. The difference in the number of fiber failures in the shear mode compared to the tensile mode increases by increasing angles up to 45° and decreases again. That can indicate the number of fiber failures in the off-axis shear mode. 7. SEM images show three failure modes and emphasize tensile and acoustic emission tests. Moreover, they show sample deformation, bias yarn cutting, curling in the off-axis, and stability of samples after the on-axis tensile test.
Single-layer composites can be used for packaging, and this study is also useful for the analytical study of multi-layered of these reinforcements. It can be the basis for designing complex composites.
Footnotes
Declaration of Conflicting Interests
The author(s) declared no potential conflicts of interest with respect to the research, authorship, and/or publication of this article.
Funding
The author(s) received no financial support for the research, authorship, and/or publication of this article.