
Abstract
Membrane structures made of high-strength polyester fabrics are deployable and lightweight, which can be utilized in architecture, aerospace and marine structures. The design and optimization of an inflated structure depends on a thorough understanding of polyester fabric mechanics. In this work, firstly, the material properties of the polyester fabric membrane were analyzed by a tensile test. The bending and wrinkling behaviours of the inflated polyester fabric membrane were investigated by experimental, analytical and numerical methods. Specimens of varying internal pressures and diameters were subjected to bending tests with highly controlled loading and boundary conditions. It was found that the flexural capacity of the inflated membrane structure was positively correlated with the diameter and the internal pressure but decreased obviously with the occurrence and propagation of wrinkles. Based on the energy principle, the prediction formula of mid-span deflection was developed with the consideration of shear stiffness. Furthermore, the surface-based fluid cavity method was employed to set up a finite element model (FE model). The flexural behaviour of inflated membrane structure can be predicted by both the analytical and the numerical method, and the reliability was verified by comparing with the experiment
Keywords
Introduction
The fabric membranes gained more and more attention in civilian, military, marine, and space-related structures due to their excellent physical characteristics of rapid deployment and lightweight. 1 They are generally fabricated from continuously woven or braided fabrics that can be used as beams when inflated at high internal pressure. 2 Due to the internal pressure and complex compositions, the mechanical properties of fabric membranes are quite different from that of conventional construction materials. 3 Moreover, the inflated fabric membranes are always applied as structural members in industry, making them bear bending loads. Therefore, it is very meaningful to predict bending and wrinkling behaviours of inflated fabrics membrane structures, which can provide theoretical guidance for designing desirable inflated membrane structures.
The common membranes are composed of substrate and coating. The substrate consists of two orthogonal yarn families (called warp and weft).
4
Figure 1 shows the base components of technical plain-woven fabrics. The direction of weaving is called the warp (axial) direction, and the normal direction is called the weft (hoop) or fill direction. The warp yarns are straight, and weft yarns alternately wind around the warp yarns.
3
The coating such as polyvinylchloride (PVC) or polyvinylidene fluoride (PVDF) used to protect the substrate has superior performance of self-cleaning, durability and impermeability.
5
Basal components of plain-woven fabrics.
Up to now, some researchers have studied on the analyzed method of inflated beams’ deflections. For instance, Comer and Levy 6 studied the deflection of inflated cylindrical cantilever beams between incipient buckling and final collapse by using Euler Bernoulli’s kinematics. Subsequently, Main et al. 7 modified Comer’s model by considering a fabric thickness factor to make the model more applicable for fabrics structures. However, the present models are sufficient as long as the loads are kept below that of the wrinkle, due to the shear and internal pressure being neglected. In order to improve the previous methods, some other researchers preferred to use the Timoshenko beam theory. Fichter 8 derived nonlinear equilibrium equations to calculate the deflection of the twisting, bending, and stretching of pressurized thin-wall cylindrical beams. Since the theory was difficult to be solved, Fichter just proposed the linearized equations of two simple examples. Le Van and Wielgosz 9 have used the principle of virtual work in the context of the total Lagrangian formulation to analyze the bending and buckling of inflated beams, and they improved the linearized Fichter’s equations. Wielgosz and Thomas10,11 found that the sections of the inflated beams do not remain orthogonal to the neutral axis under bending load, which was a significant feature of the Timoshenko beam. Thus, they treated the internal pressure as a follower force to develop an analytical method of deflection by using the Timoshenko beam theory. However, the calculation accuracy of this model needs to be improved and the theory was difficult to apply. Thus, Cavallaro et al. 3 found that the effective elastic and shear moduli were functions of inflation pressure by experiments, and a simply deflection formula was deduced by the energy method.
Distinct from the global deflection analysis, there are three theoretical models are applied to describe the local wrinkling of the inflated beam: the membrane model, the shell model and the shell-membrane model. 12 Stein and Hedgepeth 13 predicted the wrinkling load by the membrane model, in which the wrinkles occurred when the axis stress dropped to zero. Moreover, Veldman14,15 treated the material as a thin shell and considered the effect of the material property to investigate the wrinkle loads. In addition, Wang 16 improved Veldman’s model and presented the wrinkle factor to predict the loading magnitude and location of the critical wrinkle. Ji et al. 17 developed Wang’s model to a double scale model for the wrinkle analysis, which offered a considerable interest in computation efficiency. On the other hand, some works dedicated to the modelling and simulation of inflated structures. Apedo et al.18,19 proposed a 3D nonlinear FE model by using the Timoshenko beam theory and the virtual work principle to predict the deflection of homogeneous orthotropic woven fabrics beams. It led to almost the same results as the thin-shell model when the wrinkles did not yet appear. Nguyen et al. 20 improved the 3D Timoshenko beam model by considering the constitutive law that was related to the inflated pre-stressed state. Elsabbagh 21 further modified Apedo’s model for axisymmetric inflatable structures. The model was validated by comparing its predictions with Apedo’s cases, and the difference was small in the linear case. However, the bearing capacity of the model did not decrease obviously at the post-wrinkling stage, which is contradictory with the beam theory and experiment.
According to previous researches, the material properties of the membrane were taken as the inherent characteristics of the structure, which kept constant under the load. However, the mechanical characteristics of the membrane exhibited high nonlinearity when encountering the internal pressure and the applied load. In this work, a nonlinear analyzed method of the inflated beams’ bending behaviour was developed, in which the elastic modulus was regarded as the material property of the membrane, while the shear modulus depends on the internal pressure and the applied load. In addition, many researchers simplified the internal pressure as a uniform pressure in the simulation of inflated beams. The variations of internal pressure caused by the decrease of volume during the loading process are always neglected. Therefore, the fluid cavity numerical method was used to describe the behaviour of the internal gas of the inflated beam in this work.
This paper is structured as follows: In Experiments, the membrane’s tensile test was completed to obtain the warp and weft stress-strain relationship and provided material property for further research. In order to quantify the load-displacement response and analyze the wrinkling phenomenon, four-points bending experiments of inflated beams were conducted under simply supported boundary conditions with varying diameters and internal pressures. In Mechanics Analysis of Inflated Beams, the wrinkle load was analyzed by using the membrane theory. Moreover, the shell model was introduced to modify the theoretical method. Then, the effect of shear stiffness on the deformation prediction of inflated beams was investigated. The semi-empirical formula of inflated beams’ mid-span deformations under bending load was deduced based on the energy method. In Numerical Simulations of Inflated Beams, the fluid cavity method was used to establish the FE model, and the accuracy of the FE model is verified to be reliable by comparing experiment one. The variation of internal pressure in the loading process was further analyzed. The conclusions were drawn in the end.
Experiments
Materials
Polyester Fabric Membranes
The fabric membranes used in this work was the coated fabrics manufactured from polyester threads and double-sided coated with PVC. The microscopic structure of the PVC-coated membrane by the scanning electron tests is shown in Figure 2. The density and thickness of the membrane were 1000 g/m
2
and 0.84 mm, respectively. The weave angle of the fabrics was 90o. Microscopic image of the polyvinylchloride coated fabrics.
Description of the bending tested models
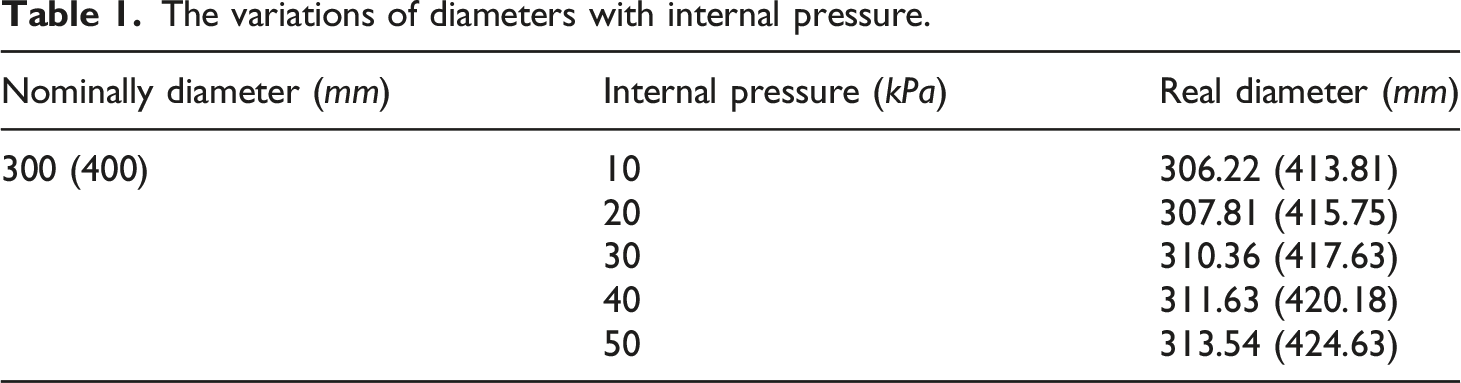
The tested inflated beams were made of coated fabric membranes with low elastic modulus, good extensibility and high tensile strength. A photograph of one specimen is presented in Figure 3. The member ends were sealed by a stainless steel valve. A precise barometer was set on the valve to detect internal pressure. An air compressor was used to charge the specimen and provide a continuous and stable charging speed. The beam was nominally 4 m in length and had a nominal cross-sectional diameter of 300 mm or 400 mm. It should be noted that the real diameter would change with internal pressures varying from 10 kPa to 50 kPa no matter for the nominal diameter of 300 mm or 400 mm. The details are listed in Table 1. Taking the nominal diameter of 300 mm as an example, the real diameter of the beam was 306.22 mm for the internal pressure of 10 kPa, and 307.81 mm for the internal pressure of 20 kPa. Correspondingly, for the nominal diameter of 400 mm, the real diameter of the beam was 413.81 mm for the internal pressure of 10 kPa, and 415.75 mm for the internal pressure of 20 kPa. Photograph of the inflated beam specimen. The variations of diameters with internal pressure.
Tensile test
Nowadays, the uniaxial tensile methods are widely used and recommended in the design specifications.
5
Thus, in this work, the uniaxial tensile test was conducted to determine the tensile modulus of polyester fabric membranes under low tensile stress and discover the anisotropic behaviour at the tensile failure stage. The electromechanical universal testing machine was used for the uniaxial test. Every strap specimen was cut from a roll of the same batch virgin material and had overall dimensions 25.4 mm × 125 mm. The working sizes: 25.4 mm in width, grips separation of 75 mm. The test setup was designed according to the standard ASTM D4851. The loading rate was 50 mm/min, the test temperature was 23 ±2°C, and the relative humidity was about 65%. The specimens were cut in the warp, weft and 45o directions, as shown in Figure 4. In each direction, five specimens were chosen for the tensile test to obtain average results. The test procedure is presented in Figure 5. Figure 5(a) displays the initial condition of the uniaxial test. And Figure 5(b) displays the fractured phenomenon which is the classical warp specimen mode. Schematic diagram of specimens. Patterns of the tensile test procedure.

Typical stress-strain curves for PVC-coated straps are presented in Figure 6. The curves are high of repeatability, demonstrating that the original material is homogeneous. The magnitudes of the failure stress in the warp and weft directions were similar. However, the sharps of the warp and weft directions curves were different due to the crimped yarn configuration in the fibrous architecture. The stress-strain curves presented high nonlinearity, which was difficult to apply in research. Thus, some literatures22,23 identified three linear stages of tensional stiffness for plain-woven fabrics subjected to uniaxial tension. In stage Ⅰ, the maximum stress should be below 20% of the ultimate tensile stress. Therefore, in this work, due to the maximum internal pressure can not exceed 100 kPa and the strain should be less than 5%, so the stage Ⅰ of the stress-strain curve was suitable for further analysis. In stage Ⅰ, the slopes of the curves can be considered as the elastic modulus. The Poisson’s ratio is the ratio of longitudinal strain and the transverse strain, which was obtained by the digital image correlation technology.
4
The main material parameters are summarized in Table 2. Stress-strain curves for coated fabrics strap specimens. Technical properties of polyester fabric membranes.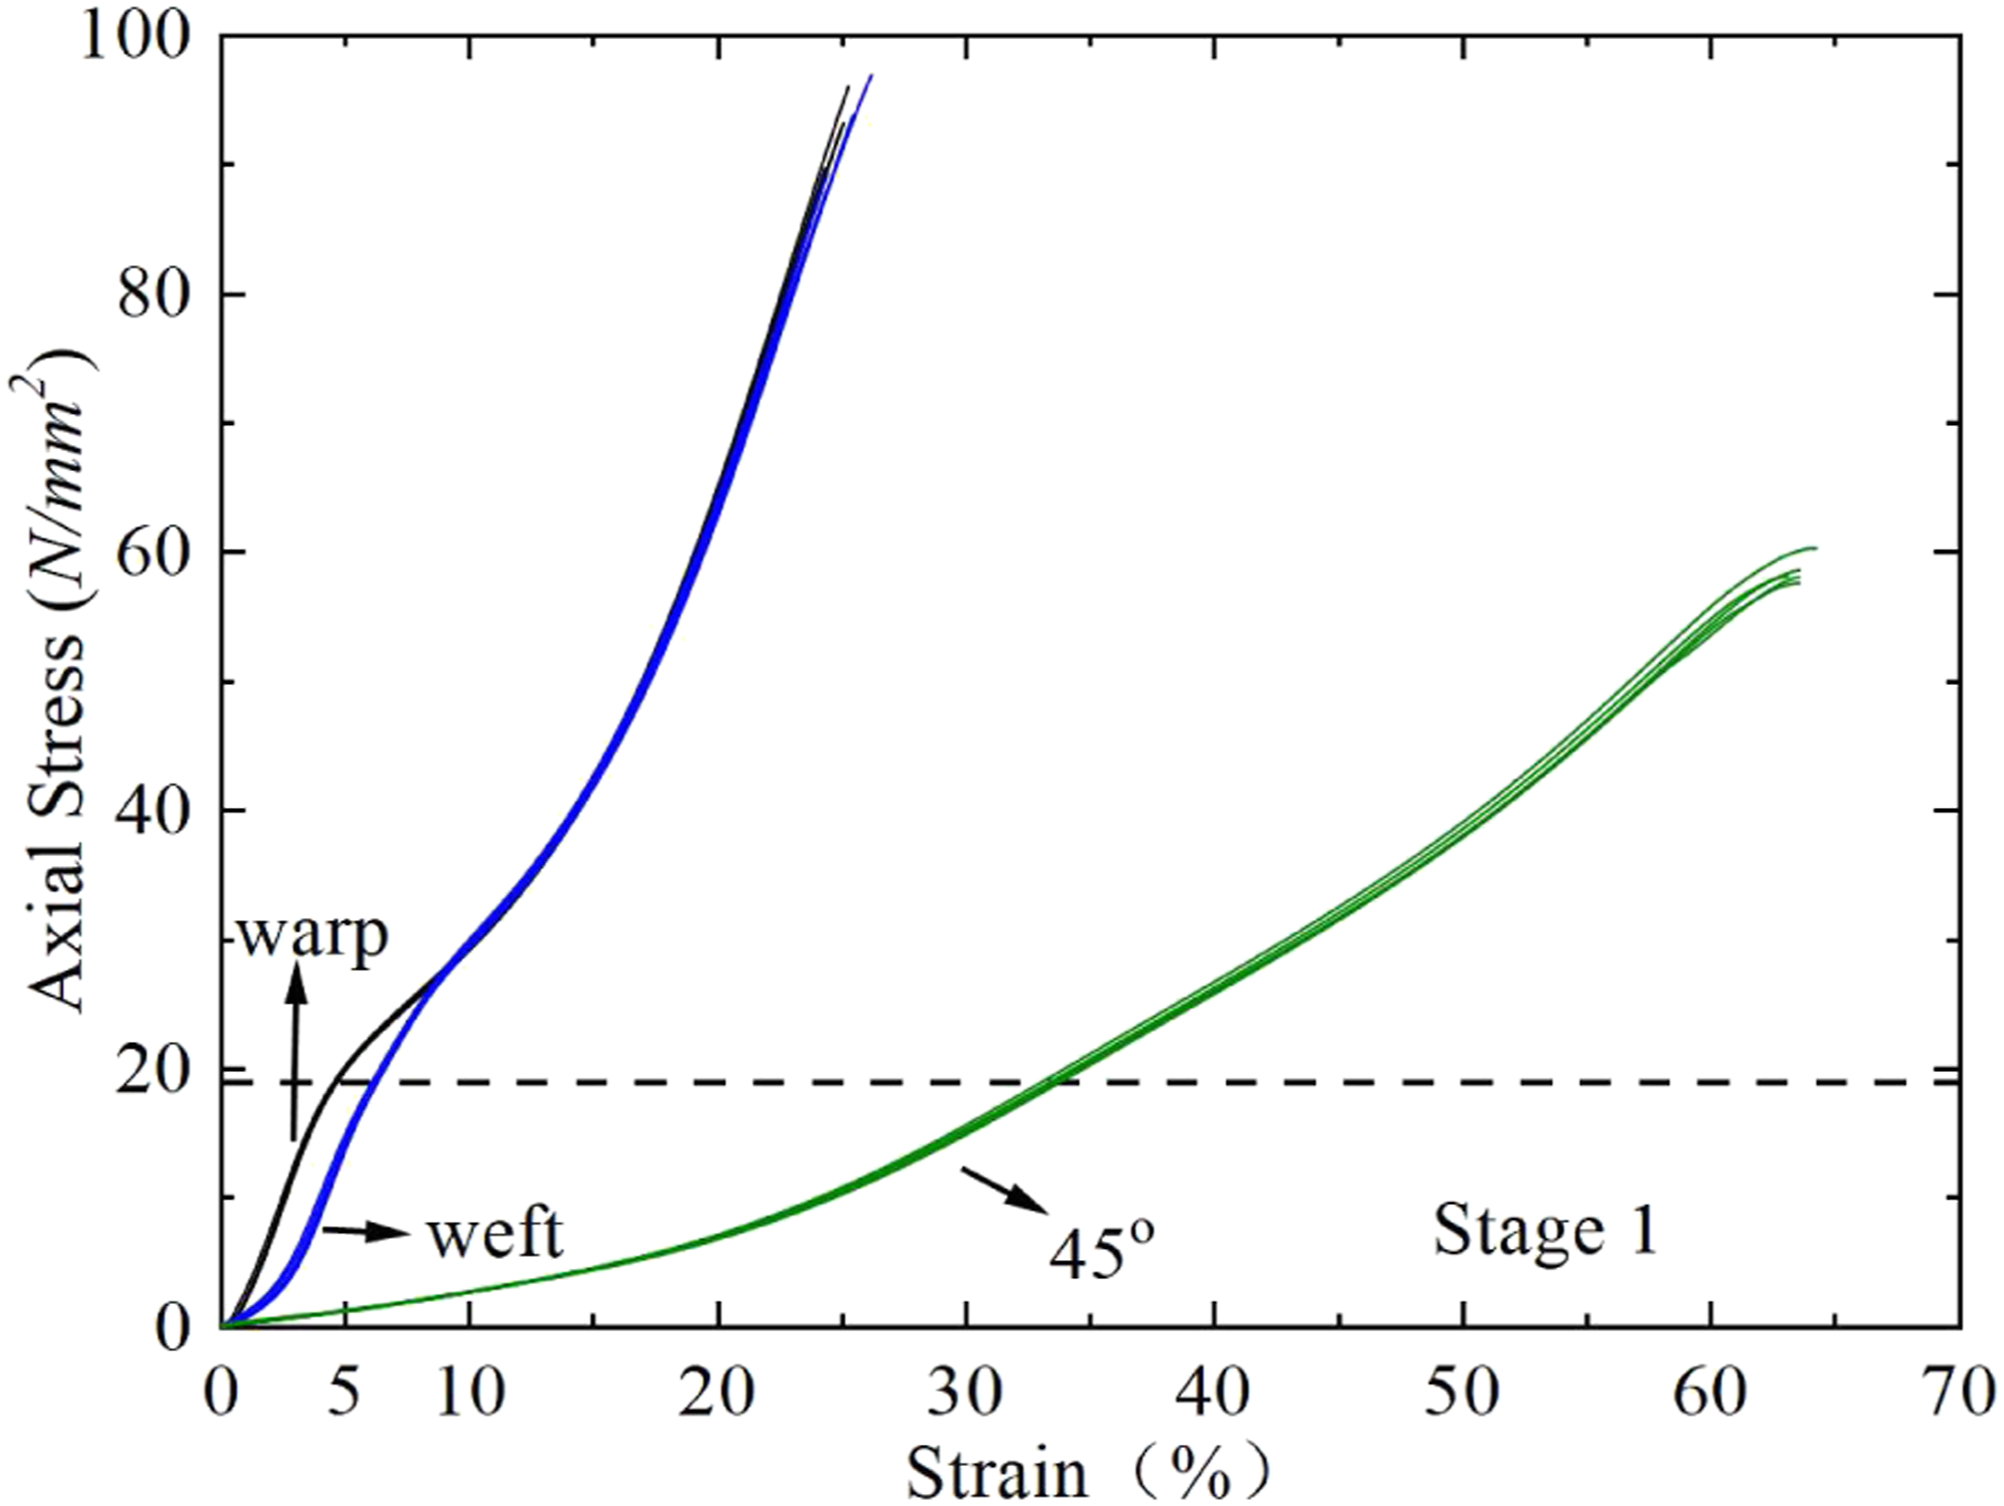

Figure 7 shows the fracture configuration of specimens under tensile loading. There were two types of failure mechanisms of specimens under uniaxial loading, pure-tensile failure and pure-shear failure. The pure-tensile failure took place in those specimens when the loading angle θ equals 0° or 90° (warp or weft direction). The crack path was vertical to the loading direction, and fabrics paralleling to the loading direction were broken entirely. Particularly, the specimen (θ = 45°) showed a representative pure-shear failure configuration. It is observed that fabrics were drawn out from the coating material under pure-shear stress. Meanwhile, the failure occurred at the interface between yarn and coating. The fracture configuration of specimens.
Four-points bending experimental setup
Four-points bending experiments of inflated beams were conducted under simply supported boundary conditions with different diameters and internal pressures. It was necessary to apply appropriate boundary constraints to the specimens in experiments. The support, consisting of two wheels connected to the wooden saddle, was constructed to match the nominal diameter of the tested models and support the ends. Straps attached to the wood saddles were placed relatively loose over the top of the model on each end to prevent the saddles from tipping. This simple support system allowed the beam ends to freely rotate and horizontally translate, as shown in Figure 8. The span from center to center of rollers was 3 m. Photos of the roller support.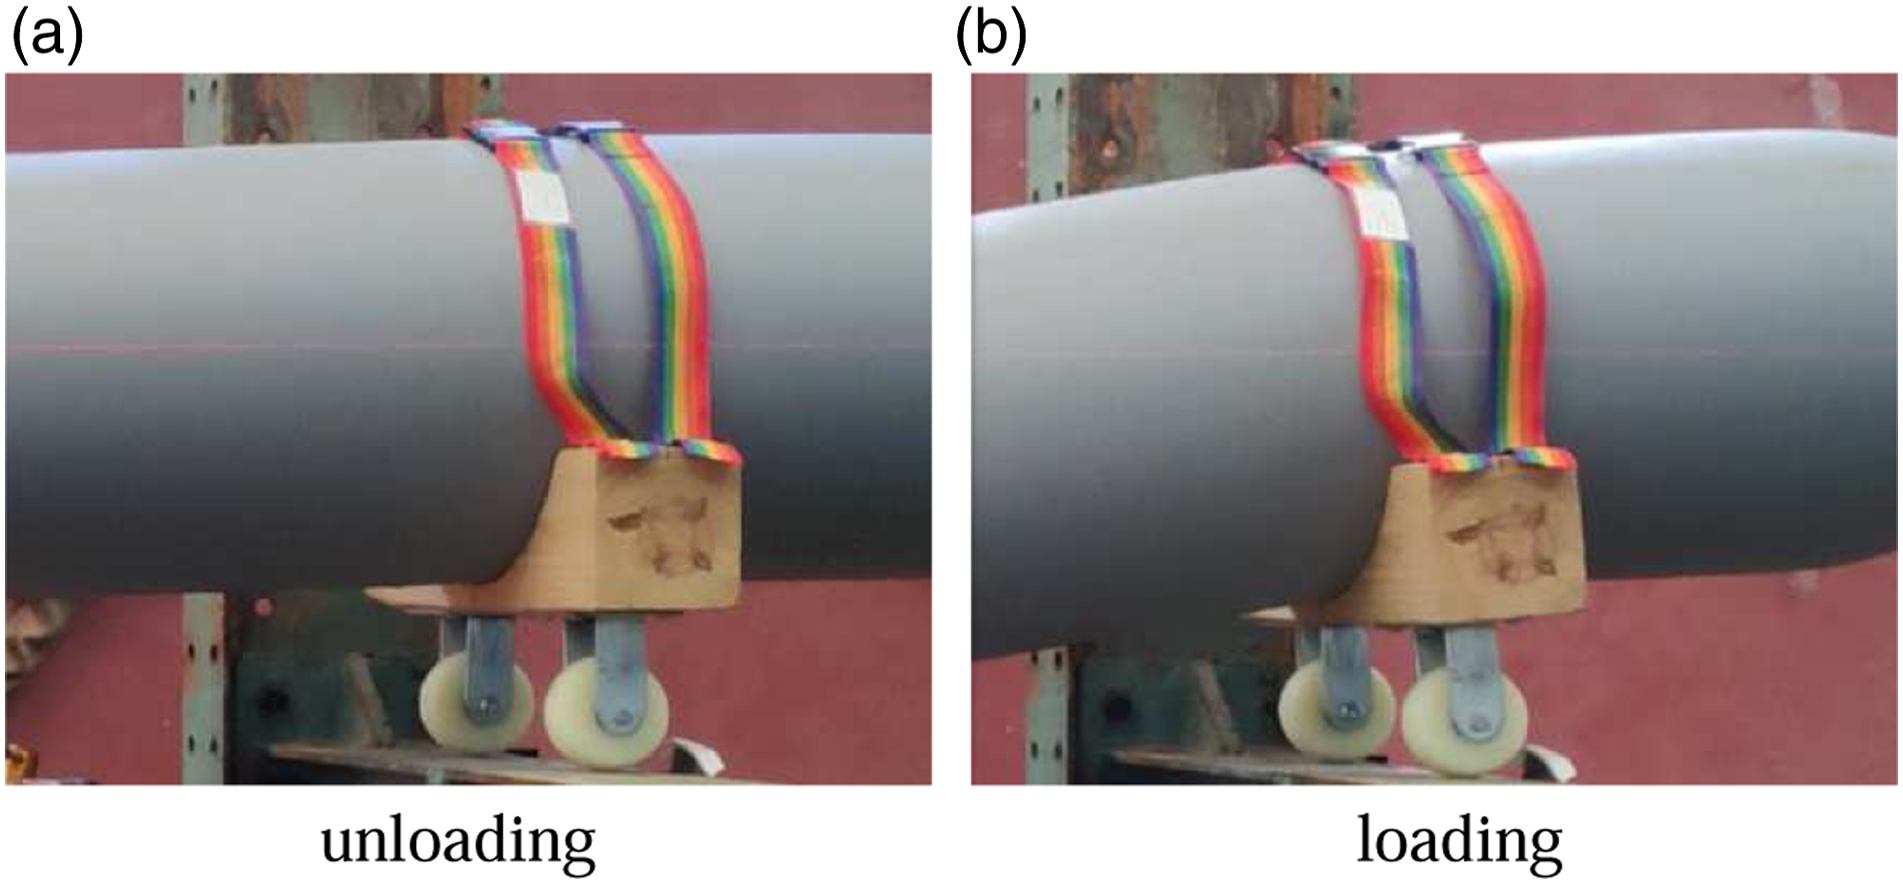
Loads were applied via weights with forces being distributed through a steel spreader beam, as shown in Figure 9. The weight of the weights had been checked accurately. A pair of 50 mm wide load inelastic straps was used to transfer forces to the test model. The straps were separated by a distance of 1.5 m. The axis of the spreader beam was in coincidence with that of the specimen in the longitudinal direction. Four-points bend test setup.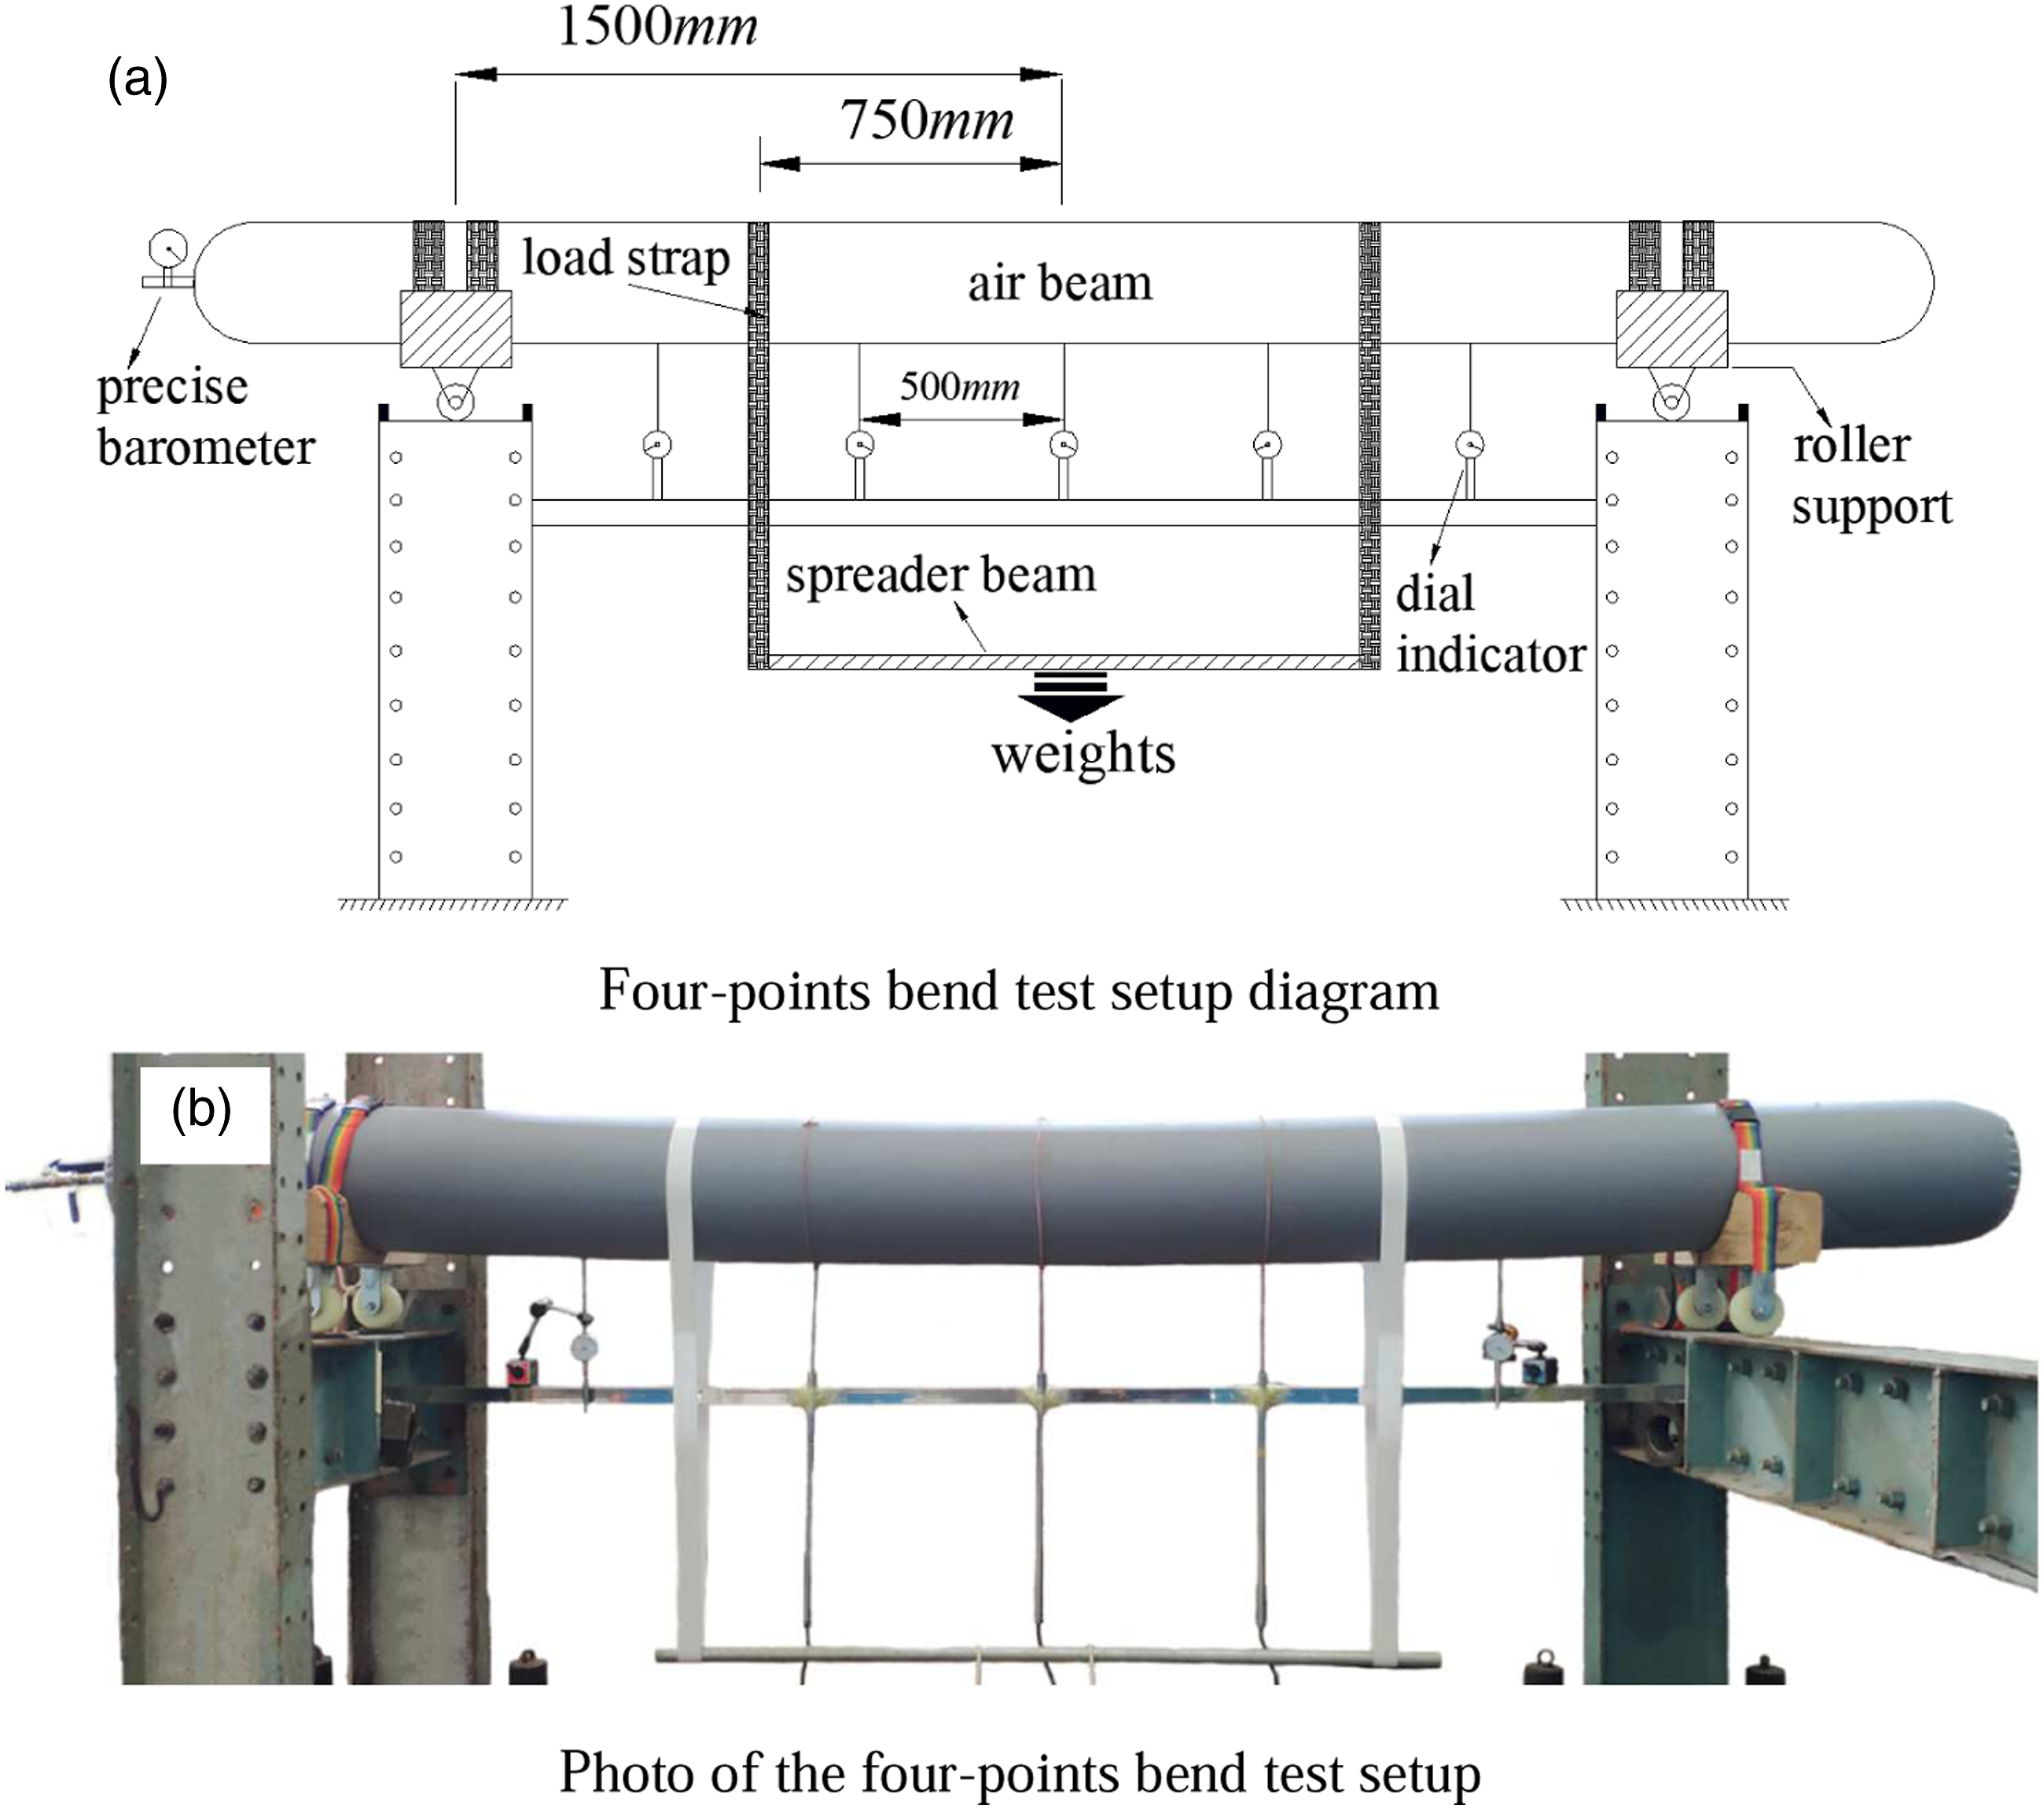
Inflation pressure was regulated and recorded using a pressure regulator and precise barometer. Five dial indicators were used to record vertical deflections during loading. The dial indicators were placed along the beam with one at mid-span, and each one was spaced 500 mm equidistantly. The diagram and the photograph of the four-points bend test setup are both shown in Figure 9.
Four-points bending experimental results
The shapes of the deformed beams are shown in Figure 10. It can be seen that the deflection curve consisted of two stages. At the initial stage, the inflated beam seemed like the usual beam, but with the increase of loading, it gradually transformed into a trilinear model. The deformed pattern of the inflated beam.
The load-displacement data of the mid-span are plotted in Figure 11 for each beam at all five inflated pressures. It is apparent that the mid-span deflection decreased with the increase of pressure under a specific load. Thus, the inflated pressure should be taken into account in the analytical solution of the deflection. In addition, Several previous literatures11,18 have proved that the material property of the fabrics also plays an indispensable part in inflated beams behaviour. Therefore, the behaviour of inflated beams mainly depended on the material characteristics of the fabrics, the internal pressure and the external loading. Load-displacement response of mid-span of inflated beams.
The inflated beam showed an initial linear response followed by softening behaviour that was resulted from the wrinkle.
24
As shown in Figure 12, the wrinkle occurred randomly on the top (compressive stress) face of the beam in the bending area. The wrinkle emerged initially as continuous waviness in a local area and evolved gradually into a single groove until the formation of a “wrinkle hinge” with increasing the load. Development of the wrinkles with loading.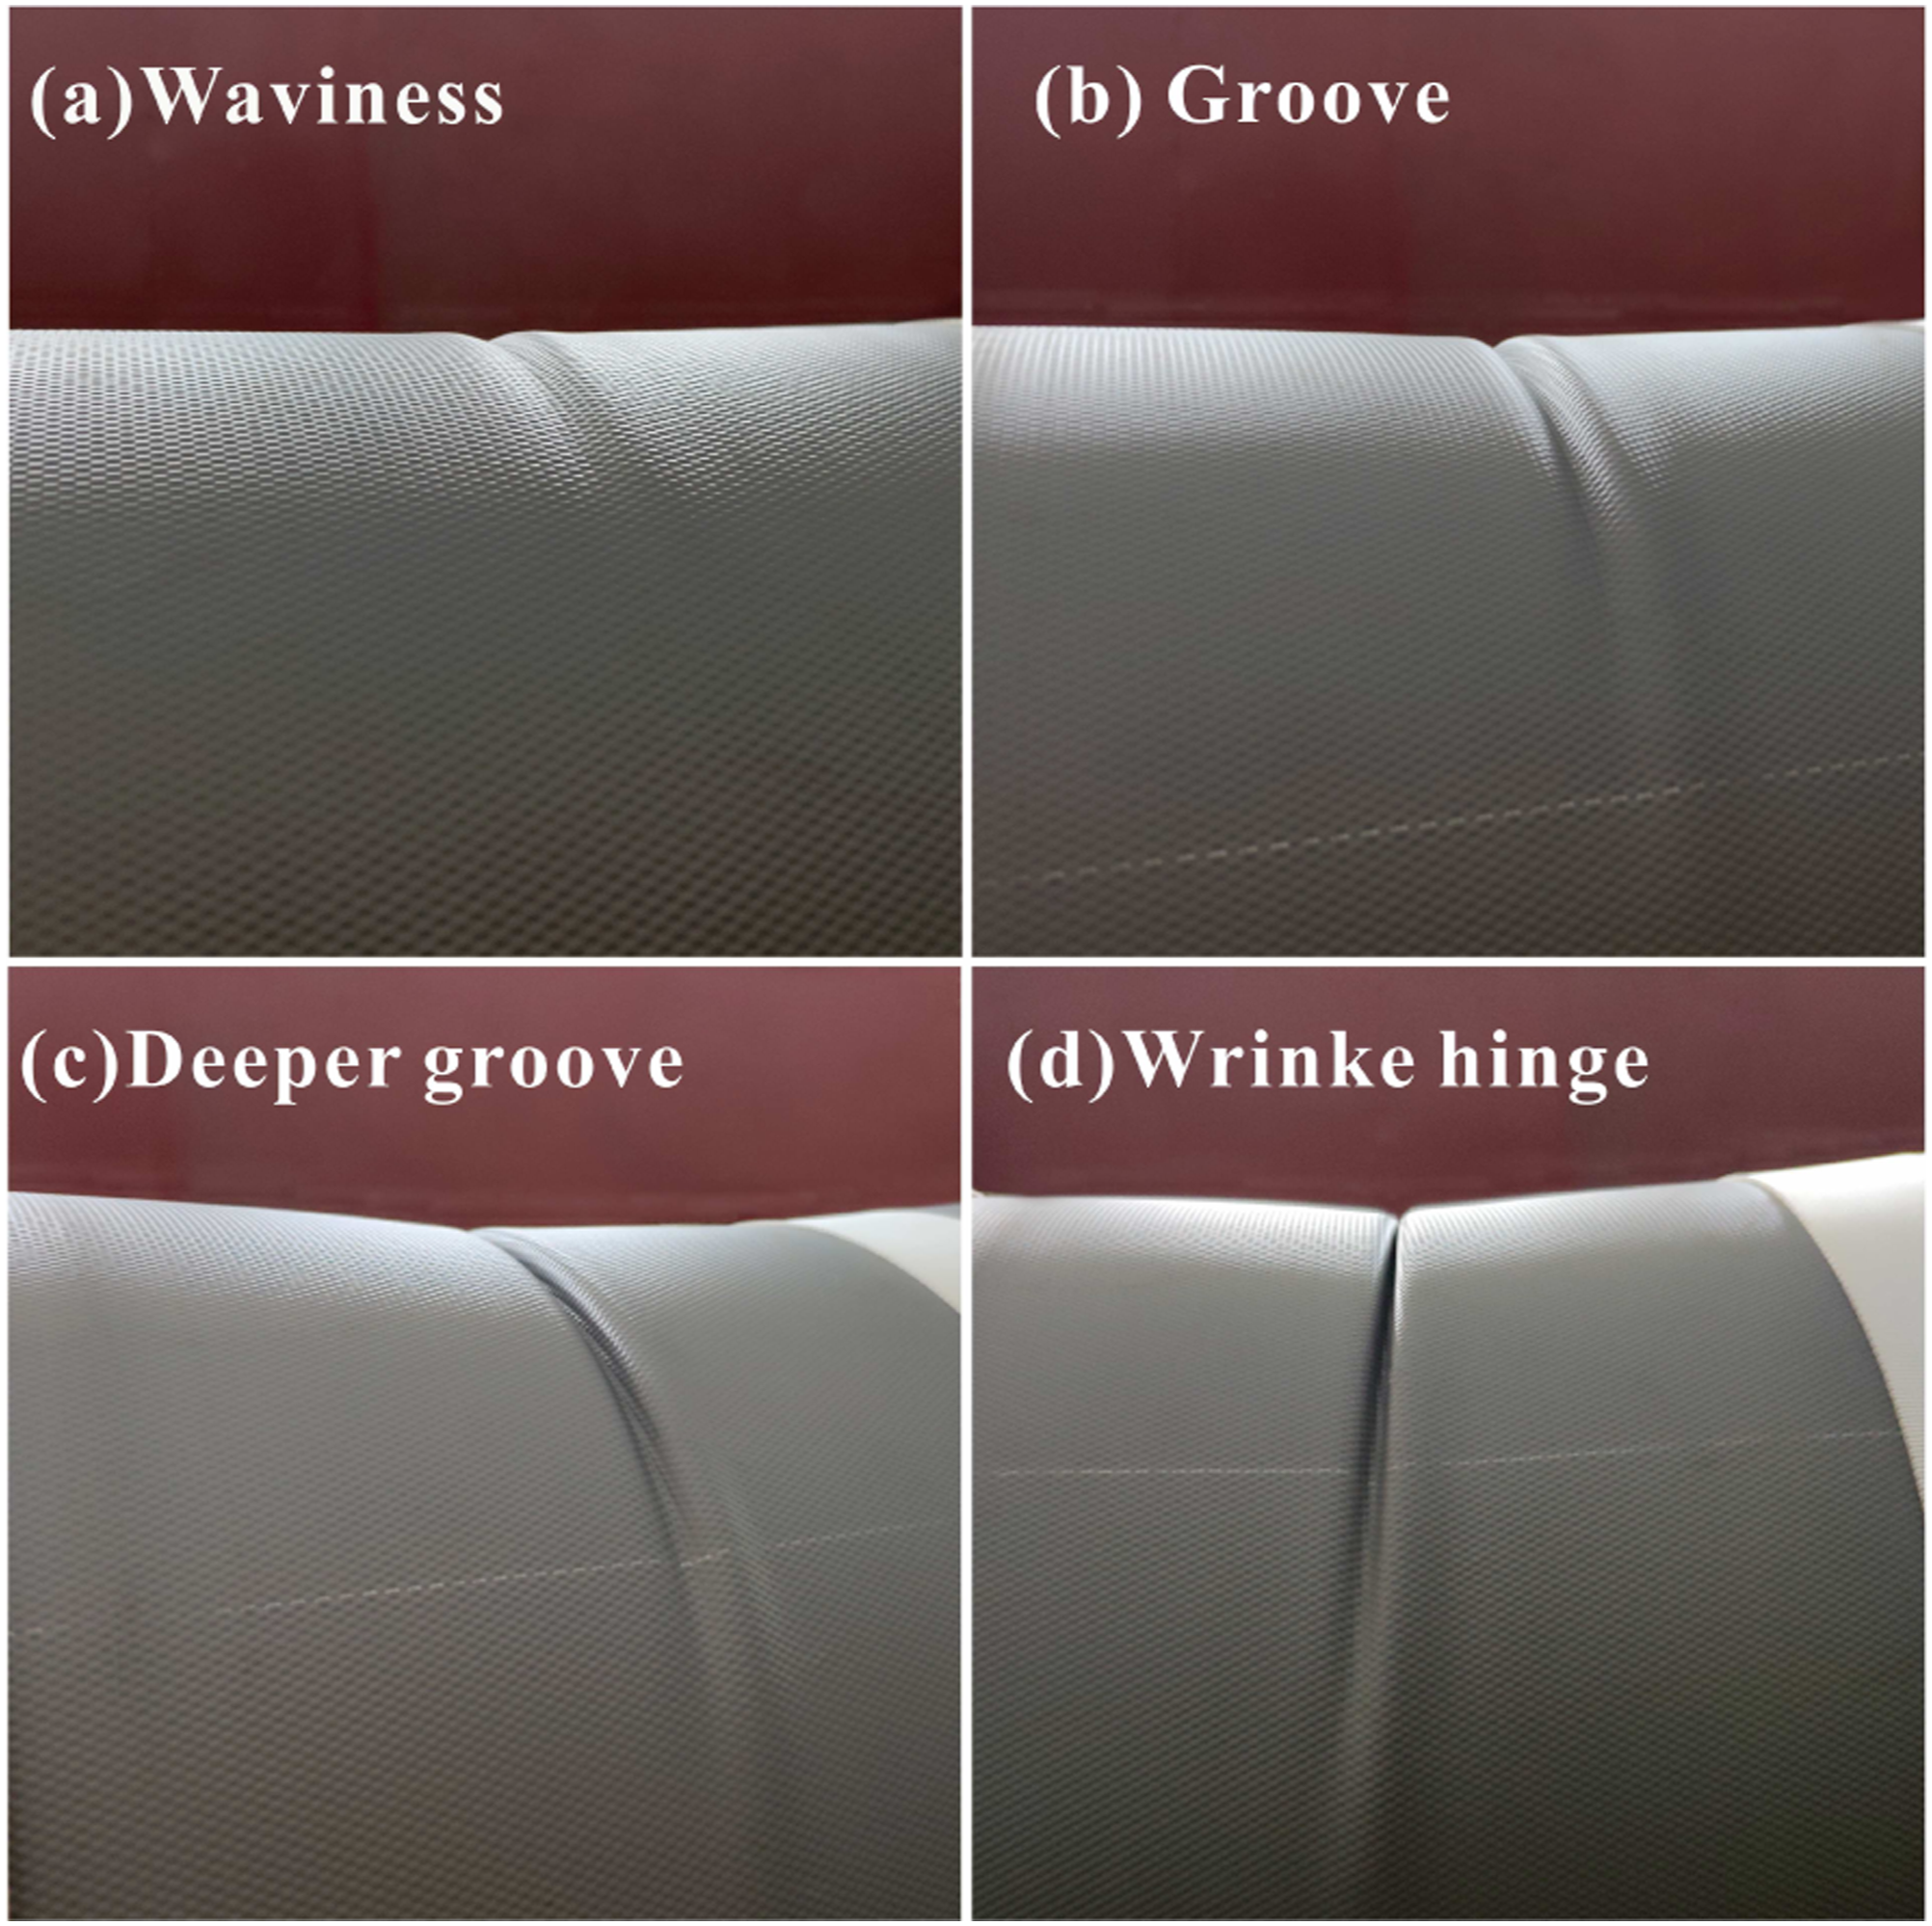
Mechanics analysis of inflated beams
Wrinkling analysis
In this work, the inflated membrane could be simplified as a beam, and the upper surface is subjected to axial compressive stress under the bending load. Moreover, due to the inflated pressure, the membrane is subjected to axial tensile stress. According to the membrane model, when the axial compressive stress increases to the same magnitude as the tensile stress during the loading process, the axial stress of the membrane becomes zero. At the same time, the wrinkle is occurring theoretically. Subsequently, the wrinkle continuously propagates, and incipient buckling begins with the further increase of bending load.
The theoretical membrane model of the wrinkle analysis is shown in Figure 13. A coordinate system is established by taking the axial direction of the inflated beam as the positive x-axis and the radial direction of the section as the positive y-axis. r is the inflated beam radius, t is the thickness, p is the internal pressure, and F is the bending load, Schematic representation of the inflated cantilever beam.
The axial force balance equation and the bending moment balance equation are achieved as shown in equations (1) and (2).

The normal stress in the x-direction Stress distributions at the x-direction with the wrinkle angle 

Substituting equation (3) into equation (2) gives equation (4)
Substituting equation (3) into equation (1) gives equation (5)
Equation (4) and equation (5) can be combined to give equation (6)
When 
When 
The failure bending moment is twice the wrinkle bending moment by comparing equations (7) and (8). Thus, even if the inflated beam is wrinkled under the external force, it can continue to bear a certain load.
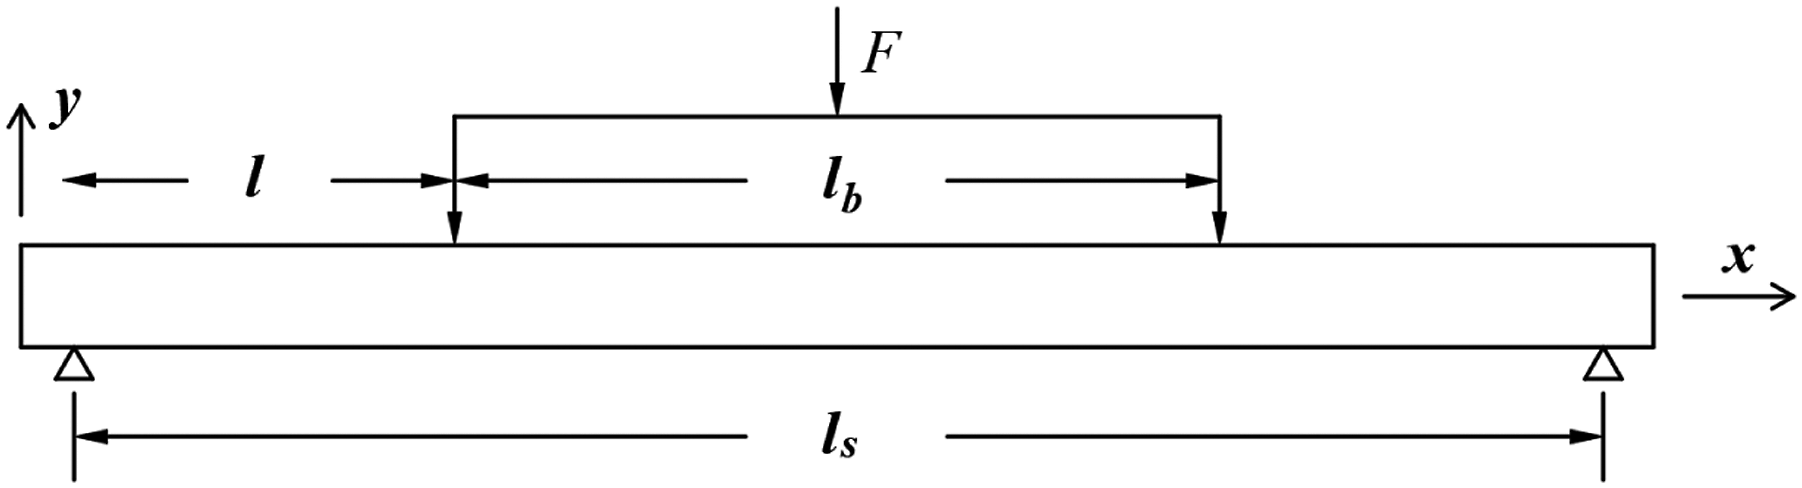
According to equation (7), the wrinkle load Mechanical diagram of the four-points bending experiment.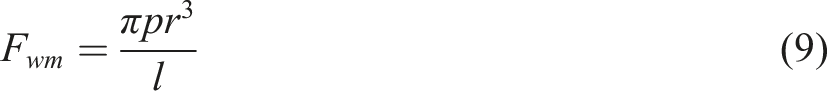
The theoretical wrinkle load of the four-points bending experiment is calculated by equation (9), and the results are shown in Figure 16. Load-displacement response of 400 mm diameter beams.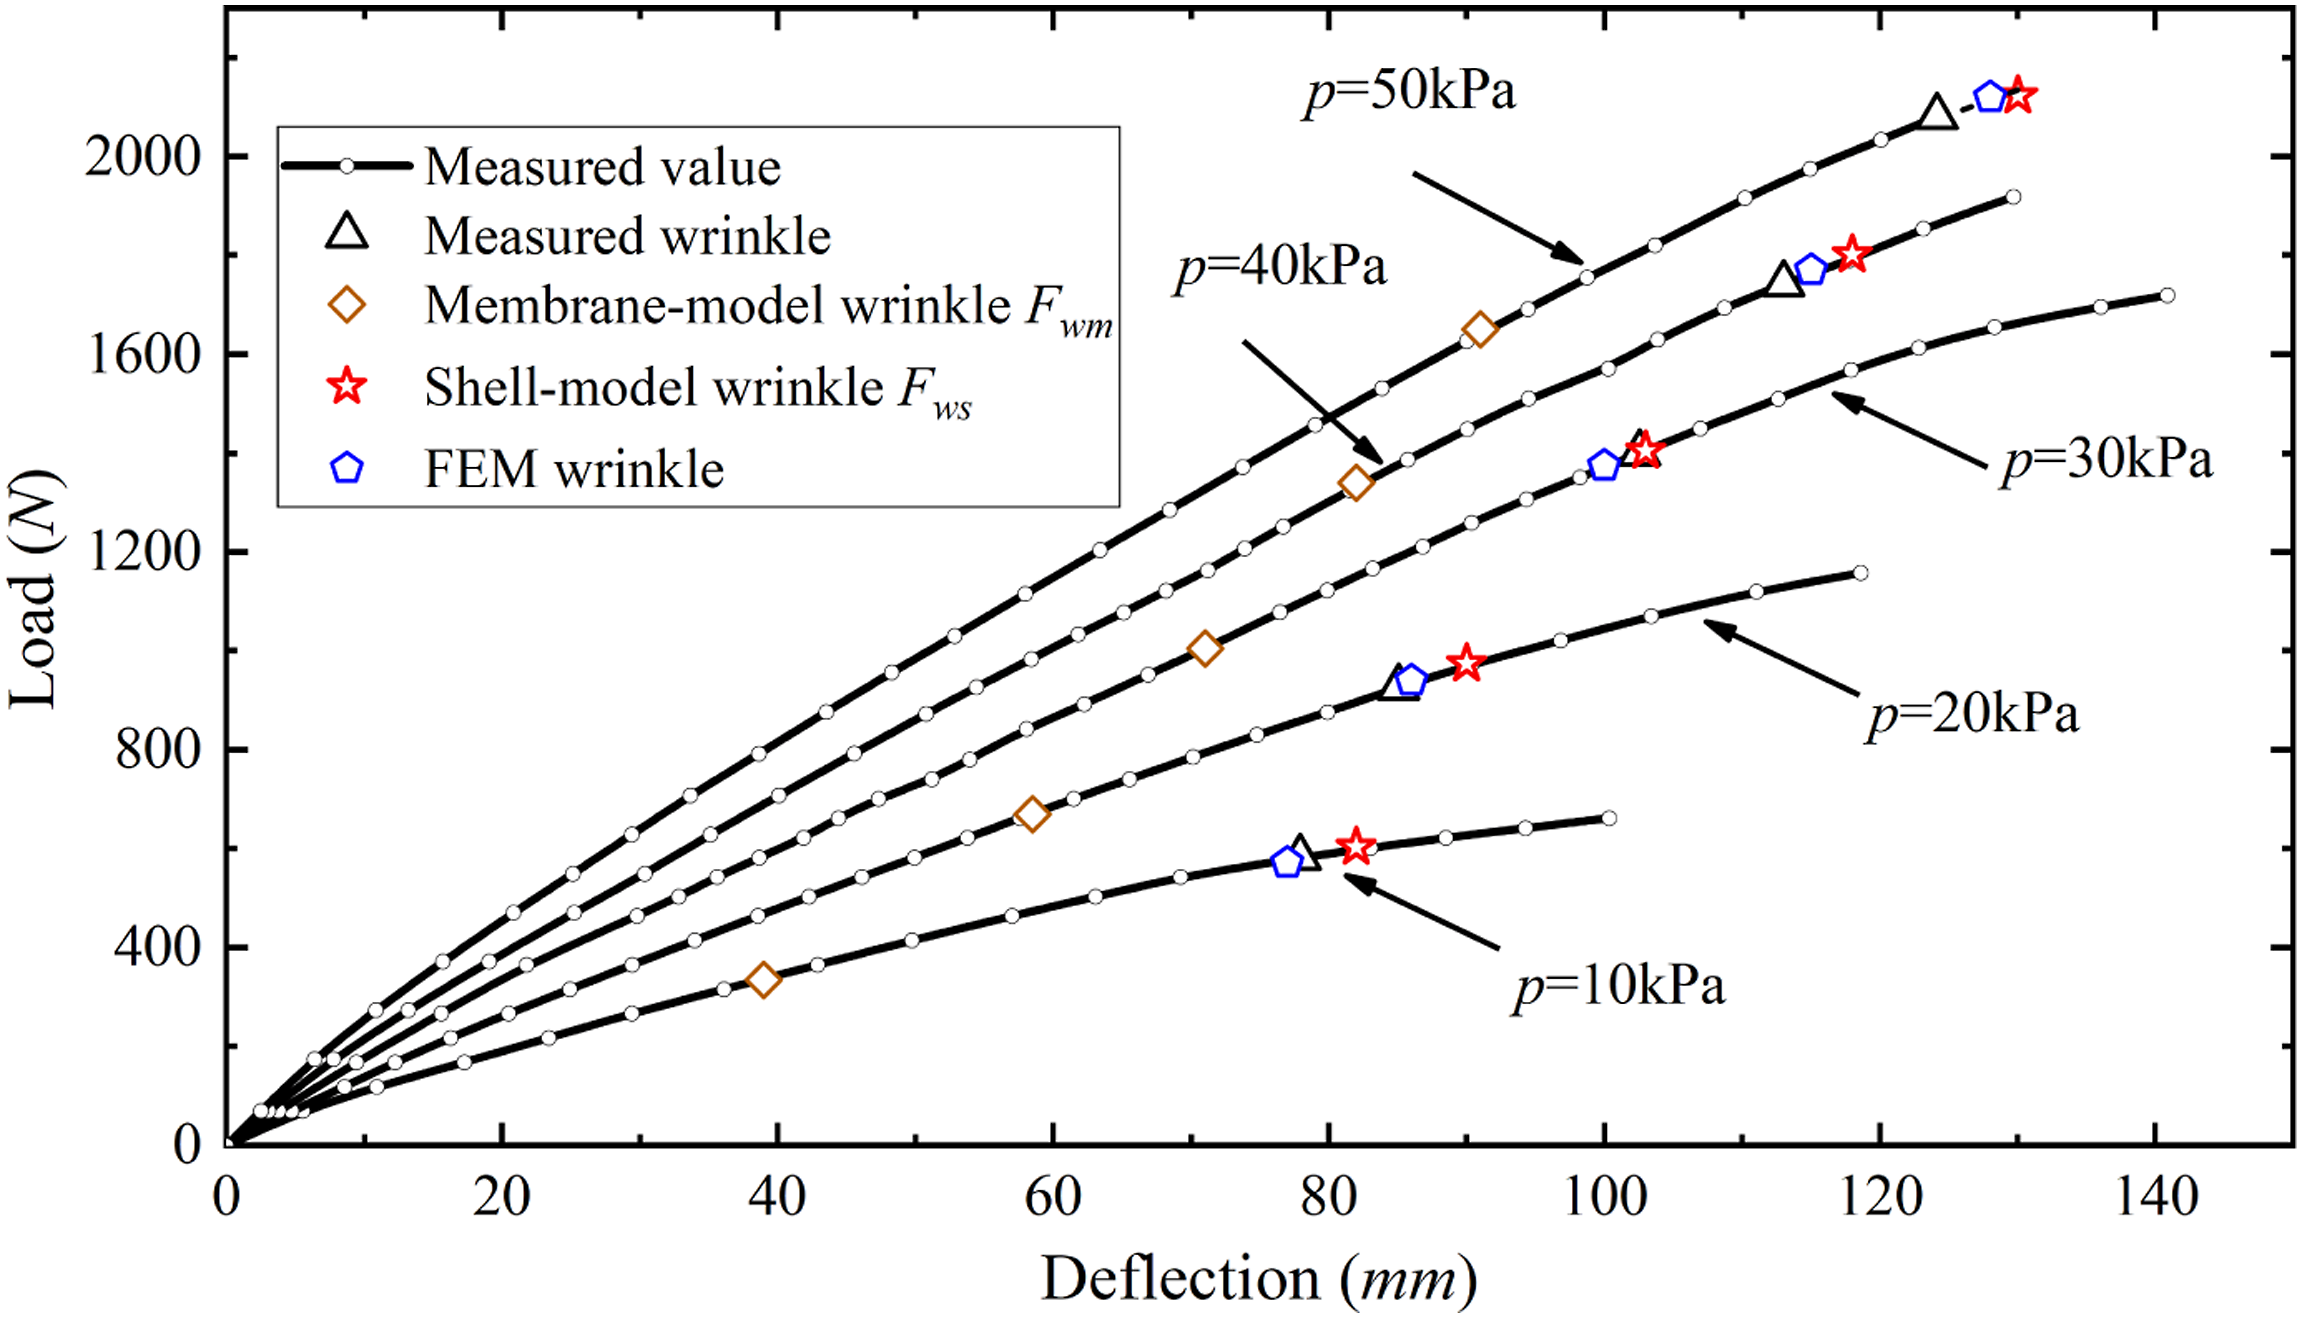
The membrane model wrinkle load calculated by equation (9) is located within the linear range of the load-displacement curve, which is much smaller than the failure load. The experimental results show that the wrinkle initiates when the experimental wrinkle load reaches approximately 1.3–1.4 times the theoretical value. The reason is that the membrane material is regarded to be ideal in the membrane model that assumes the wrinkle initiates when the normal stress 
Veldman et al.
15
have extended Wood’s expression to the case of the orthotropic material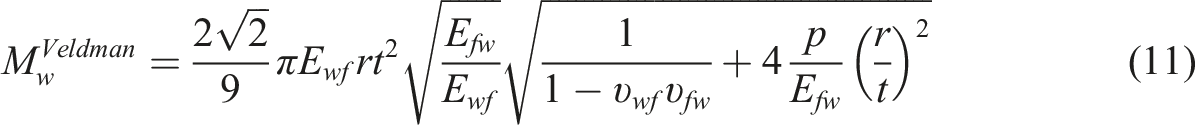
Combine equation (7) with equation (11), the shell model wrinkle bending moment can be obtained:
According to equation (12), the wrinkle load 
The results by comparing the measured wrinkle loads and the results of the theoretical method, including the membrane model and the shell model, are shown in Figure 16. In comparison with the membrane model, the wrinkle loads from the shell model are closer to the measured ones. The deviation between the shell model and the measured value is less than 7%, indicating the shell model is more accurate than the membrane model in wrinkle load prediction of inflated fabric membrane in this work.
Theoretical study on deflection prediction
The analytical model of the four-points bend inflated beam is shown in Figure 15. The distance between the loading point and the adjacent boundary is l = 750 mm, the distance between the two loading points is l
b
= 1500 mm, and the total length is ls = 3000 mm. (1) Euler beam theory
Based on the Euler beam theory, the deflection 
E is the elastic modulus, I is the section moment of inertia.
Furthermore, the mid-span 
The experimental and the theoretical mid-span deflections of the beam with 400 mm diameter under the internal pressure 30 kPa are shown in Figure 17. It is found that the experimental deflection is larger than the theoretical value. The experimental and theoretical mid-span deflection.
Obviously, the specimen with a higher internal pressure has smaller deformation when subjected to a bending load. Therefore, it can be inferred that internal pressure is an essential factor in the bending deformation of the inflated beam. However, there is no internal pressure-related term in the formula derived by Euler beam theory. Thus, a possible conclusion is that the internal pressure will affect the deformation caused by the shear stress.
To verify this conjecture, the ratios of shear deflection (2) Energy method solution The ratios of

Shear forces and bending moments along the cross-section of the beam are FS(x) and M(x), respectively. The stress at a distance y from the neutral axis on the section is expressed in Figure 19. Stress distributions at the cross-section.
The
The bending strain energy density 
The bending and the shearing strain energy of the element with a volume of 
The total bending and the shear strain energy 
The section moment of inertia I and shear strain correction factor (for tube 2.0) k are used to simplify the equation (18).
Substituting equation (19) into equation (18) gives equation (20).
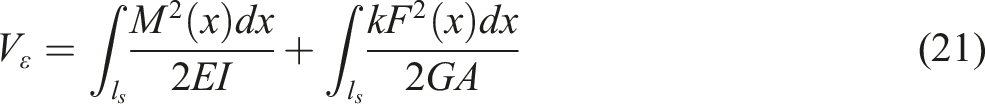
The deflection 
The material in this study is linearly elastic, shown by the tensile test. Substituting equation (21) into equation (22) gives the mid-span deflection 
In equation (23), the
Substitute mid-span load-displacement data for the beam with the diameter of 400 mm under different internal pressure into equation (23), the equivalent shear modulus can be obtained. Equivalent shear modulus-internal pressure curves and equivalent shear modulus-load curves are plotted in Figure 20(a) and (b), respectively. (a) Equivalent shear modulus-internal pressure curves under different internal loads and (b) equivalent shear modulus-load curves for the beam with the nominal diameter of 400 mm under different internal pressure.
It can be found that the equivalent shear modulus has a linearly positive correlation with the internal pressure and a linearly negative correlation with the load. The internal pressure and the load are two independent variables. Then a two-parameter linear function is used in the fitted data as in equation (24).
In equation (24), the G
E
is the equivalent shear modulus, the p is the internal pressure, the F is the load, the a, b, c are constants. Fitting experimental data by equation (24) gives equation (25)
Substituting equation (25) into equation (23) gives equation (26)
The prediction formula is valid when
To verify the reliability of the deduced formula, the deflections for the beam with the nominal diameter of 300 mm and 400 mm under the internal pressure 30 kPa were calculated by equation (26). The experimental and theoretical results and error curves are plotted in Figure 21 and Figure 22. The mid-span theoretical and experimental deflection comparison for the beam with the nominal diameter of 300 mm under the internal pressure 30 kPa. The mid-span theoretical and experimental deflection comparison for the beam with the nominal diameter of 400 mm under the internal pressure 30 kPa.
From the qualitative point of view, the theoretical curve showed an initial linear response followed by softening and was basically consistent with the experimental data. The errors fluctuated within 5% at the initial stage. However, the calculation deviation increased with the increase of loads when the load reached the wrinkle load. Thus, the theoretical formula is reliable before the load exceeds the wrinkle load.
The main reason for the deviation is that the theoretical formula is based on the energy method, in which the linear elastic theory is used to calculate strain energy. It is inappropriate to continue to use the linear elastic method when the load exceeds the theoretical wrinkle load, especially when the wrinkle appears on the surface of the inflated membrane.
In practical engineering, the load is generally not higher than the wrinkle load. Moreover, the error of the theoretical formula deduced in this paper is less than 10%, and the formula is relatively simple. So it can meet well the requirements in engineering applications.
Numerical simulations of inflated beams
Finite element model
One of the critical points of modelling is how to simulate the influence of internal pressure on the structure. It is an effective method to simplify the internal pressure to uniform normal pressure on the surface of the membrane. However, it is difficult to describe the coupling effect between the deformation of the structure and the internal pressure. The reason is that structure behaviours depend not only on the external loads but also on the internal pressure. On the other hand, the internal pressure could vary with the deformation of the structure. 28
The surface-based fluid cavity, representing fluid-filled cavities under hydrostatic conditions, can effectively solve the fluid-structure interaction. It is based on the ideal gas theory, and the state equation for an ideal gas is given as
P is the absolute pressure, V is the air volume, n is the amount of internal air substance, R is the ideal gas constant, and T is the thermodynamic temperature of the ideal gas.
An explicit solver that is efficient in computing time and convergence can calculate the gas-structure coupling effect. In Abaqus/Explicit, the fluid is compressible, and the pressure is calculated from the cavity volume. Figure 23 depicts the 4-node hydrostatic fluid volume element F3D4.
29
The hydrostatic fluid elements appear as surface elements covering the cavity boundary. However, they are actual volume elements when the cavity reference node is counted in. The 4-node hydrostatic fluid volume element, F3D4.
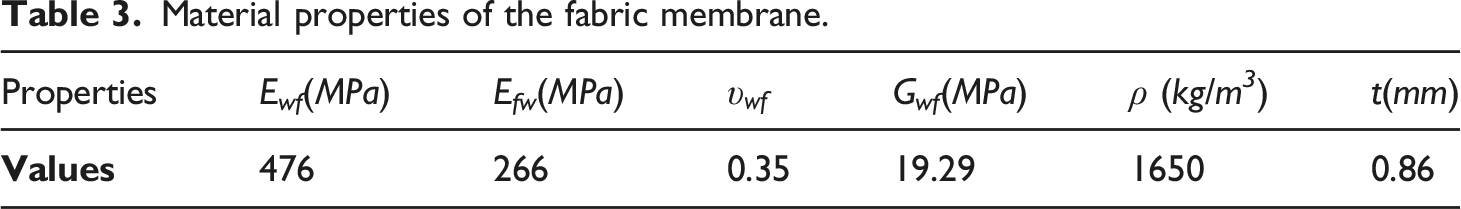
4-noded shell elements (S4R) are used for the membrane and the load straps, and the saddles are modelled with 8-noded solid elements (C3D8R). The connections between the inflated beam and the load straps or saddles are modelled by coupling the nodes. The FE model of the inflated beam is shown in Figure 24. To simulate the simple boundary conditions, the saddles are constrained at the z-direction and y-direction, and one of the saddles is also constrained at the x-direction. Finite element model of the inflated beam.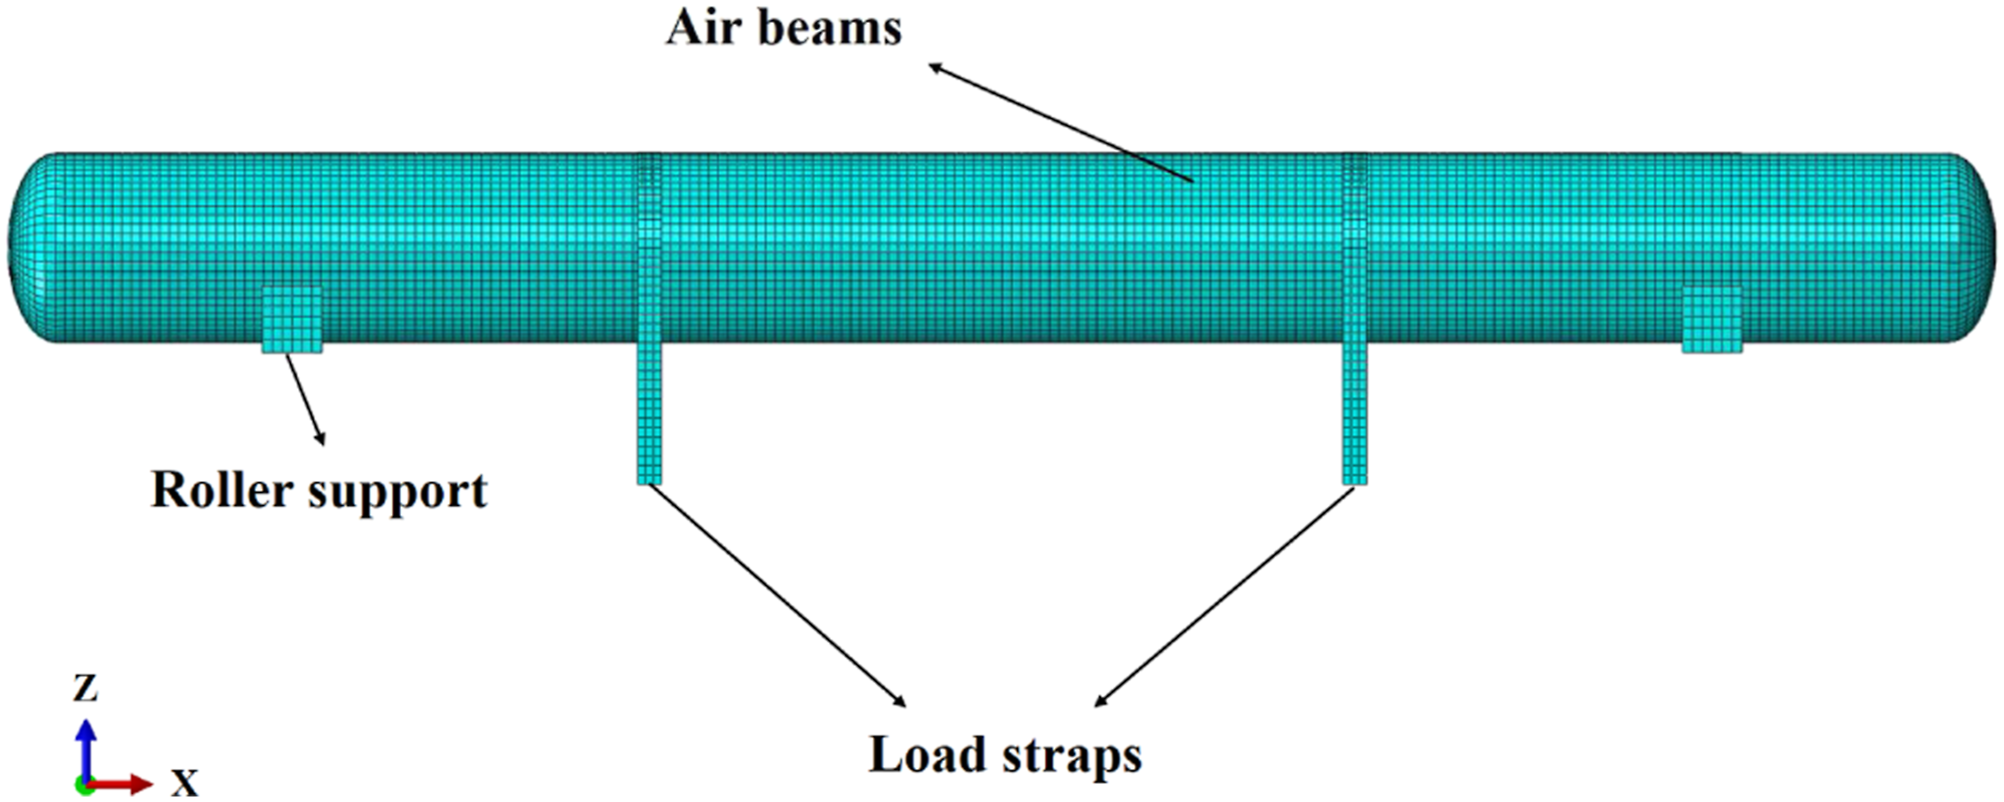
Material properties of the fabric membrane.
The mesh density plays a vital role in the final results, especially when wrinkles occur. However, the smaller mesh size means higher computational cost. Therefore, it is important to optimize the mesh size to obtain an accurate result and low the computational cost as possible. The influence of mesh size on calculation accuracy is shown in Figure 25. It is found that the linear stages of the load-displacement curves with different mesh sizes are almost the same. Nevertheless, the nonlinear stages of the load-displacement curves exhibit discrepancies for different mesh sizes. When the mesh size decreases to 20 mm, the nonlinear stage of the load-displacement curve is almost the same as that for the mesh size of 15 mm. Since the reduction of the mesh size increases the calculation time remarkably, the mesh size of the model is determined to be 20 mm by considering the accuracy and efficiency of the calculation. The influence of mesh size on calculation efficiency.
Comparison of the numerical and experimental results
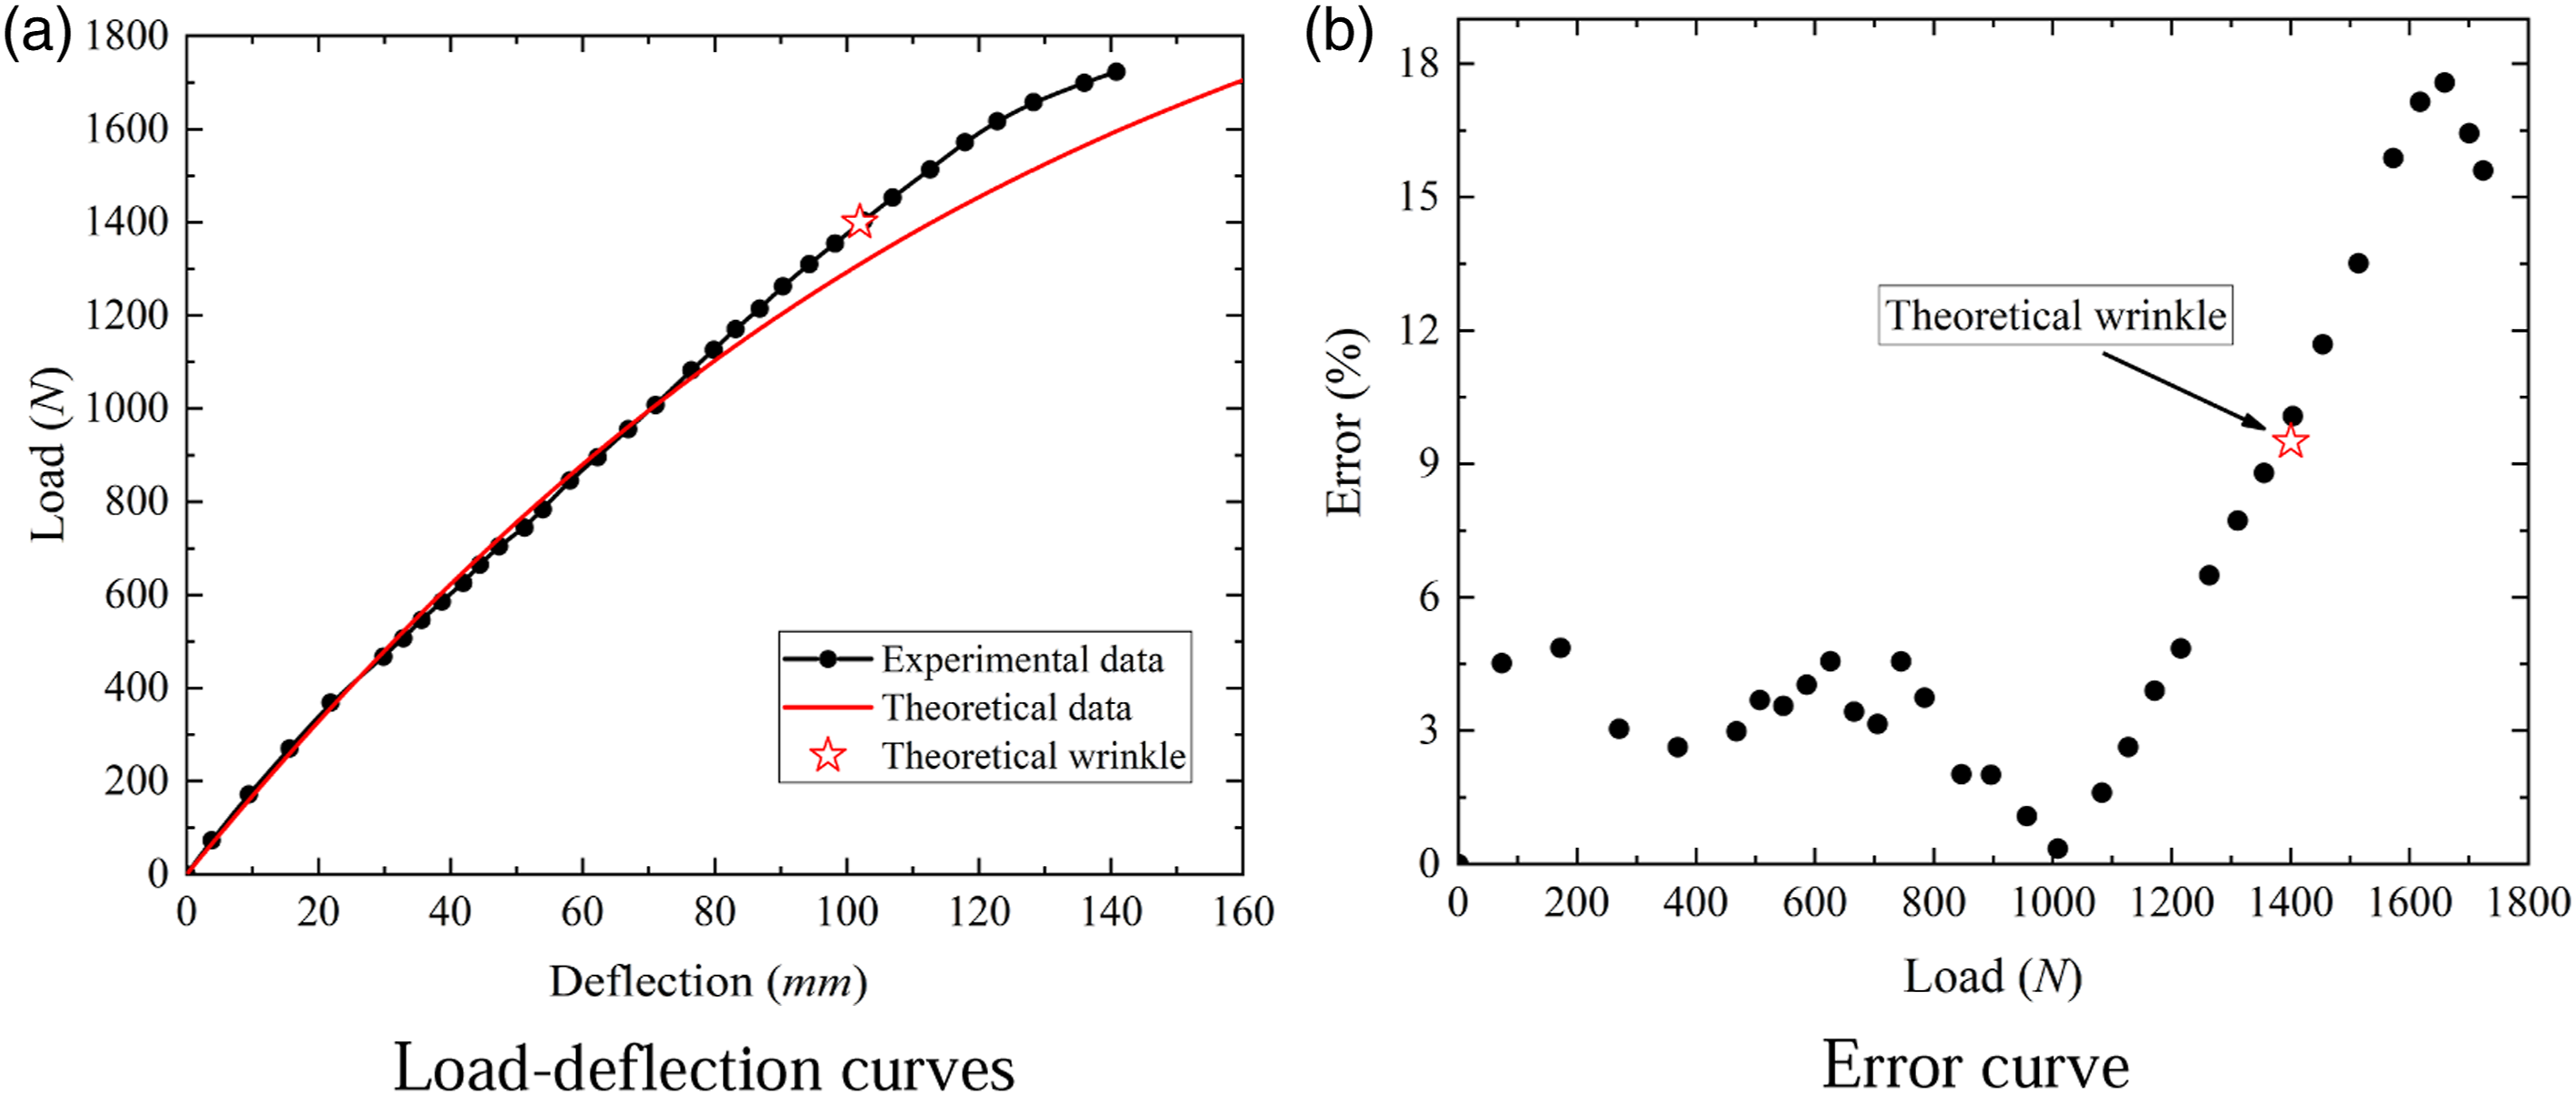
The load-deflection curves of inflated beams in the tests and numerical simulations are shown in Figure 26. The stiffness of the inflated beam can be obtained by fitting the slope of the load-deflection curve. As shown in Table 4, within the wrinkle load, the stiffness of the inflated beam in the test and numerical analysis is similar. However, it should be mentioned that the deviation increases rapidly and could not be ignored under high internal pressure, especially 50 kPa. As shown in Figure 27 Load-displacement response of mid-span of inflated beams. Comparisons of the stiffness between tests and numerical simulations.


The results of the FE model and experiment about the bending response process of the inflated beam with the diameter of 400 mm under the internal pressure of 30 kPa are shown in Figure 28. The numerical result contours denote the longitudinal stress Experiment and simulation results of the bending process of the inflated beam with the diameter of 400 mm under the internal pressure of 30 kPa.
There is no wrinkle when the load reaches the membrane model wrinkle load. However, the wrinkling phenomenon becomes evidently when the magnitude of load reaches 1365 N that is close to the shell model and experimental value. The same result can be obtained from Figure 16. On the other hand, since being used to simulate the structural behaviour of the inflated beam, the 4-noded shell elements will also cause the ultimate bearing capacity to be an overprediction compared to the experimental results. In brief, the FE model developed in this research is able to pick up trends of experimental load-displacement curves, and the accuracy is acceptable below the wrinkle load.
The initial wrinkles are uniformly distributed on the upper face between two loading straps, as shown in Figure 28(c). However, the wrinkles appear randomly in the tests. The main reason should be that the membrane material and specimen are not ideal. On the other side, the boundary system is slightly asymmetric under wrinkling load.
The fluid cavity is used to simulate the behaviour of internal gas. The volume-load curve and the internal pressure-load curve are plotted in Figure 29. With the increase of loads, the volume decreases and the internal pressure increases. It can also be observed that the internal pressure decreases slightly in the experiments. William et al.
2
also verified this phenomenon. They found that neglecting the work done by pressure leads to gross underprediction of inflated beam stiffness and capacity. Thus, internal pressure is a factor to be considered when predicting the bending deformation response of the inflated beam. However, the pressure variation in the beam is indeed tiny (close to 1% of the original value). Therefore, it is reasonable for engineering analysis to assume that the volume-induced internal pressure changes could be ignored.
12
The relationship of internal pressure, volume and load.
Conclusions
This paper was devoted to investigating the structural behaviour of inflated beams subjected to bending loads. The material level tests were performed to determine the membranes' constitutive properties. The four-points bending tests showed that the flexural capacity of the inflated beam was positively correlated with the diameter and the internal pressure. Moreover, the inflated beam showed an initial linear response followed by softening caused by wrinkling. The wrinkle load was predicted using the shell model that was a modified model based on the membrane theory. The deviation between the shell model and the measured value is less than 7%, indicating the reliability of the shell model. In addition, based on the energy principle, the prediction formula of mid-span deflection was deduced, in which the parameters of bending and shearing terms were considered. The deviation between the theoretical prediction and the experimental value fluctuated within 5% at the pre-wrinkling stage.
A 3D finite element model was developed by using the shell model and the surface-based fluid cavity method, which could be used to describe the coupling behaviour between the deformation and the internal pressure. The deformed model and collapsed pattern of the numerical simulation are similar to the experimental ones. The FE model was able to pick up the trends of experimental load-displacement curves, and the corresponding accuracy is acceptable below the wrinkle load.
Footnotes
Declaration of conflicting interests
The author(s) declared no potential conflicts of interest with respect to the research, authorship, and/or publication of this article.
Funding
The author(s) disclosed receipt of the following financial support for the research, authorship, and/or publication of this article: The authors acknowledge projects supported by the Fundamental Research Funds for the Central Universities (WUT: 2019Ⅲ133CG) and the Sanya Science and Education Innovation Park of Wuhan University of Technology (No. 2020kf0064).