
Abstract
Hybrid carbon fabrics consisted of three regions of full carbon, half carbon (vertical/horizontal), and non-carbon region were provided, which could realize spatially distributed heating and did not been previously reported. As a heating element, the carbon fabric exhibited high efficiency electro-thermal response, the equilibrium temperature of the full carbon region can reach 42°C within only 3 s at a low applied current of 0.2 A. In addition, the carbon fabric gives a significant resistance-temperature sensitivities of −0.303%/°C∼ −0.596%/°C. Moreover, the equivalent circuit model was established to decouple the interface electricity, including the specimen-electrode interfacial resistance (2R i ) of 7.4 Ω, and the contact resistance between orthogonal carbon fiber (R ii ) of 6.4 Ω. This paper provides a simple method to prepare spatially distributed heating fabric and the decoupling method can provide a more suitable selection for the development and analysis of interfacial electricity for carbon fiber and fabric.
Keywords
Introduction
Fabric heating elements are emerging and attractive for their flexibility, which is important for hot compress therapy, flexible sensors and wearable heaters.1,2 Resistance heating (Joule heating) is the process by which an electric current pass through a conductor to produce heat, which requires an electrically conductive material.3–5 However, traditional fabric heating elements mostly coated by various conductive particles, nanofiber or nanotubes on non-conductive fibers or fabric in order to render the needed conductivity.6–9 The method involving coatings is versatile in terms of the choice of fibers for the fabric, but it suffers from the limited durability and complex technological process of the coating. The detachment of the coating during the washing of the fabric is of concern impedes the development of fabric heating elements. Therefore, fiber being continuous is of a great choice.
To satisfy the commercial requirements, the fabric heating elements are supposed to be high electrical conductivity, excellent mechanically flexible, lightweight, and wearable.10–14 Consequently, considerable efforts have been devoted to preparing fabric heating elements used various types of conductive fibers to form the fabric in previous work, involving metal fiber,15–17 carbon fiber,18–20 and inherently conductive polymer fiber.21–23 However, the limitation of the choice of fiber, some of which are not very suitable for weaving due to their limited ductility. Carbon fiber turns out to be a promising material for fabric heating elements due to excellent mechanical property and outstanding electrical conductivity, thermal conductivity, and electro-thermal performance.24–26
Recently, Yang used carbon fiber filament wrapped with an insulating layer and made into fabric heating elements which were particularly suitable for the special protective clothing for cold protection in severe cold areas. 27 Kazuto Tanaka and co-workers investigated the effect of deposition time of carbon nanotubes on carbon fiber on carbon fiber heating elements. 28 Furthermore, Falzon and co-workers reported the growth of an integrated electro-thermal anti-icing/de-icing system especially for carbon fiber composite aerostructures. 29 These extensive studies provide valuable revelation to use carbon fibers as conductive materials for fabric heating elements. However, the limitations of above technologies are the complicated process, which greatly limit their further development. Additionally, since the non-conductive fibers tend to be more ductile than the conductive fibers, the hybrid fabric is superior to the fabric with only the conductive fibers in the flexibility and ductility. Besides, the electrical resistance is higher for the hybrid fabric than the fabric with only the conductive fibers, which results in more heat. 30 Spatially distributed heating allows certain chosen regions to be hotter than others. The distribution is attractive for clothing, as certain parts of the body wearing the fabric heating element needs more warmth than others and certain parts may want to avoid being heated. A resistance heating element that provides spatially distributed heating has not been previously reported.
This work provides a concept for alleviating issues mentioned above. This concept involves a hybrid woven fabric consisting of conductive fibers and non-conductive fibers, with both types of fiber being continuous. In the demonstration, the conductive fibers are carbon fibers, and the non-conductive fibers are glass fibers. The interweaving carbon fabric consists of three regions, namely (i) regions with only the conductive fibers (full carbon), (ii) regions with half of the fibers being conductive and half of the fibers being non-conductive (half carbon), and (iii) regions with only the non-conductive fibers (non-carbon). The carbon fabric possesses high electric heating property and can be used as fabric heating elements. In addition, electric heating efficiency and cooling rate under different load of these carbon fabrics will be investigated. Furthermore, a significant difference in electrical conductivity between in-plane and through-thickness direction of carbon fabric will be clarified. Moreover, the resistance-temperature sensitivity of carbon fiber bundles and fabric will be displayed. These methods and results of the carbon fabric can provide a promising application prospect in the field of spatially distributed heating, and the decoupling method can provide a more suitable selection for the development and analysis of interfacial electricity for carbon fiber and fabric.
Materials and methods
Materials
The continuous carbon fiber was purchased from Zhongfu Shenying Co., Ltd (STY35 3K, China), with 3000 fibers per tow, single fiber diameter of 7 μm, density of 1.78 g/cm3, linear density of 198 g/km, and elastic modulus of 230 GPa. The glass fibers were supplied by Jushi Group Co., Ltd (EDR17-2400–988, Tongxiang, China) with single fiber diameter of 17 μm, linear density of 2400 g/km, and breaking strength of 0.47 N/tex. The use of glass fiber is contributed to its the dielectric properties and low price compared to carbon fiber, and the higher strength compared to ordinary fiber.
The biaxial weaving of mixed carbon fabrics was completed by semi-automatic weaving prototype (Model SGA598 from Depu Co., Ltd, Changzhou, China) in engineering experiment center Zhejiang Sci-Tech University as shown in Figure 1(a) (left). The black yarn represents the carbon fiber and white yarn represents the glass fiber. As illustrated in Figure 1(a) (middle), the grid unit of biaxially woven carbon fabric #3 comprise three kinds of regions (four parts) in-plane on the basis of the content of carbon fibers, namely (i) full carbon region (ii) half carbon region which can be subdivided into vertical direction (the current is parallel to carbon fiber) and horizontal direction (the current is vertical to carbon fiber), and (iii) none carbon region with the non-conductive fibers. The structure parameters of carbon fabrics are exhibited in Table 1. (a) Schematic diagram for the processing of hybrid woven carbon fabrics #3. And three kinds of regions (four parts) of the hybrid carbon fabric, namely (i) full carbon region, (ii) half carbon region including vertical and horizontal region and (iii) non-carbon region. (b) Schematic plot of R
m
vs. l for the electrical decupling of R
m
, R
i
and R
ii
based on equations (2) to (6). For example, the orange slope equals the specimen resistance R
v
per unit thickness. The intercept on the vertical axis equals two times R
i
. l is the length of the carbon fiber; R
m
is the measured resistance; R
i
is the specimen-electrode interfacial resistance and R
ii
is the contact resistance between orthogonal carbon fiber. (c) Schematic diagram of spatially distributed heating, resistance temperature-sensitivity for carbon fabrics. (d) EMI shielding mechanism of carbon fiber fabric. The structural parameters of different carbon fabrics with same carbon fiber volume percentage (67%). (CF = carbon fiber, GF = glass fiber).

Figure 1(b) illustrates the schematic plot of measuring resistance (R m ) verse length (l) for the electrical decoupling of R m (measuring resistance), R i and R ii based on equations (2) to (6). The resistance R m with different length of 4, 6, and 8 cm were measured involving two copper electrodes were positioned at four points of carbon fiber (spaced 4, 6, and 8 cm apart), respectively. The intercept on the vertical axis equals two times the specimen-electrode interfacial resistance (2R i ) for the single carbon fiber bundle. For the orthogonal carbon fiber bundle, the intercept on the vertical axis refers to the sum of the 2R i and the contact resistance between orthogonal carbon fiber tows (R ii ). In addition, the electric conductivity can be obtained from its slope.
Figure 1(c) shows the spatially distributed heating and resistance temperature-sensitivity of carbon paper. When applied current or voltage are connected to these carbon fabrics, the charge will be moving through the conductive carbon fiber network, and the heat will generate for resistance against mobile charge. Due to the various content of carbon fiber resulting from different carbon fabric grid unit, spatially distributed heating can be achieved. In addition, the resistance of carbon fiber was responsive to the change of temperature comes from internal electric or external heating will happen. The difference in resistance temperature response in these two cases is of concern, which is a main aspect of this research. Figure 1(d) shows the electromagnetic shielding mechanism of carbon fiber fabric as our prior report, 31 the electromagnetic shielding is an important application direction.
Electrical characterization methods
Carbon fabric region
The resistance of each region of carbon fabric including in-plane and through-thickness direction were continuously measured by the two-probe method under room temperature using a resistance tester (Keithley DMM 6500, Tektronix Co. Ltd., China). The schematic diagram refers to Figure 2(a). As the carbon fiber fabric has a fiber–yarn–fabric multilevel structure, which results in the conductivity is greatly affected by the test stress and strain. Therefore, the fabrics are fixed with electronic fabric strength machine (YG065, Laizhou Electron Instrument Co. Ltd., China) to ensure the accuracy of measurement. The ambient temperature and humidity have a certain effect on the electrical conductivity of carbon fiber fabric. Therefore, the experiments are performed in the same ambient temperature and humidity. And a pre-tension of 3 N was applied by the electronic fabric strength machine during the testing process to keep the stability of measurement data. Therefore, the data, and the law and conclusion reflected are representative and reliable. Greater forces (like 500 N) can be withstood by our hybrid fabric. 3 N is enough to keep the data be stable and can be applied to more fabrics of other materials in other people’s research or in our future research. (a) Schematic diagram of region resistance testing equipment in-plane direction. (b) The resistance in-plane (the solid line) and through-thickness (the dotted line) direction of two regions (full carbon and half carbon) of the carbon fabric #3. The schematic diagram of the test setting of conductivity in-plane and through thickness are suspend. (c) The in-plane conductivity (the black x-axis on the left) and through-thickness conductivity (the red x-axis on the right) in two regions of full carbon and half carbon (schematic diagrams are inserted).
As depicted in Figure 3(b)(left), the equivalent electrical circuit model of three regions of carbon fabric #3 in-plane direction is given. As mentioned above, the grid unit is divided into three regions, which are the full carbon region (red), the half carbon region (orange) and the none-carbon region (blue). These three regions are connected in series. The resistance of the grid unit R
unit
of carbon fabrics is expressed as follows (a) Schematic diagram for measuring the conductivity of 
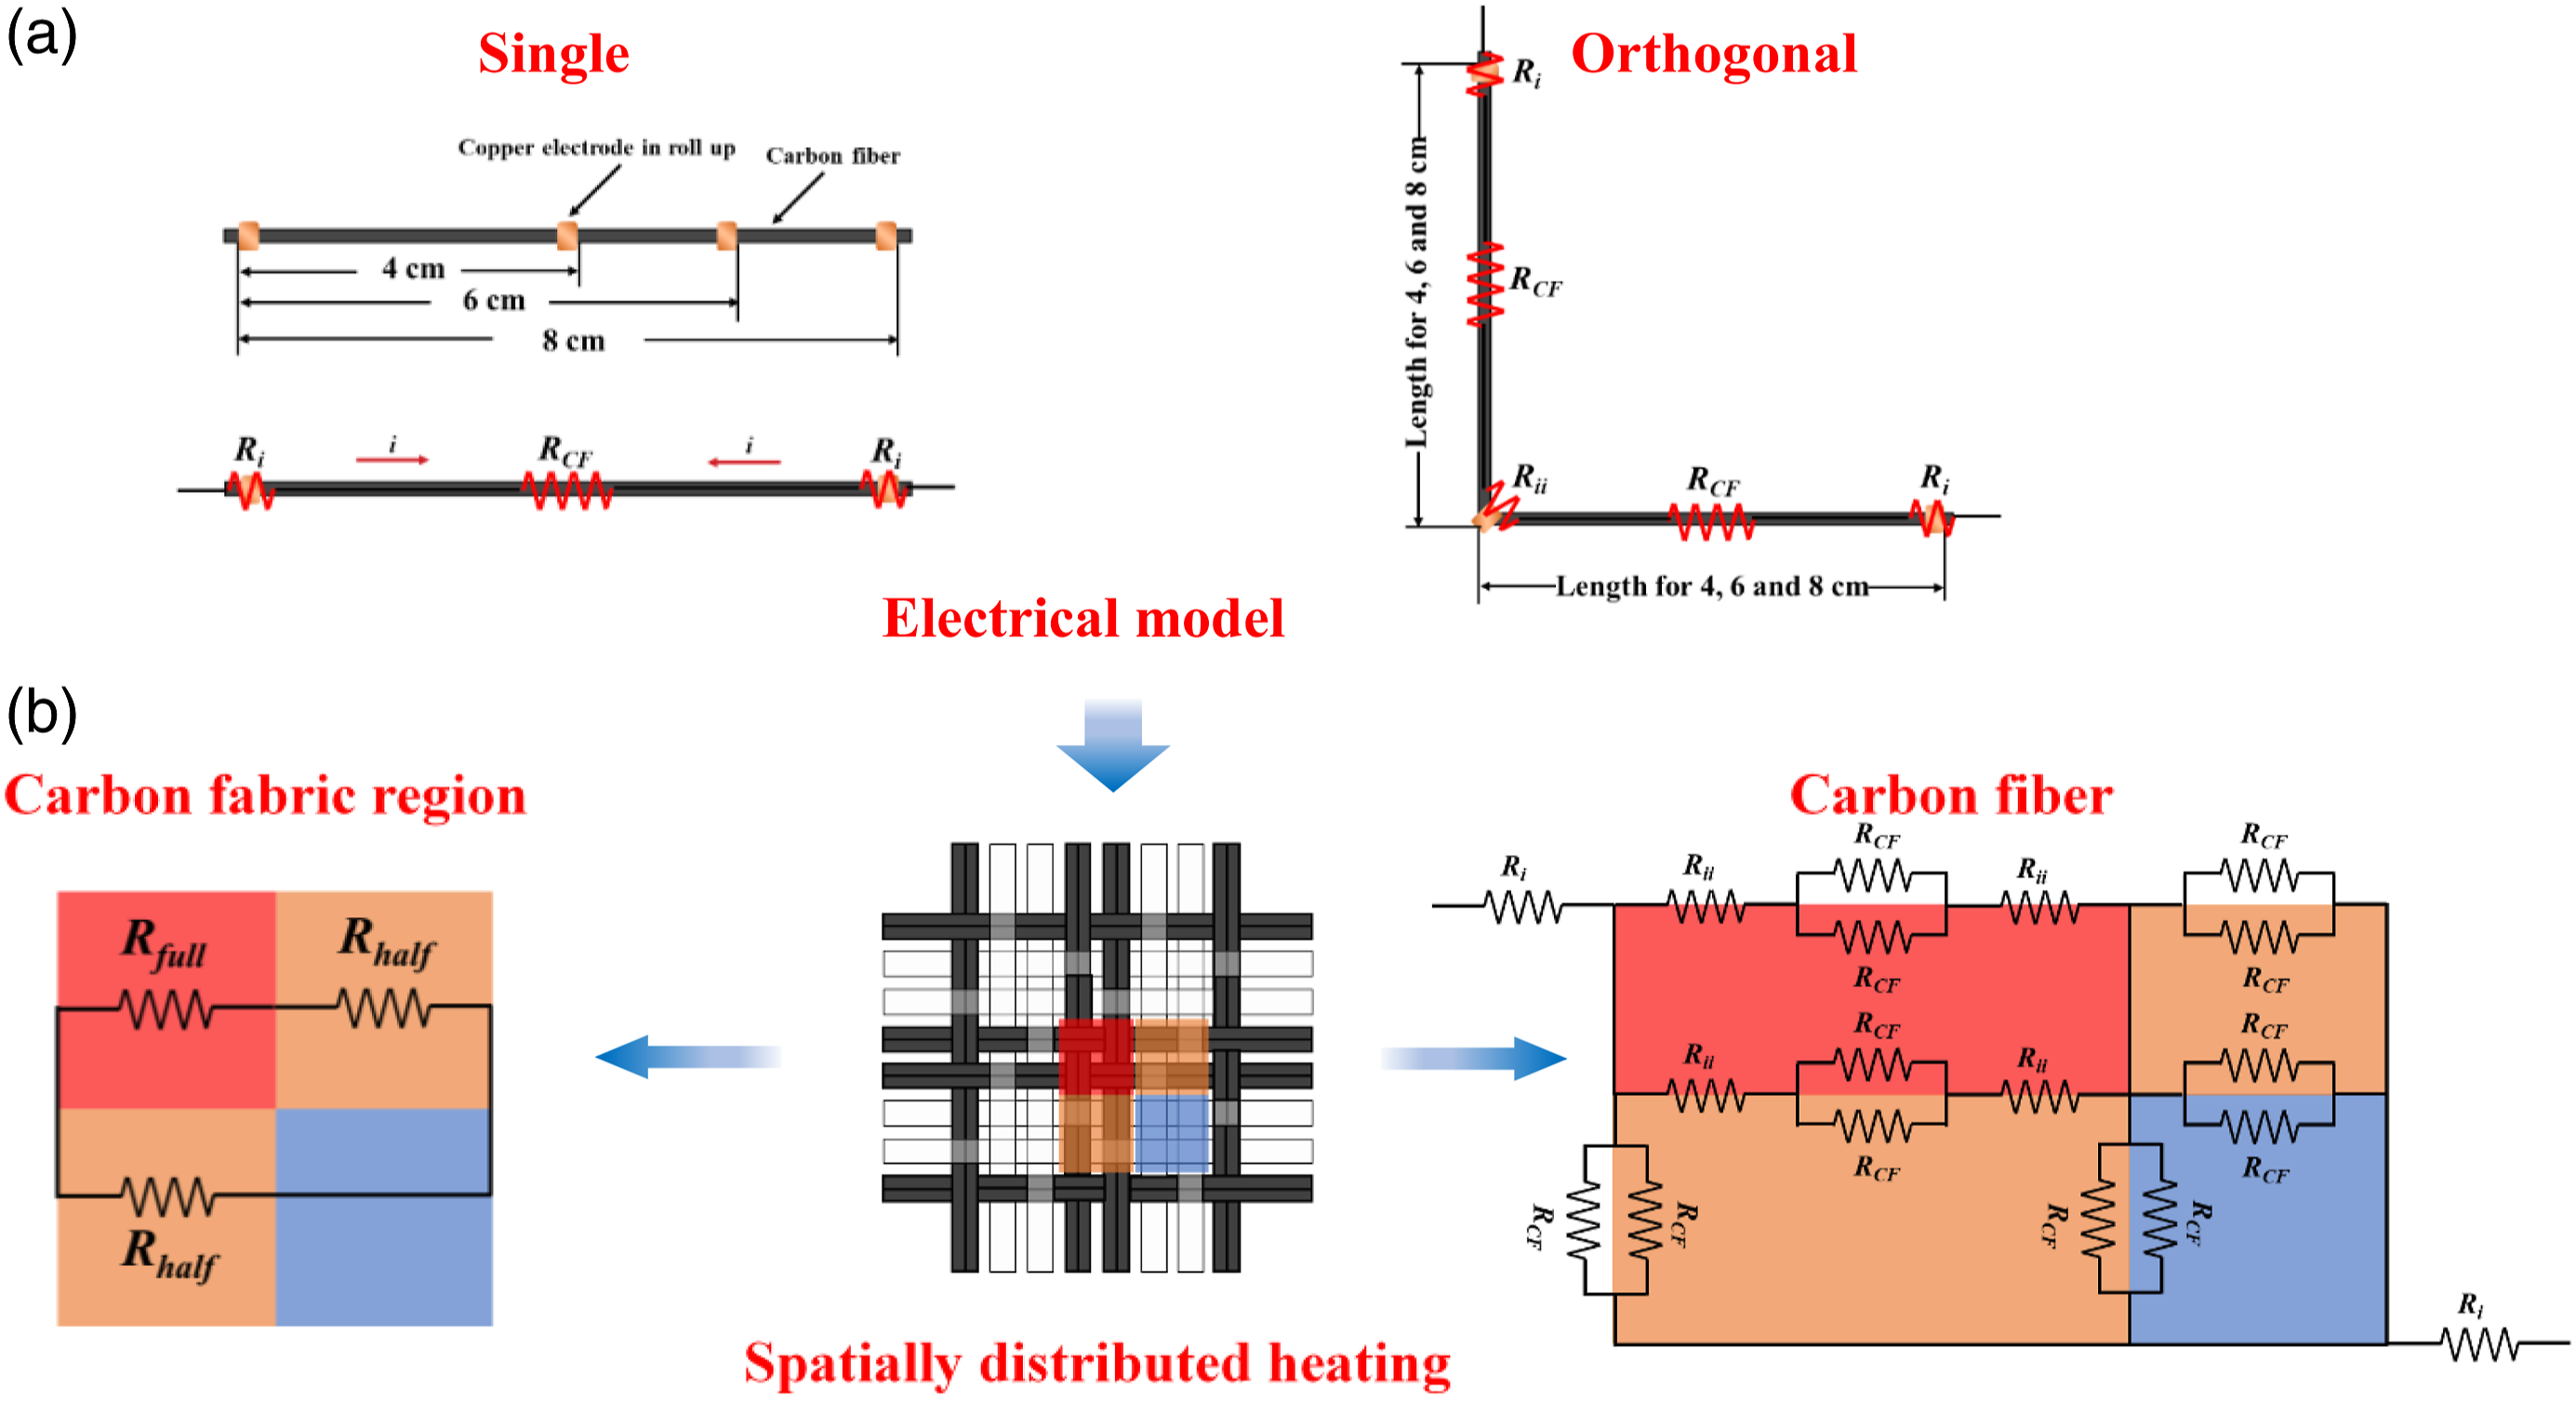
(b) single and (c) orthogonal carbon fiber and the equivalent circuit structure. Where R
CF
is the carbon fiber volumetric resistance. R
i
is the specimen-electrode interfacial resistance, R
ii
is the contact resistance with orthogonal carbon fiber. (b) Equivalent circuit model of three regions of carbon fabrics #3 in-plane direction. The R
full
and R
half
are the resistance of full carbon region and half carbon region.
Carbon fiber
The resistance of carbon fiber bundles in various length were continuously measured by the two-probe method under room temperature using a resistance tester (Keithley DMM 6500, Tektronix Co. Ltd., China), and the carbon fiber bundles were fixed with nuts and applied equal force by a torsion wrench (TLB, 0–3 N.m, PAKE TOOL).
For decoupling of single carbon fiber contact interface resistance, two electrodes are used to measure three sample lengths to provide data for the plot in Figure 3(a) (left). The carbon fiber volumetric resistance (R
CF
) and the interface resistance for one contact interface (R
i
) are in series. So, the measured resistance (R
m
) is given by
R
CF
is defined as follows with the resistivity ρ of carbon fiber

Hence, the resistivity ρ can be obtained from the slope R/l and A based on the formula (3), namely, ρ = (R/l) A = kA, and the contact interface resistance R
i
can be obtained from the intercept. And then, the conductivity σ is calculated
The same method is used for resistance measurement and interface decoupling of orthogonal carbon fibers as shown in Figure 3(a) (right). The measured resistance R
m
is expressed as follows
Considering the significant influence of the contact interfaces resistance on the spatially distributed Joule heating performance, it is significant to obtain electrical decoupling involving contact interfaces beside the overall resistance of carbon fiber heating elements. Therefore, as depicted in Figure 3(b) (right), the equivalent electrical circuit model of three regions for carbon fabrics #3 in-plane direction is given. It should be noted that the copper electrode is contact with the carbon fabric directly, and the corresponding contact resistance is denoted as R
i
. These three regions are connected in parallel. The two probes are located above the copper electrode, to make the current flow from both ends of the copper electrode to the carbon fabric regions. The resistance of the full carbon region (R
full
) is expressed as follows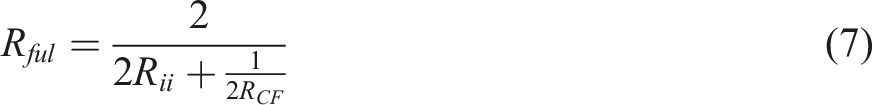
Although the resistance of the half carbon region (R
half
) is
To substitute equation (6) for equation (5)

The R ii can be obtained from the fitting curve of the single orthogonal carbon fiber.
Electric heating characterization methods
The electric heating performance of the fabrics were characterized via infrared (IR) thermal imaging camera (VarioCAM® hr head, Infra Tec, FLIR system, Germany), and (i) the output voltages (3 V, 5 V, and 7 V) were provided by a DC power supply (Agilent E3632A, USA) and (ii) the output currents (0.2 A, 0.4 A, 0.6 A, 0.8 A and 1 A) were provided by a three-way programmable DC power supply (IT6322, ITECH, USA).
Results and discussion
Joule heating performance of carbon fabrics under voltage load
Carbon fabric has significant application value in wearable heaters ascribed to its excellent Joule heating effect.
32
Figure 4(a–c) exhibit the average temperature vs. time of different carbon fabric structures under the 7 V applied voltages involving grid unit/full/half/none carbon. When a voltage is applied, the temperature of carbon fabrics rises up rapidly and displays a favorable linearity which is beneficial to the application of temperature sensing such as resistance temperature detectors. Subsequently, the temperature drops significantly once the applied power is turned off and gradually cooling. Plots of average temperatures framed by red rectangles with different woven fabrics structures for (a) #1, (b) #2, and (c) #3 under the 7 V applied voltages involving grid unit/full/half/none carbon. The diagram of the corresponding organizational structure of each region is marked in different colors which are suspended in the bottom right corner. And the lake blue/red/orange/blue transparent rectangles refer to overall grid unit/full/half/none carbon region, respectively. The infrared image is inserted at the right. (d) The average temperatures in heating stage of overall grid unit and three regions under 7 V applied voltage for carbon fabrics #1 to #3.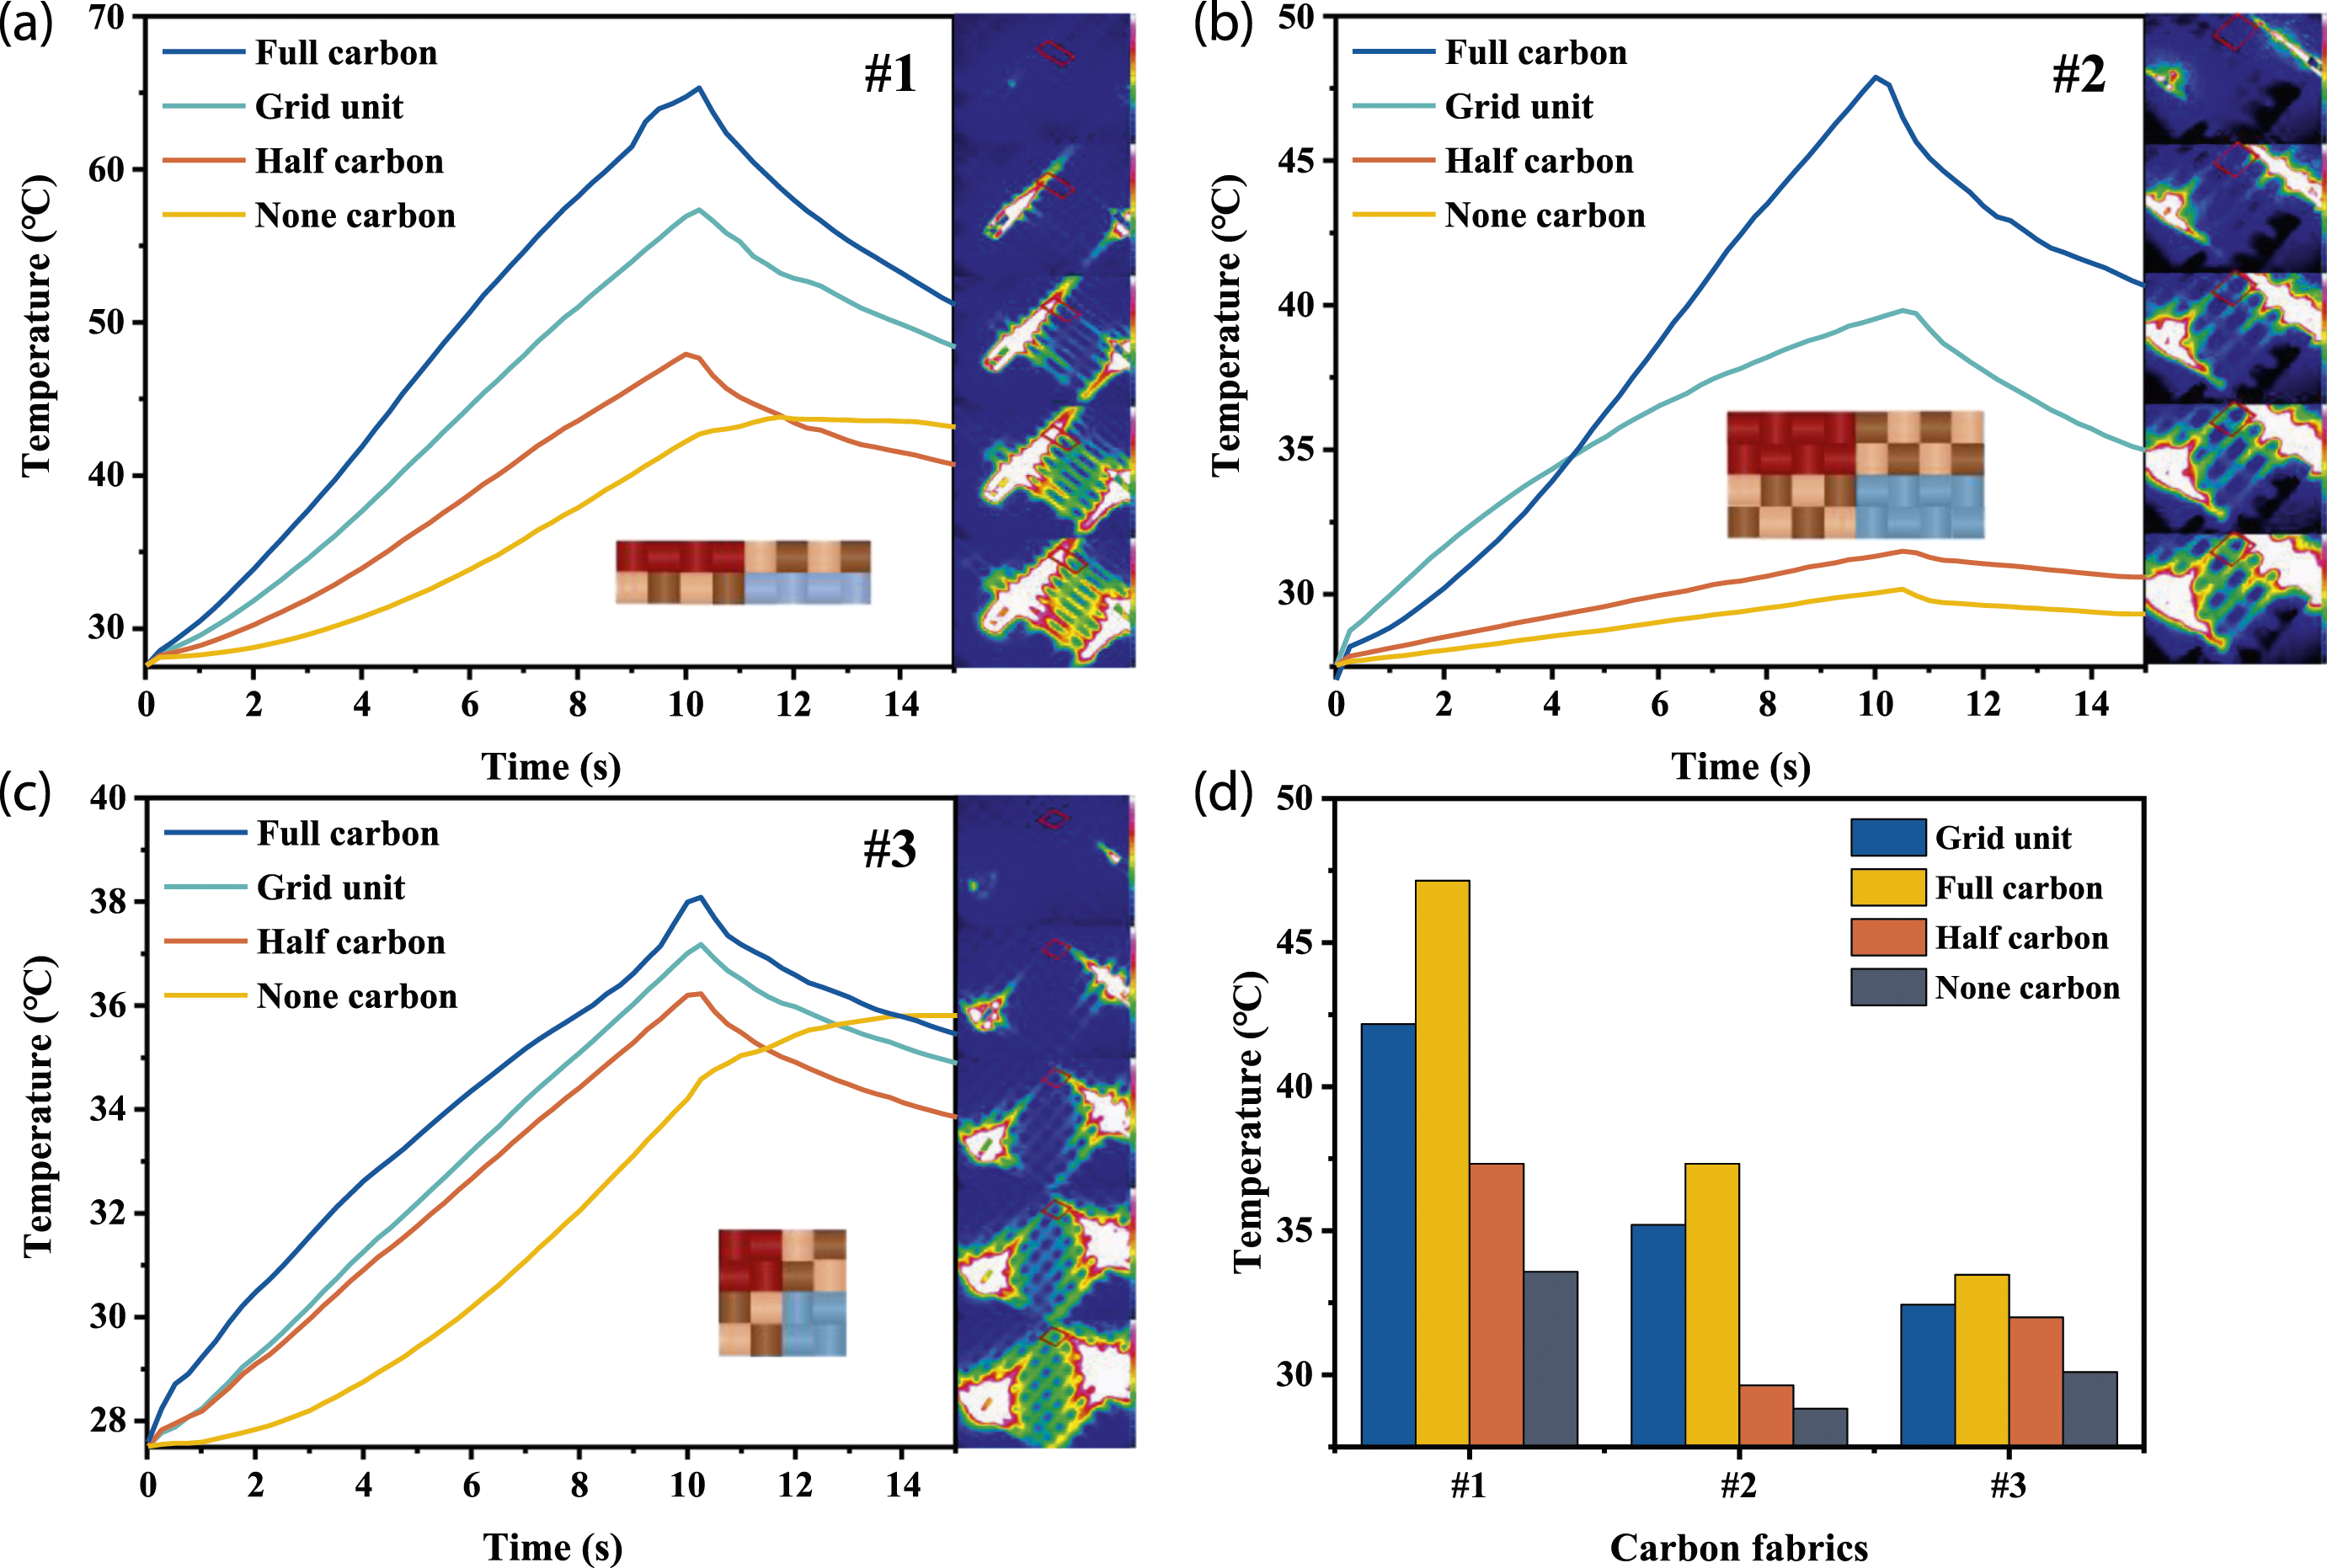
Particularly, a low voltage supply of 7 V can heat the full carbon region of carbon fabric #1 to about 65°C within 10 s, indicating an outstanding heating rate of carbon fiber fabric (Figure 4(a)). The infrared image is inserted at the right of Figure 4(a–c) shows the temperature distribution images at the 7 V output voltage recorded by an IR thermal imaging camera. As can be seen, the infrared images of the carbon fabrics present different colors in diverse regions, indicating the feasibility of spatially distributed heating by adjusting the woven fabrics structure. The spatially distributed heating is originated from the three carbon fabric regions with different carbon fiber content. It can be seen that under the same voltage, the average temperatures of the carbon fabrics increase as the increment of the carbon fiber content resulting in more conductive pathways. In other words, the regions with only the conductive fibers (full carbon) exhibit higher temperature which reach up to 65°C (Figure 4(a)) than that of half carbon.
The thermal power P is related to the voltage U and resistance R of the material, as follows
Therefore, the thermal power increases as the decrease of the resistance under the same voltage, the decreasing of resistance is resulting from the increasing of the carbon fiber content. The average temperature of half carbon region in Figure 4(a–c) is the average of these two parts. In addition, because it does not contain carbon fiber, the temperature of the non-conductive region goes up with the time which also serves as the heat spreader and a heat-protected region. Consequently, when 7 V voltage was applied to the fabric, the full carbon region is the hottest (37°C–65°C), the half carbon region is less hot zone (31°C–48°C), while the non-carbon region is least hot (30°C–43°C).
The average temperatures of the grid unit and three regions of various carbon fabrics at 7 V applied voltage are shown in Figure 4(d). (i) The highest temperatures of the overall grid unit in heating stage are 57.4°C, 39.7°C, and 37.2°C for fabrics #1, #2, and #3, respectively. And the smaller the grid unit (the more uniform), the higher the temperature. Therefore, the spatially distributed heating temperature can also be achieved by carbon fabrics with different grid units, which are attributed to the different arrangement of carbon fibers in warp and weft direction, as well as the contact interface between the carbon fibers. Therefore, a detailed analysis of the electrical behavior including the decoupling of interfacial electricity caused by its structure is necessary. (ii) The temperature of full carbon region is the highest, reaching 65.4°C, 47.7°C, and 38.1°C for different woven fabrics structures of #1, #2, and #3, respectively, while the temperature of the half carbon region and the non-carbon region is lower than that of the grid unit region. (iii) The average temperatures between various regions of carbon fabrics varies greater compared with that of different grid units, which results from the differences of internal electrical parameters of different grid units between carbon and fabrics. All in all, under the same load (voltage load), the fabric structure results in different rates of the temperature rise, which proves the feasibility of spatially distributed heating of carbon fabrics.
Joule heating performance of carbon fabrics cell
Most the research and applications adopted the voltage heating. Therefore, voltage heating was performed. More importantly, to measure the resistance and applied current in real time to analyze the resistance-temperature sensitive behavior, the current method must be adopted by a three-way programmable DC power supply (IT6322, ITECH, USA). The applications include the temperature sensing, the spatially distributed heating using a hybrid fabric. Figure 5 shows the electric heating performance of carbon fabrics under applied current. Unlike chapter (3.1), in order to measure the resistance and applied current in real time, the 2-probe method is adopted to offer output currents (0.2 A, 0.4 A, 0.6 A, 0.8 A and 1 A) and a resistance tester (Keithley DMM 6500, Tektronix Co. Ltd., China) to measure the real time voltage on the sample. The temperature of carbon fabric regions under different applied currents are illustrated in Figure 5(a–c). The temperature of the full carbon region goes up almost vertically, reaching the corresponding equilibrium temperature in 7 s under various output currents, respectively (Figure 5(a)). It is worth noting that the heating curves of full carbon region under different load currents produce good consistency which is beneficial to a timeliness and effective control systems for heating temperature and the practical application in the field of temperature control. The temperature variation of different regions of (a) full carbon, (b) vertical half carbon and (c) horizontal half carbon under different applied currents. (d) Equilibrium temperature and equilibrium time divided by three regions of carbon fabric #3 under 0.2 A applied current. (e) The different stages (rising, stable and falling) of full carbon region with 1 A applied current. (f) Schematic diagram of region carbon fabric electro-thermal heaters with current source. 
Apart from the good consistency during the heat-up period, the half carbon region can reach the corresponding equilibrium temperature in 9 s under various output currents (Figure 5(b)). The equilibrium time of the horizontal half carbon region is correlated to the magnitude of the currents and reaching the equilibrium temperature in 17 s at the output current of 0.2 A (Figure 5(c)). At the same time, the temperature drops significantly and gradually cools to room temperature after cutting off the power supply. Especially, the carbon fabric region can be heated to about 56°C, respectively, at the output current of 0.4 A, indicating outstanding electrical and heating effect. Similarly, ascribe to the higher resistance resulting from longer current path and smaller cross-sectional area, the highest temperature in the vertical half carbon region can rise up to 120°C, higher than 111°C of the full carbon region and 98°C the horizontal half carbon region.
The equilibrium temperature and equilibrium time versus three regions of carbon fabric under low current 0.2 A are shown in Figure 5(d), the corresponding saturation temperature of full carbon/vertical half carbon/horizontal half carbon region is 42.1°C, 41.6°C, and 38.8°C, which exhibits the approximate results. It is worth noting that the equilibrium times of three regions is 3 s, 9 s, and 17 s of three regions for carbon fabric #3 at the low output current of 0.2 A. The rapid temperature rising of full carbon region is contributed to carbon materials (such as carbon fiber) possess electron transport capabilities and fast thermal conductivity in composite materials.
The corresponding infrared image of the heating process of the full carbon region under 1 A current is displayed in Figure 5(e). It can be seen that the color of the full carbon region changed from dark blue to bright white within 7 s, showing the well heating rate. Furthermore, the fabric woven grid structure can be caught sight of during the falling stage. In the stable state, an evenly distributed temperature is observed due to the heat transfer performance and uniform loading of carbon fiber. When the power is turned off, the temperature quickly drops to close to the room temperature. Figure 5(f) shows the schematic diagram of region carbon fabric electro-thermal heaters with current source. The copper electrodes are sticked on both sides of the carbon fabric measurement area.
The conductivity of each region of carbon fabric
Fabric possesses multilevel structure from fiber, yarn to fabric interweave structure, which render flexibility, ability of slip, and resulting in anisotropy between the through thickness direction and the in-plane direction, and anisotropy of warp and weft in the plane. However, this slippable deformation property brings uncertainty to the measurement of conductivity and other properties for the carbon fabrics. To clarify the problem, the resistance of carbon fabrics was measured fixed with electronic fabric strength machine under applied pre-tension.
The schematic diagram of resistance testing equipment in-plane direction (Sample #3 is taken as an example) at room temperature is depicted in Figure 2(a). According to the direction of current, the half carbon region in-plane is divided into two parts: (i) The applied current is parallel to the carbon fiber (vertical half carbon) in which the resistance masked as Rc⊥, which is mainly from the axial resistance of carbon fiber body. (ii) The applied current is vertical to the carbon fiber (horizontal half carbon) in which the resistance masked as Rc//mainly comes from the contact resistance between fibers.
Figure 5(b) shows the resistances of in-plane and through-thickness directions. The resistance remained stable during the measurement period (120 s), indicating that the accuracy of the test results can be achieved under applied pre-tension involving the use of the electronic fabric strength machine. The schematic diagram of the test setting of conductivity in-plane and through thickness are suspend. An insulating tape is used to fix the copper electrode and maintain the stability of sample shape and the insulation between the electrodes. As revealed in Figure 2(b), in-plane direction, the resistance of the full carbon region (∼0.35 Ω) is slightly less than that of the vertical half carbon region (Rc⊥ is of ∼0.41 Ω), and obviously below that of the horizontal half carbon region (Rc//is of ∼0.59 Ω). As mentioned above, this diversity is contributed to the orientation of carbon fibers, and the Rc//mainly comes from the contact resistance between fibers, which is greater than that of Rc⊥ mainly comes from the axial resistance of carbon fiber body. In through-thickness direction, the resistance of the full carbon region (∼0.42 Ω) is less than that of the half carbon region (∼0.62 Ω). It can be explained that the more carbon fibers form a more conductive path in the full carbon region. As a layered structure along the axis of single carbon fiber, the carbon fiber has the advantages of excellent mechanical properties and electrical conductivity in axial direction, while the properties with through-thickness direction (interlayer) is low.
As depicted in Figure 2(c), the electrical conductivity decreases notably in through-thickness direction are 177 S/m and 71 S/m, respectively. And the conductivity of the vertical half carbon region in-plane direction reaches up to 6150 S/m, which demonstrates an outstanding electrical conductivity. Simultaneously, the full carbon region also shows satisfactory electrical conductivity is of 4035 S/m; the electrical conductivity of the horizontal half carbon region is 1568 S/m, which shows a significant anisotropy between plane and thickness directions. The mechanism behind it is identical to that the axial resistance of carbon fiber body is far below the contact resistance between fibers, and the carbon fiber is mainly oriented in-plane direction which leads to a remarkable improvement of in-plane electrical conductivity. The conductivity in the vertical half carbon is greater than that in full carbon region. And the conductive and electro-thermal (Figure 5) results are different from the whole sample, the possible reason and mechanism are that the contact resistance between the copper foil electrode and fiber sample has a great influence or even a decisive influence. In addition, the unit of sample grid (#3) is small, the contact resistance of the electrode and the carbon fiber which lead to a greater influence. Meanwhile, the thickness direction resistance formed by the superposition of the two kinds of contact resistances between the electrode—carbon fiber and orthotropic carbon fiber — carbon fiber is much greater than the planar resistance. Obviously, this homogeneous and heterogeneous interface and the fabric–yarn–fiber multilevel structure have a strong impact on the electrical and thermal properties, and it is necessary to provide a selective characteristic method to analyze and study the structural electricity comes from the fiber orientation and multilevel structure, especially interface electricity. This is an important research aspect of this paper.
Electrical behavior decoupling involving contact interfaces of carbon fiber bundles
As mentioned above, the interfacial resistance of the carbon fabrics, the single and orthogonal carbon fiber bundles can be decoupled by the measurement of resistance at least 3 different lengths and based on equivalent circuit mode. Figure 6(a) exhibits the schematic diagram of resistance measurement and results of the single and orthogonal carbon fiber bundles which are fixed with nuts and gaskets. Two orthogonal carbon fiber bundles are fastened with nuts at the orthogonal point, while current flows from both ends to the orthogonal point. The contact resistance between orthogonal carbon fibers (R
ii
) and electrode/carbon fiber (R
i
) can be obtained through the curve intercept, R
i
and R
ii
are about 3.7 Ω and 6.4 Ω for one carbon fiber bundle, and the self-body resistance per centimeter of one single carbon fiber bundle is about 0.88 Ω/cm. The self-body electrical conductivity σ can be obtained from the slope k, which are ∼3.6 × 10⁴ S/m and ∼3.4 × 10⁴ S/m for single carbon fiber bundle and orthogonal carbon fiber bundles. The self-body electrical conductivity of single carbon fiber bundles is slightly higher than that of orthogonal carbon fiber bundle ascribe to the effect of contact resistance R
ii
. The schematic diagram of resistance measurement and results of different length of (a) single and orthogonal carbon fiber bundles, (b) two, four and eight carbon fiber bundles. The R
MCF
is the total resistance of multiple carbon fiber bundles and R
P
is the interface resistance between the two parallel carbon fibers. (c) The R
P
(left), 2R
i
(right) verse different number of carbon fiber bundles. The average value of R
P
and 2R
i
as a percentage of the total measured resistance in 6 cm length are inserted. (d) self-body conductivity (left) and measuring conductivity (right) verse different number of carbon fiber bundles.
Figure 6(b) illustrates the equivalent circuit model of multiple carbon fiber bundles, where R P refers to the contact resistance between two parallel carbon fiber bundles, and together in parallel with R MCF . To explore the contact resistance between the parallel carbon fiber bundles, the plots of resistance versus length of two, four and eight carbon fiber bundles are determined as Figure 6(b) shown. The results demonstrate that the resistance reduces with the increment of the number of carbon fiber bundles, owing to a parallel circuit is formed between the carbon fiber bundles. The resistance per centimeter of two, four and eight carbon fiber bundles are about 0.82 Ω/cm, 0.56 Ω/cm and 0.32 Ω/cm, respectively.
According to the equivalent circuit model, the resistance of R
p
can be calculated with the following equation
In fact, since the contact resistance between carbon fiber and electrode/carbon fiber is greater than its body resistance, the relationship of average resistance versus length is linear in Figure 6(b). Especially the two carbon fiber bundles, the average ration of the contact resistance between carbon fiber and electrode to body resistance is ∼6, which does not include the contact resistance between the carbon fibers. Therefore, the R
MCF
expresses as follows
Substitute equation (12) into equation (11)

As shown in Figure 6(b), the contact resistance R P between parallel carbon fibers increases with the increment of carbon fiber bundles and decreases of carbon fiber length which are both attributed to the enhanced interface action. Namely, the more roots and the shorter the length, more surfaces must be crossed. That is, the eight carbon fiber bundles give a maximum contact resistance R P of 2.0 Ω at 4 cm length and two carbon fiber bundles gives a minimum contact resistance R P of 0.16 Ω at 8 cm length. Taking 6 cm length as an example, the measuring resistance R m of multiple carbon fiber bundles are 9.73 Ω, 4.98 Ω, and 2.14 Ω for two, four and eight carbon fiber bundles, respectively. The contact resistance R P between parallel carbon fibers is of 0.21 Ω, 0.33 Ω and 0.72 Ω for two, four, and eight carbon fiber bundles, which are calculated on the basis of the equation (13). The contact resistance between electrode/carbon fiber 2R i is obtained by the intercept of the curve, which are about 4.80 Ω, 1.64 Ω, and 0.23 Ω for two, four, and eight carbon fiber bundles, respectively. Based on those results we can reach the conclusion that the contact resistance R P between parallel carbon fibers and the contact resistance between electrode/carbon fiber 2R i account for notable 14.2% and 31.0% of the total measuring resistance, respectively, which is interesting and noteworthy.
Figure 6(d) displays the self-body conductivity (left) and measuring conductivity (right) of different amount of the carbon fiber bundles. The self-body conductivity is determined by the slope k. The slope k is proportional to the reciprocal of the electrical conductivity of the carbon fiber bundles. It is obvious that the electrical conductivity decreases with the increases of carbon fiber bundles. In particular, the self-body conductivity/measuring conductivity of one carbon fiber bundles reaches ∼3.6 × 10⁴ S/m and ∼1.5 × 10⁴ S/m, respectively, indicating the superior electrical conductivity. Meanwhile, there is a non-linear relationship between the quantity and the conductivity of carbon fiber bundles as Figure 6(d) shown, which is contributed the contact resistance as mentioned above. Most of the previous studies on the electrical conductivity of carbon fiber bundles simply treats carbon fiber bundles uniformly as a whole. The decoupling method, model, and data in this paper can provide a more suitable selection for the development and analysis of interfacial electricity for carbon fiber and fabric.
Resistance-temperature sensitive behavior of carbon fabric
Figure 7(a) shows schematic illustration of testing setup for resistance temperature-sensitivity of carbon fabrics. The relative resistance variations of carbon fabric at a current of 0.2 A–1.0 A as a function of steady-state temperature as illustrated in Figure 7(b). The resistance variation rate is defined as ((R—R
0
)/R
0
) × 100% = ΔR/R
0
× 100%, where R
0
and R are the resistance value at 25°C and the measure resistance value, respectively. As expected, the greater the applied current, the relative resistance variation of the carbon fabric is more significant. Moreover, the resistance variations in full carbon region are the most obvious, up to 50.7% in 1 A applied current. The resistance of vertical and horizontal half carbon regions can arrive to 39.6% and 22.7%, showing remarkable anisotropy. More importantly, the temperature coefficient of resistance of full carbon, vertical half carbon and horizontal half carbon regions show a linear resistance-temperature change with the temperature coefficient of resistance (TCR) of −0.596%/°C, −0.362%/°C and −0.303%/°C, indicating that the carbon fabric prepared in this work has significant temperature sensitivity (The unit %/°C is the percentage change in resistance per temperature, namely, the corresponding percentage change in resistance for one-degree Celsius temperature change). (a) Schematic illustration of testing setup of resistance temperature-sensitivity of carbon fabrics. The plots of resistance variations versus steady-state temperature of full carbon, vertical half carbon and horizontal half carbon heated by (b) current and (c) oven. The oven temperature is set according to the average stable temperatures in Figure.4. The (d) average resistances and (e) resistance variations of single carbon fiber bundle (6 cm) under various oven temperatures.
To further verify the resistance-temperature sensitivity of carbon fabric, the resistance variations of full carbon, vertical half carbon, and horizontal half carbon under oven were performed as Figure 7© shown. And the oven temperature is set on the basis of the steady-state temperature of the carbon fiber fabric regions in Figure 5. The results show that the resistance decreases with the increase of temperature, whether in applied current or in oven. The resistance variations of full carbon, vertical half carbon and horizontal half carbon are reach 50.2%, 28.4%, and 15.9%, respectively. And the temperature coefficient of resistance is −0.562%/°C, −0.258%/°C, and −0.252%/°C which are similar to the results under applied current, indicating that the resistance changes of carbon fabric in applied current and in oven are both caused by temperature rise. The TCR results of full carbon > that of vertical half carbon > that of horizontal half carbon > that of single carbon fiber bundle, which should also be attributed to the interface. Therefore, it is necessary to conduct decoupling research on the resistance of the contact interface as mentioned above.
Figure 7(d) shows the average resistance of single carbon fiber bundle with length of 6 cm under various oven temperatures, three measurements are taken. The resistance decreases as the increment of oven temperature, and the results give similar linear relationship. The responsivity of single carbon fiber bundle to temperature is calculated as Figur©(e) shown. The resistance of single carbon fiber bundle decreases monotonically with the increases of oven temperature and the well resistance temperature-sensitivities with the temperature coefficients of resistance (TCR) of −0.168%/°C, −0.144%/°C, and −0.161%/°C are given, respectively. Compare the results of the Fi©e 7(e) and , the resistance of single bundle decreases less with temperature than that of carbon fabric regions, and the fitting degree of linearity is higher, which may be attributed to the contact interface and multilevel structure of carbon fabric.
With the increasing of temperature, the relative resistance of single carbon fiber bundle reduces slightly (< 0.15%), attributed to the decrease of the bulk resistance of carbon fiber with the increase of temperature, and the change of contact resistance between carbon fiber yarn due to the thermal expansion of carbon fiber caused by high temperature. The thermal expansion coefficient of carbon fiber is as follows: (0.5 × 10⁻⁵)–(1.9 × 10⁻⁵) (radial) and (−10 × 10−7)–(−9 × 10⁻⁷) (axial). 33 The carbon fiber bundle expands in the radial direction, but contract in the axial direction, and the absolute value of the thermal expansion coefficient in the radial direction is much larger than that in the axial direction. According to equation (2), R = ρl/A, the ρ and l decrease, while A is increasing in heating process, the resistance of the carbon fiber bundle decrease. In the other words, the change of carbon fiber size caused by thermal expansion would lead to the decrease of the resistance. However, the size effect is small enough (0.5 × 10⁻⁵)–(1.9 × 10⁻⁵) (radial) and (−10 × 10−7)–(−9 × 10⁻⁷) (axial)) to be ignored.
The change of contact resistance between carbon fiber yarn can be expressed as follows
34
Conclusions
In summary, electrical conduction, spatially distributed electrical heating behavior, resistance temperature-sensitivity and interfacial electrical behavior of carbon fiber fabrics were explored, which pertains to the multi-scale structures of the carbon fabric including full carbon, half carbon (vertical/horizontal) and non-carbon region.
The carbon fabric, as a heating element, gives an excellent electro-thermal response, which can be heated up to the equilibrium temperature of 42°C for the full carbon region within only 3 s at a low applied current 0.2 A. In addition, the average values of σ///σ⊥ is ∼35, which shows a certain anisotropy. Furthermore, the interfacial resistance the carbon fabrics, the single and orthogonal carbon fiber bundles is decoupled by the resistance measurement of 3 different lengths and equivalent circuit mode is provided. The self-body resistance per centimeter of single carbon fiber bundle is 0.88 Ω/cm, while the self-body electrical conductivity is as high as 3.6 × 10⁴ S/m. And 2R i and R ii are 3.7 Ω and 6.4 Ω, respectively.
At last, it is proved that the carbon bundle gives a good linearity for the resistance-temperature sensitive behavior. And full carbon, vertical half carbon, and horizontal half carbon give the sensitivities of the relative resistance change rate of −0.562%/°C, −0.228%/°C, and −0.252%/°C, respectively. Consequently, carbon fabric provides a promising candidate in spatially distributed fabric heating elements by the weaving of conductive fibers and non-conductive fibers. And the electrical decoupling method and data are selective method and reference for the characteristic and development of carbon fiber fibric materials. Apart from the decoupling method and characterizations, the applications of these hybrid carbon fabrics include the spatially distributed heating using a hybrid fabric, selective electromagnetic shielding etc.
Footnotes
Declaration of conflicting interests
The author(s) declared no potential conflicts of interest with respect to the research, authorship, and/or publication of this article.
Funding
The author(s) disclosed receipt of the following financial support for the research, authorship, and/or publication of this article: This research was supported by the National Natural Science Foundation of China (NSFC 51803185), Public Welfare Project of Zhejiang Province (LGF21E030005), China Postdoctoral Science Foundation (2020M681917), Postdoctoral Foundation of Zhejiang Sci-tech University Tongxiang Research Institute (TYY202013).