
Abstract
Fog collectors have gained increasing attention as an efficient solution to overcome the water scarcity concerns in arid and semiarid environments. Besides the rapid advances made in various collector designs, the role of geometrical characteristics of the fog collector meshes is not fully understood. Therefore, the main objective of the present research is to address this issue and investigate the effects of textile features on the efficiency of conventional meshes which has not been discussed in previous works. The collection efficiencies of various conventional structures (plain-woven, plain-knitted, and 3-D spacer) with different characteristics (fiber diameter, fiber spacing, fiber arrangement, shading coefficient, and test direction) were investigated using a custom-made fog collecting device. The weight of collected water over time and the onset time were measured to assess the performance of different samples. Moreover, a simple simulation of a plain-woven structure was developed using Computational Fluid Dynamics (CFD) to perform further analysis. The results revealed that in the woven structure, the collection efficiency was improved by changing the shading coefficient to an optimum value and simultaneous decreasing fiber diameter. In the spacer fabrics, the position and arrangement of the spacer fibers posed considerable effects on the collection efficiency. 3-D spacer meshes showed highest value of collection efficiencies and onset time in comparison to the other examined meshes. The results of simulation of woven structures were also validated by comparing computed and measured collection efficiencies.
Introduction
Today, severe water scarcity due to population growth, increase of industrial activities, and inadequate water management has become a major global concern. 1 In order to alleviate water scarcity, fog collection as a promising and energy efficient solution is introduced and applied specifically in arid and semiarid environments.2,3
Fog is an aerosol system composed of tiny water droplets range from 1 μm to 50 μm suspended in the air. 4 The fog collectors are installed vertically, perpendicular to the wind direction, and separate fog water droplets suspended in the air. 3 The wind flow is responsible to push the tiny fog droplets towards the fog collector, and only a portion of droplets will be captured and collected on the collector surface. Owing to the continuous collision of the droplets with the collector surface, adjacent small droplets merge together to form large droplets and slip down due to gravity. 5 The average collection rates of fog collectors are around 1–12 L.m−2.day−1 6 .
The original concept of fog collectors is bioinspired by desert inhabitants (such as Namib beetles and Cactus spines). 7 After the first modern fog collection was introduced in the mid-20th century, different types of fog collectors have been developed 8 for various applications such as reforestation, agricultural, 9 and industrial purposes. 6 A standard fog collector consists of a collecting medium or mesh where the fog droplets are deposited on its surface.9,10 Raschel mesh, knitted from filament fibers with a rectangular cross-section, is one of the most common collecting media that is applied in a single- or double-layer configuration.3,5 Metal meshes, due to their durability and metallic properties, are another promising collecting medium that have gained great interest. The applications of metallic structures (woven,11,12 knitted,5,13 or expanded14-16) are not only limited to fog collectors but also in energy absorption applications.17-19 In fog collection applications, the efficiency of the collectors is influenced by the fog liquid water content, the fog droplet size distribution, the wind speed and the collector characteristics. 20 The most controllable aspect for improving fog collection efficiency is to modify the design of the fog collector. Many efforts have been made to improve the fog collector efficiency by adding different materials (such as nanoparticles 12 or nanofibers21-24), charge injection,10,25 wettability modifications,26-28 surface coating,21,29-31 and chemical treatments.32,33 However, most of the novel innovations are in laboratory stage and may suffer from high costs or lack of sufficient stabilities in operational conditions. Very few researchers have focused on geometrical optimization of the mesh structure in the conventional fog collectors. 34 Some research studies have shown the effects of textile parameters (such as fiber fineness,26,35 fiber shape, 36 fiber spacing, 30 and mesh shading coefficient37,38) on the fog collector efficiency. However, the other structural aspects of fog collectors such as fiber arrangement, test direction and their influences on collection efficiency have not been investigated. According to literature, image processing techniques have been widely used to extract the geometrical characteristics of fibrous structures. Based on image processing techniques, the textile parameters such as surface roughness and fiber spacing can be evaluated.39,40 As mentioned by previous research works,41,42 another aspect of the fog collector performance that should be included in considerations is the Onset time. Limited research works have investigated the onset time of fog collectors. Hou et al. 43 defined the onset time as the time of the first sliding of water droplets in hybrid dew-harvesting surfaces. Most of the previous studies have explained the onset time by referring to the work conducted by Jiang et al. 41 For instance, Wang et al. 44 defined the onset time as the time between the beginning of droplets capture and their eventual delivery to storage. Similarly, Shi et al. 45 defined the onset time as the initial period between the start of fog and the actual collection of any water. From the literature review, onset time can be defined as the time that the first water droplet starts to shed from the mesh surface.42,46,47 Therefore, in the present research, the onset time is also considered in investigations to evaluate the collection rate of different mesh structures.
In the other hand, the lack of numerical simulations about fibrous texture of the fog collectors, makes it hard to get a full understanding of the effects of textile parameters on collection efficiency. In this case, a computational fluid dynamic (CFD) simulation would be an appropriate method in clarification of the relationship between the fog collection efficiency and its effective factors. For instance, Carvajal et al. 1 developed a 3-D simulation to determine the effects of the overall structure of fog collectors on aerodynamic collection efficiency. However, the structural characteristics of the mesh texture were not considered. Therefore, the main objective of the present research is to provide a better understanding of the role of textile features in improving the fog collection efficiency, through both experimental tests and numerical simulations. The effects of fiber diameter, fiber spacing, fiber arrangement, shading coefficient, and test direction on the fog collection efficiency of conventional structures (woven plain, knitted plain, and knitted spacer) were investigated. A CFD simulation was also developed to solve the fog flow field inside the void space between the woven fibers to compute the virtually estimated aerodynamic collection efficiency and capture efficiency based on shading coefficient and fiber diameter. Therefore, simulations were performed in two steps. First, a CFD simulation was employed to virtually estimate the aerodynamic efficiency as a function of the pressure drop and shade coefficient based on Rivera 38 equations and optimal shading coefficients of woven samples were found. Then, by considering experimental conditions, DPM method was employed to estimate droplets capture efficiency and compare the experimental results of capture efficiencies with simulations data.
Experimental procedure
Fog collector mesh characteristics
Fog collectors’ specifications.

To investigate the effects of test direction, each knitted sample was tested twice, first in the knitting direction and then in the opposite direction (rotated 180°). Each spacer sample was also tested three times using a different test direction each time (rotation in first, second, and third tests were 0o, 90o, and 180o, respectively). To evaluate the test reliability, each test was repeated three times and the mean value of observations was reported. All the samples were cut into 60 mm×60 mm pieces and the edges of the knitted samples were fixed by metallic wires to prevent them from curling. Figure 1 represents the images of the samples. The images of woven mesh: (a) W1, (b) W2, (c) W3, and (d) W4; Knitted mesh: (e) K1 [i.e., K1-0 or K1-180], and (f) K2 [i.e., K2-0 or K2-180]; Spacer mesh: (g) S1 [i.e., S1-0, S1-90, or S1-180], (h) Schematic of S1 [i.e., S1-0, S1-90, or S1-180], (i) S2 [i.e., S2-0, S2-90, or S2-180] and (j) Schematic of S2 [i.e., S2-0, S2-90, or S2-180] k) the rotation conditions of knitted and spacer structures.
It should be noted that unlike woven structures, the geometrical aspects of knitted structures cannot be simply represented by fiber spacing. Figure 2 represents the geometrical parameters of loops in different knitted samples. The dimensions and geometrical parameters of the knitted samples.
The side length of hexagons in spacer samples of S1 and S2 were 5 mm and 4 mm, respectively. In Sample S1, six parallel spacer monofilaments at each hexagonal side connected the honeycombs of outer layers together while in sample S2, eight crossed over monofilaments at each hexagonal side connected the outer layers of the spacer mesh.
Fog collection efficiency measurements
All the samples were mounted in a custom-made device (Figure 3), opposite the fog flow direction. The designed experimental setup consists of two concentric cylinders with diameters of 100 mm and 60 mm. Fog droplets with an average diameter of 3 μm and maximum rate of 0.4 L.h-1 were generated by an ultrasonic humidifier (Feller, AH 150 WOR) and conveyed into the inner cylinder. Each sample was placed in front of the end of two cylinders, where fog flow velocity in the atmospheric pressure was approximately 2 m.s-1. The channel configuration was used to guide the fog flow and eliminate complications resulting from evaporation/condensation
26
,
30
. Experiments were conducted at the temperature of 20.0 ± 0.5°C and the relative humidity of RH = 75%. It should be noted that the effects of some parameters such as temperature, surface tension and cross-section shape of fibers on the collection efficiency were neglected in the present work. To eliminate the effects of thermal changes, the surface temperature of all samples was kept at 20oC. All the fibers were smooth and untreated, as received. According to the results of 5 contact angles measurements and the statistical analyses, no significant difference was observed in the contact angles of water droplets on the surfaces of different fibers. Furthermore, all the woven, knitted, and spacer structures were prepared by smooth fibers or filaments with circular cross-sections. Experimental setup for measuring the fog capture efficiency.
In order to evaluate fog capture efficiency, the amount of collected water in the container and the remained water on the sample was measured every 1 min within an hour.
Fog collection efficiency is defined as the ratio of the water collection rate per unit area of the collector to the total liquid water flux of the fog. Fog water collection efficiency of a collector (
Numerical simulation
The experimental procedure described in the previous section provides criteria for evaluating fog capture efficiency and draining efficiency, ignoring aerodynamic collection efficiency. To evaluate the effects of the geometrical parameters of the woven meshes on virtually estimated aerodynamic collection efficiency and fog capture efficiency, an Eulerian–Lagrangian numerical method was applied.
Aerodynamic collection efficiency of a fog collector is influenced by pressure drop through the mesh (
Pressure gradient of a fibrous mesh is defined by Forchheimer equation (
Generally, with increasing the pressure drop due to the mesh resistance to flow, the wind flow carries most of the fog droplets around the collector and reduces the aerodynamic collection efficiency. Fog flow velocity and geometrical characteristics of the mesh are the most important parameters that influence the pressure drop. Therefore, herein, the effects of fiber diameter, shading coefficient and fog flow velocity on the pressure drop coefficient, and aerodynamic collection efficiency were virtually investigated, by numerical simulation. It should be noted that the simulated results of capture efficiencies could be compared and validated by the experimental results. Whereas, the aerodynamic collection efficiency cannot be measured from the explained experimental condition. Therefore, the reliability of numerical model for aerodynamic characteristics of collector mesh was investigated by comparing the results of simulation for air flow through the woven meshes with those calculated by equations from previous studies 38 , 51 .
Computational domain and mesh generation
Geometry of the plain-woven mesh based on the ideal Peirce’s model
53
was generated as shown in Figure 4. An example geometry of a plain-woven mesh and its unit cell.
The periodicity of the woven mesh structure made it possible to consider only a unit cell of the woven meshes in CFD calculations.50,54 Figure 5 (a) shows a unit cell of a woven mesh immersed in the flow region and the applied boundary conditions. Fog was assumed to flow into the computational domain with a constant velocity (inlet boundary condition) and leave it with a pressure of outlet boundary condition. The inlet and outlet boundary conditions were considered to be far from the mesh to ensure that the total flow is formed after the mesh. Our investigation demonstrated that placing the woven mesh unit cell satisfied the calculation accuracy at a distance of 3 (D-R) from the inlet and 7 (D-R) from the outlet (D is fiber spacing and R is fiber diameter). Symmetry boundary condition was imposed on the side faces of the computational domain. No-slip boundary condition was applied at the surface of fibers, because the relative velocity between fluid and surface is equal to zero and flows is in the continuum regime. The computational domain was meshed by ANSYS Meshing 15.1 for finite volume calculations. (a) An example geometry of computational domain and boundary conditions, (b) Grid arrangement in a section of computational domain.
Figure 5 (b) shows grid arrangement in a section of computational domain. To improve the accuracy of the results, tetrahedral elements were used and the computing elements near the surfaces of the fibers were refined.
To assure that the solutions are not dependent to the grid size, it is necessary to perform the grid independence studies for each sample. The number of grid points on the fibers was increased from 10 up to 50 and the elements growth rate was changed to increase the elements number. Our observations showed that the calculation results in all samples are grid independence when the number of grid points on the fiber perimeter is larger than 35 points and the growth rate is 1.1.
Flow field and droplet trajectory calculation
The Eulerian–Lagrangian method was applied to track fog droplet trajectory. In the Eulerian–Lagrangian method, Eulerian approach is used to simulate continues phase flow through the mesh, and then the discrete phase (fog droplet) is tracked by Lagrangian approach. The flow regime inside the collector was considered as a steady state laminar incompressible flow. The air flow field was obtained by solving the continuity and momentum conservation in the computational domain

After calculating the air flow properties in the computational domain, Lagrangian approach was used to determine the droplets trajectory and droplets velocity through the computational domain. The average size of fog droplets was assumed to be 3 μm. Therefore, the dominant capture mechanism is the inertial impaction and the most important forced exerted on the droplets is the drag force. In addition, fog droplets size is small enough to be assumed that they have spherical shape,
55
and droplet equation of motion is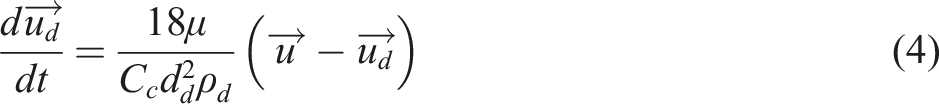
Fog water droplets have low settling velocities that are negligible in comparison with the wind speed. Therefore, droplets travel with the wind and the effect of gravity on the fog droplets are not significant. To calculate the fog capture efficiency, fog water droplets were injected uniformly into the continuous phase at the inlet of the computational domain and their initial velocity was set equal to the air flow velocity at the inlet. It is also assumed that, once the droplets collide with the fibers, they are removed from gas phase and immediately drained. Indeed, clogging of the mesh openings and re-entrainment of the collected droplets were neglected. Moreover, the fog was diluted enough to neglect the droplet-droplet interactions (volume fraction = 7×10⁻⁶).
Results and discussion
Although the most important factors that determine the collection efficiencies of the fog collecting meshes are shading coefficient, fiber spacing, and fiber fineness, the collection efficiencies of the knitted and spacer structures can also be dependent to the fiber arrangement and orientation. The fog collection behavior of knitted structures not only depends on conventional known geometrical parameters such as CPC, WPC, shape factor, loop length, and shading coefficient but also on the loop legs angle, loop head spacing, and loop feet spacing. These parameters can affect the size and form of the open spaces in the mesh structure, which influence the amount of the residual water on the mesh surface and the droplet capture efficiency. Changing the test direction and also the inter fiber angles can change amount of the capture droplets that hold on the mesh surface, the droplets path on the mesh surface toward the gutter and the fog collection efficiency of the collector mesh. Therefore, herein, 3 different types of meshes with different geometrical conditions were investigated. As the best fog collector should not only pose the highest collection efficiencies but also should pose the highest collection rates, first, the collection rates of the samples through both onset time and weight of the collected water/time were investigated. Then, the collection efficiencies of the different samples were investigated and compared. Since the test direction was meaningless for the woven structures due to their symmetric geometry, CFD simulations were also performed to find the optimum conditions of shading coefficient and fiber diameter of the woven samples.
Experimental results
Fog collection rate (onset time and weight of collected water/time)
Figure 6 represents the onset time measured for different samples. Onset time measured for different samples.
As can be seen, sample W2 provided the minimum onset time among woven samples. According to the results, the onset time in the woven samples depends on the fiber diameter, fiber spacing, and shading coefficient. Increasing the fiber diameter and decreasing the fiber spacing in a woven mesh structure results in an elongated onset time in the fog collection process. In woven structures with similar shading coefficient (W1: 30.5% and W2: 28.3%), the onset time decreases with decreasing the fiber diameter (W1: 500 μm and W2: 230 μm).
Unlike woven and knitted samples, the 3-D spacer samples exhibited a dual stage for onset time. The outer surface of the spacer mesh directly exposed to the fog flow (front layer) was saturated in a shorter time (first stage). However, the back layer of the spacer sample required an excessive onset time (second stage) due to the presence of the inner fibrous layers. Previously, Li et al. 42 reported similar trends for the front and back layers of the sandwiched nets. Herein, the results showed that the orientation and arrangement of monofilaments in the inner layer of 3-D spacer mesh strongly affects the total onset time. According to the results, the test direction of the knitted mesh has no significant effect on the onset time. This highlights the fact that the onset time in the knitted samples is independent to the test direction.
Figure 7 represents the changes of the weight of collected water with time (Collection rate) for different samples. In woven and knitted structures, the weight of the collected water reached the steady state after a short time (less than 5 min). However, in 3-D spacer structures, the time duration to reach the steady state is much longer than that of the knitted or woven structures. Unlike the linear behavior of the knitted or woven structures, some periodic changes were observed in the collection rate of the spacer structures (S2-0, S2-90, and S2-180). This is due to the fact that in S2 spacer structures, the critical volume of water (the maximum volume of water droplets before falling down) that was captured between the spacer monofilaments is higher than that of the other structures. Therefore, more time is needed for the water droplets to reach the critical volume and to be released from the S2 structures. The changes of the weight of collected water with time (Collection rate) for (a) woven samples, (b) knitted samples and (c) spacer samples.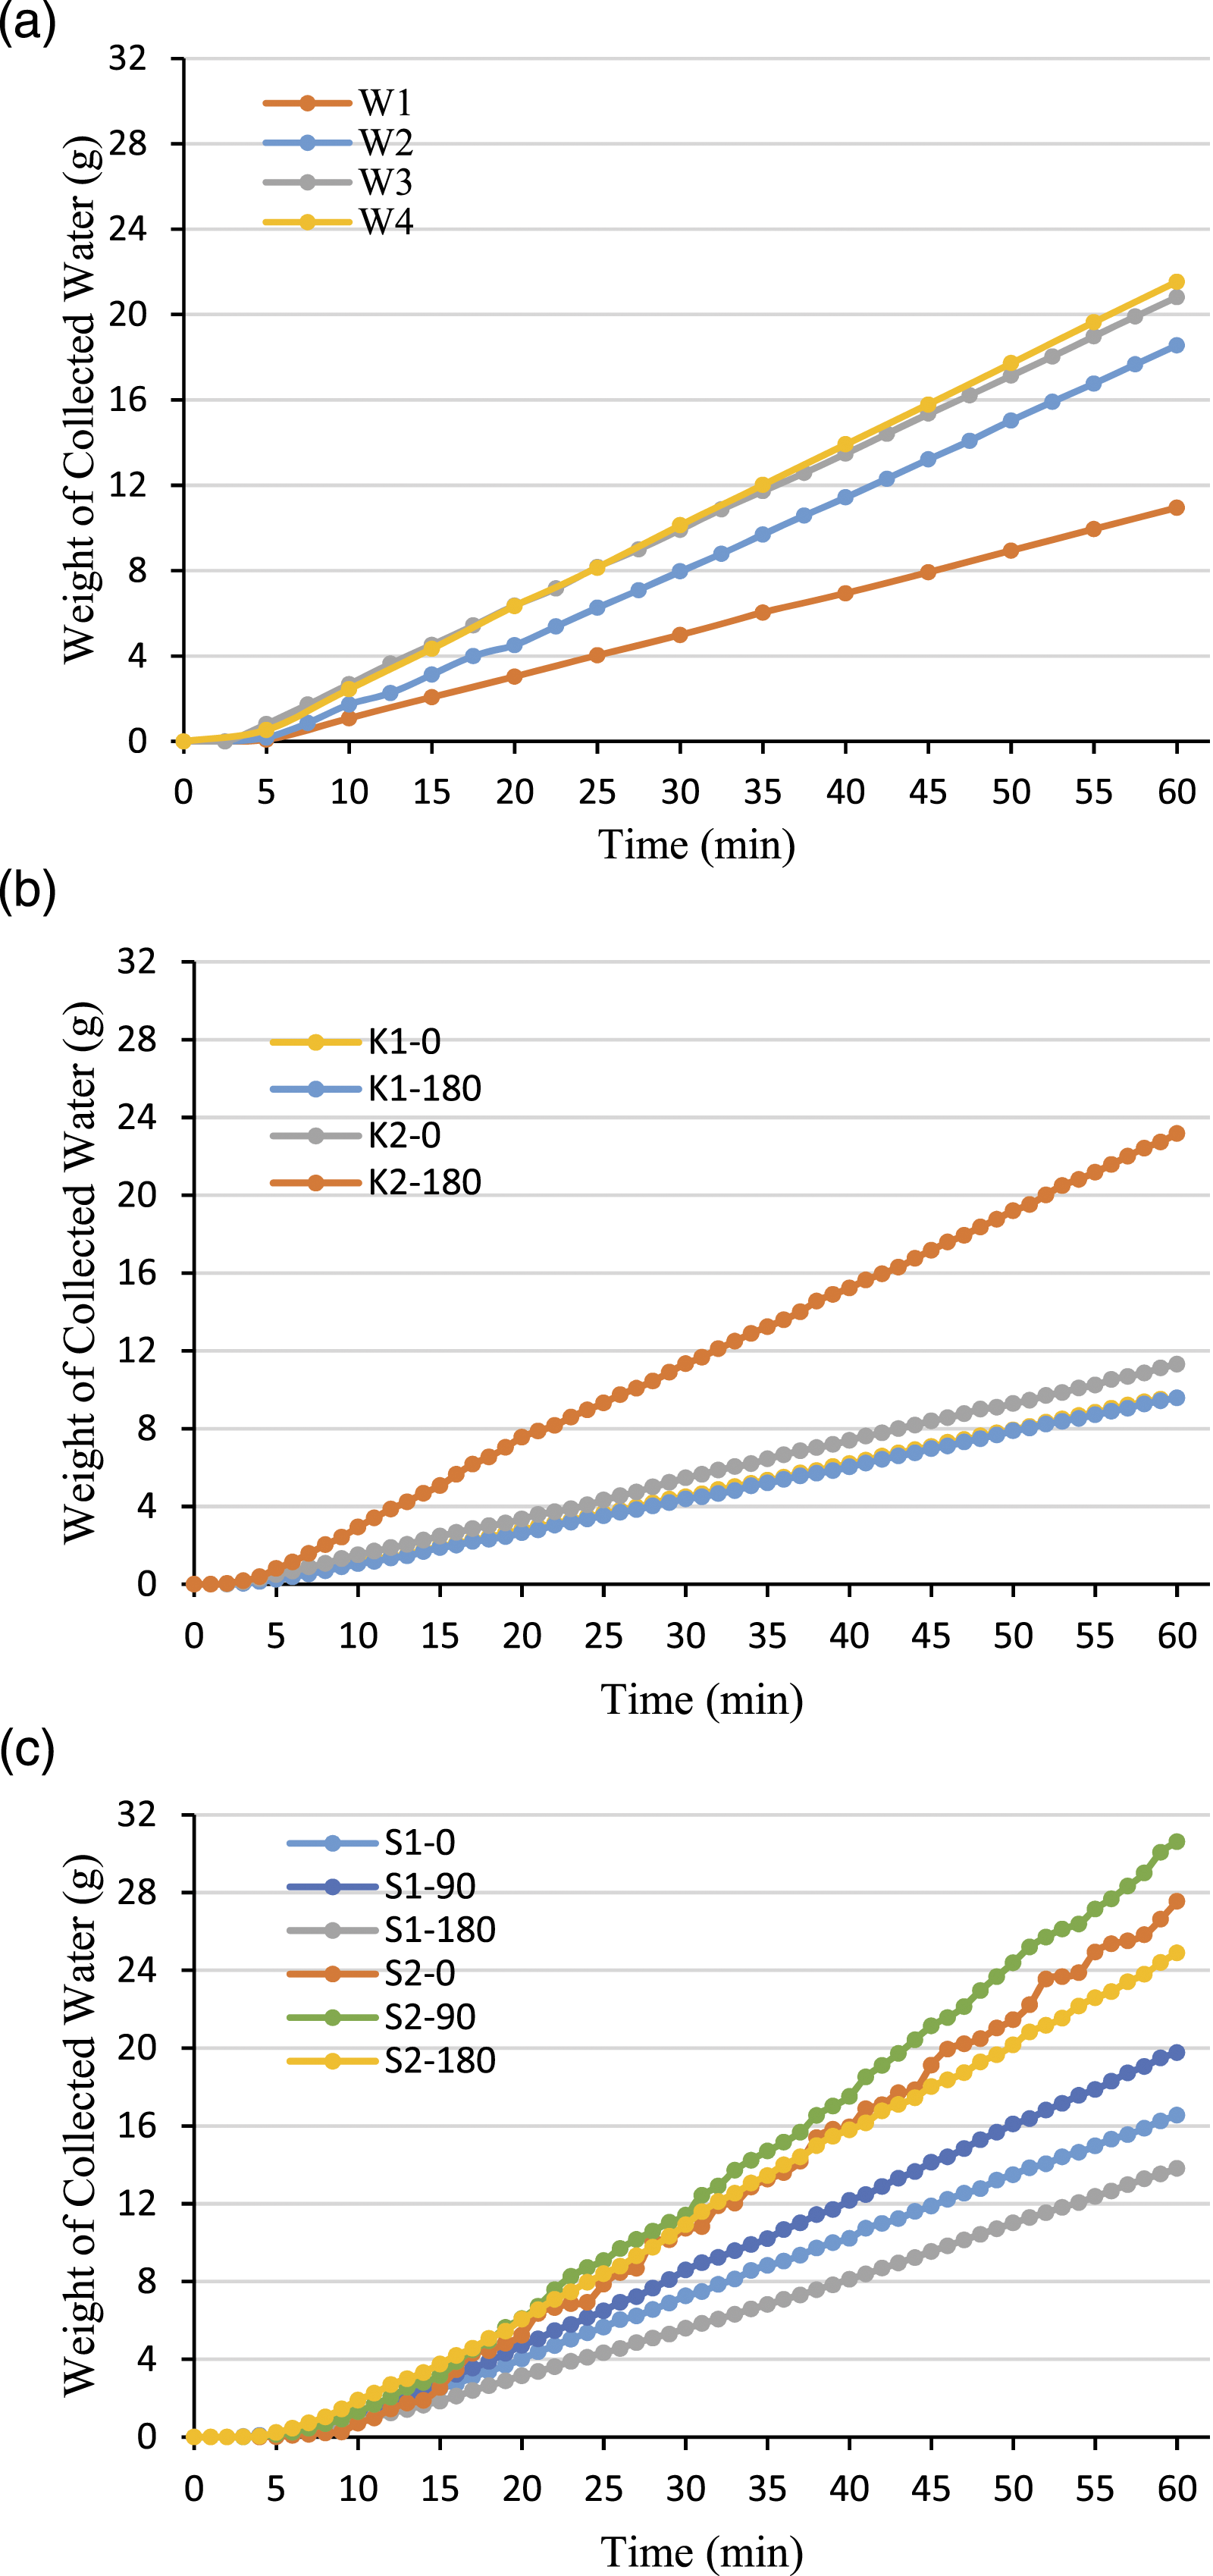
It is important to know that the weight of collected water and onset time are both important and should be considered together when comparing the fog collector performance. As can be seen, despite the high amounts of collected water in 3-D spacer structures, the long onset time restricts the practical application of them which was also reported by previous researchers. 56 One reason may be the type of material which was used in the spacer samples (polyester multi/mono/multifilament) that differ from the type of material used in the woven and knitted meshes (stainless-steel monofilaments). From the geometrical point of view, the high collection rate and almost low onset time in sample S2-90 suggests that 3-D structures with modified fiber arrangement are capable to enhance the collector performance. Using 3-D woven structures as suggested by Li et al. 42 in the form of sandwiched nets together with engineered interlayer metallic fibers may be a good solution to enhance the collection rate with reduced onset time.
Collection efficiency
Figure 8 represents the results of fog collection efficiencies for different samples, respectively. The results of fog collection efficiencies of different samples.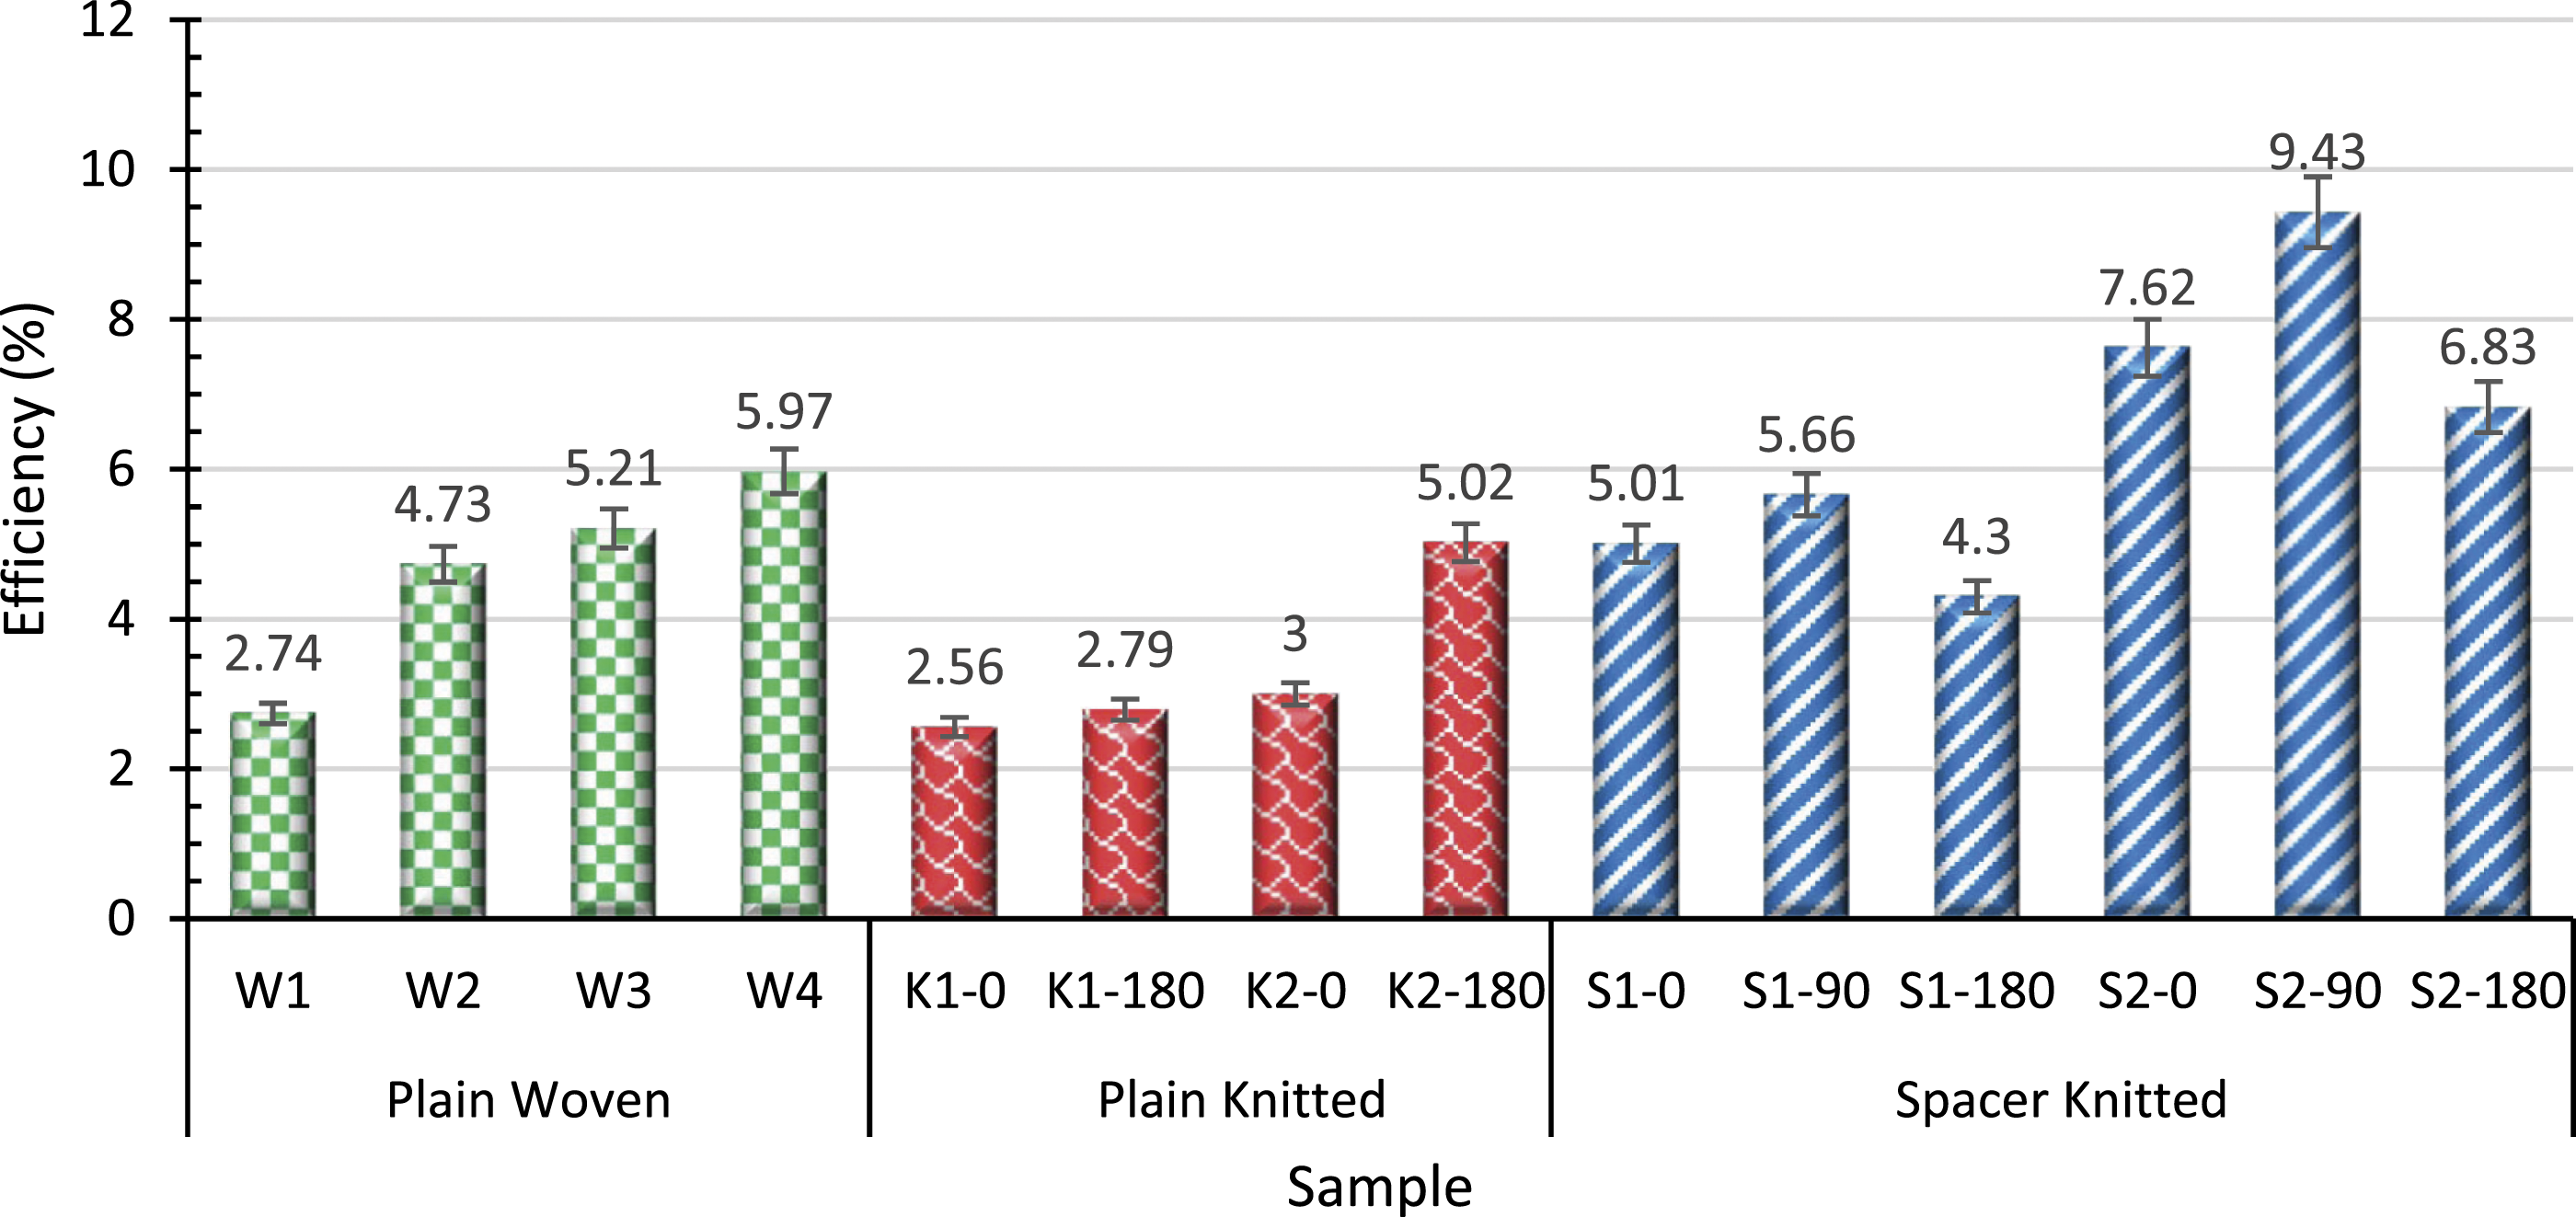
The woven samples (W1, W2, W3, and W4) differ in fiber diameter, fiber spacing, and shading coefficient but are the same in structure design. Comparing the sample W1 and W4, both having the same fiber diameter (500 μm), it can be concluded that the smaller spaces between fibers (higher shading coefficients) result in the higher fog collection efficiencies. Comparing the sample W2 and W4 with similar fiber spacing (1500 μm), the higher efficiency of sample W4 is attributed to the fineness of fibers. As the fiber diameter in sample W2 is less than that of W4, the higher shading coefficient of sample W4 is considered as the predominant factor that enhances the collection efficiency. Since the shading coefficient of sample W1 is almost equal to that of W2, the higher efficiency of sample W2 is attributed to both fiber diameter and fiber spacing. With reducing the fiber diameter and also the fiber spacing, water droplets can be exposed to more fibers and higher amounts of water can be collected. As can be seen in Figure 9(a), the clogging effects were negligible in the woven mesh structures. This can be attributed to the tendency of water droplets towards weft/warp intersection zones that pose convex surfaces. The difference between the surface tension of water/steel and water/air interfaces together with the convex shape of intersections and capillary regions between the crossed fibers can be considered as the responsible factors that hold water droplets on fiber intersections rather than voids. Similar observations can be found in previous studies
12
that have mentioned the wettability characteristic of the metal mesh as the responsible factor in clogging effects. The magnified images of (a) woven sample, (b) K2-0, and (c) K2-180.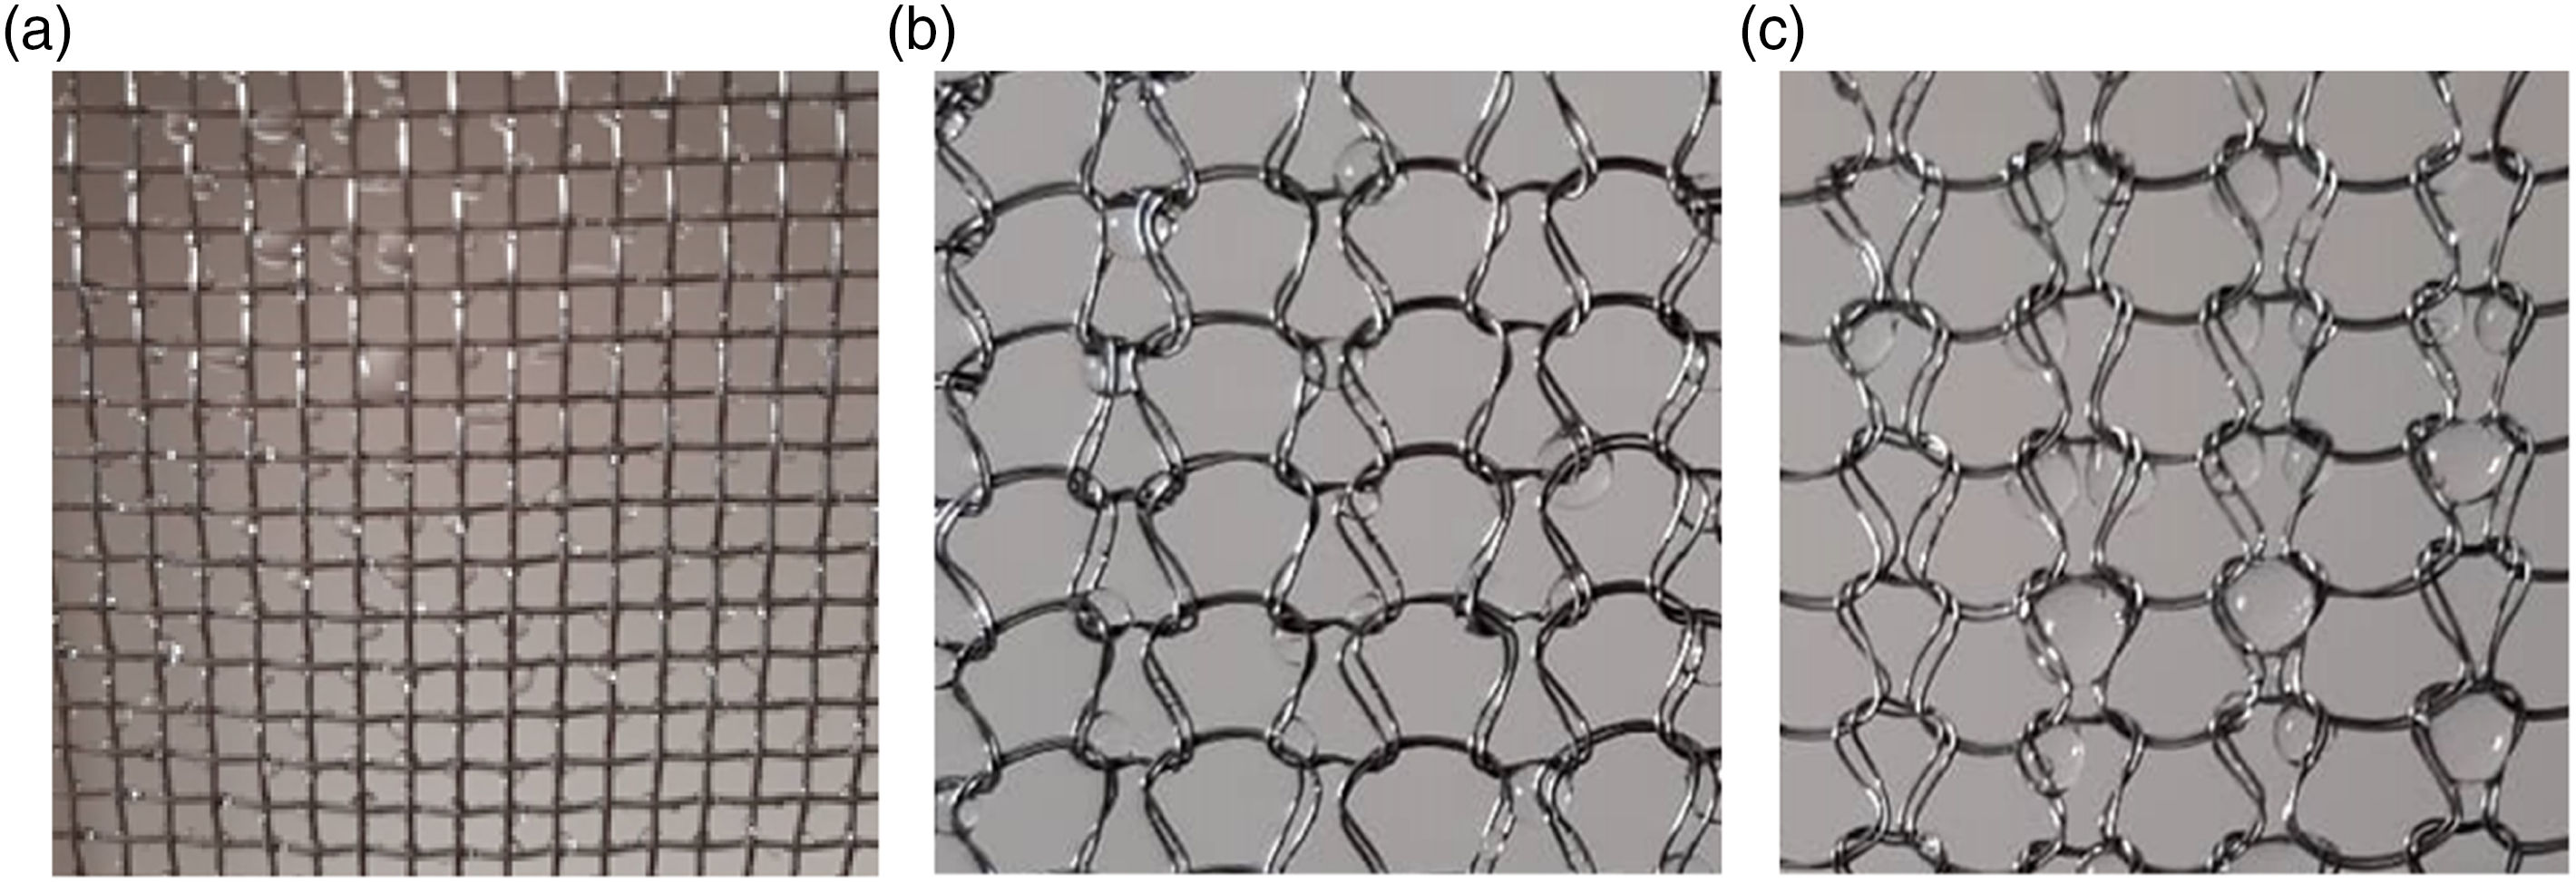
The low efficiencies of the knitted samples (K1-0, K1-180, K2-0, and K2-180) implies the poor fog collecting ability of the samples which is mainly due to their low shading coefficients. Comparing the woven sample W3 (fiber diameter = 400 μm) and the knitted samples (the total diameter of two fibers = 400 μm), the shading coefficients of the knitted samples (27 and 31%) were significantly less than that of the woven structure (49%). This can be attributed to the loop like structure of the knitted samples which provide larger fiber spacing that reduce the droplet capture efficiency. However, comparing W1 (shading coefficient = 30.5%) and k2-180 (shading coefficient = 31%), a significant improvement was observed in the fog capture efficiency of the knitted structure (5.02%) which was significantly higher than that of the woven structure (2.74%) with similar shading coefficient. This can be attributed to the specific geometry of the curved fibers in 180° rotated knitted structure. Therefore, optimization of fiber orientation and arrangement in a knitted structure can provide better collection efficiencies when compared to the woven structures with similar shading coefficient. Moreover, comparing sample K2-0 and K2-180 (and also K1-0 with K1-180) also indicates that the arrangement of loops (unit cell geometry) in the knitted samples is of great importance. In the other words, at a specific structure with a defined shading coefficient, the amount of residual water strongly depends on the loop arrangement. Sample K1 (i.e., K1-0 and K1-180) and Sample K2 (i.e., K2-0 and K2-180) were approximately similar in shading coefficient (SC = 1/L. N0.5; L = loop length and N = fiber fineness) and fiber diameter (200 μm), but differed in loop shape factor (CPC/WPC) and stitch density (CPC×WPC). The number of horizontal loops in 1 cm of sample K2 (CPC = 2) was more than those of sample K1 (CPC = 1.6) which affects the shape factor of loops. Therefore, sample K1 had elongated loops in vertical direction while sample K2 had wider loops in horizontal direction. Accumulation of droplets in sample K2 due to the small space between mesh courses provides higher collection efficiency when compared with K1. As shown in Figure 9 (b) and (c), comparing the magnified images of K2-0 and K2-180 reveals that in rotated samples (i.e., K2-180) unlike sample K2-0, the narrow loop feet are positioned upward. In the other hand, large loop heads positioned upward provide wider spaces against water droplets which intensifies the possibility of coalescing adjacent droplets and intensifies clogging effects. As mentioned by, 57 the maximum volume of droplets deposited on fibers can be influenced by the angle of fibers. Herein, the bent fibers in the loop structures can be assumed to provide the mentioned angle. In K2-0, the loop feet and in K2-180, the loop heads are the main sites for clogging effects. According to the results, the collection efficiency of K2-180 is higher than that of K2-0. Similar result was also previously reported by Park et al. 57 that clogged water bridges in mesh holes can increase fog harvesting by increasing the effective shading coefficient.
Therefore, it can be concluded that the fog collection efficiency of a knitted structure is not only affected by cover factor of the mesh and fiber diameter but also by loop shape factor, stitch density, and loop arrangement.
The collection efficiencies in spacer sample S2 in all three directions were higher than those in sample S1. The main reasons nominated for increased efficiencies in sample S2 could be the higher number of hexagonal shapes, higher densities of spacer fibers, and existence of the intersected spacer fibers. All these factors could be responsible for increasing the effective surface of the mesh against water droplets. Therefore, the high specific surface area in the 3-D spacer structures provided an enhanced collection efficiency in compare to 2-D woven or knitted structures. Unlike the knitted samples, the efficiencies of spacer samples in the 180o rotated postures are slightly less than those in zero rotation conditions. This is due to the fact that the spacer fibers in zero condition could withstand more water droplets resulting to higher local clogging effects. These clogged spaces can serve as an occluding surface against the newly arrived droplets. According to the results, the highest fog collection efficiency belongs to S2-90. One reason may be that in the spacer samples with 90o rotated postures, the coalescing effects of the adjacent droplets in adjacent spacer fibers also occur and enhance the effective shading coefficient against water droplets. Therefore, higher amounts of water can be entrapped on the spacer fibers having specific arrangements which enhance the collection efficiency.
Simulation Results
Effects of mesh geometrical parameters on virtually estimated aerodynamic efficiency
As described in previous works, aerodynamic collection efficiency of the fog collectors is affected by the pressure drop through the mesh. The numerical simulation was employed to obtain correlation between the pressure gradient and the air flow velocity through the fog collectors in meshes with different opening area. The associated relation for each mesh was obtained by fitting a second-order polynomial curve to the results as shown in Figure 10. All the simulation results clearly show a high second-order correlation (R=0.998) between upstream air velocity and pressure drop gradient across the mesh. The pressure gradient increases with air flow velocity. Effect of mesh opening area on pressure drop gradient at different air velocities.
Linear and quadratic coefficients of the second-order polynomial curves was used to define the Forchheimer equation for each mesh opening area. As Figure 10 shows, both of these coefficients are increased with decreasing mesh opening area, but the increase of the quadratic coefficient is less than the linear coefficient. Decreasing mesh opening area (from ε=0.64 to ε=0.25) intensifies the increase of the pressure drop gradient with upstream air velocity. This is due to the fact that the viscous resistance force become more significant and the pore inertial effects become less significant, and hence, the increase of linear coefficient is more than quadratic coefficients.
Using the linear and quadratic coefficients of the polynomial curves and Forchheimer equation, values of the mesh permeability parameter, K, and inertial factor, Y, were determined for three different opening area of the mesh and an expression similar to the empirical Equation (K = CK1 εCK2, and Y = CY1εCY2). Also, values of empirical coefficients were equal to C
K1
=1×10
−8
, C
K2
=2.87, C
Y1
=81.3×10
−2
and C
Y2
=1.25. However, these constants are different from the findings of the previous studies.51,52 This is due to the fact that Miguel
51
and Valera et al.
52
obtained permeability and inertial factor correlations by fitting curves into the experimental data points for different mesh geometries and air flow velocity range. Figure 11 (a) and (b) show the comparison between the simulation results and the results of the cited literatures51, 52 for mesh permeability and inertial factor.
The simulation results and previous findings pose the same trend. In the opening area of 0.45, the simulation results is approximately the same as Miguel 51 ’s findings.
Pressure drop coefficient, C
p
, describes the flow resistance through a mesh and depends on the geometrical characteristics of the mesh. Figure 12 represents the simulated value of h(SC) against the value of C
p
at different fiber diameters. A linear correlation between C
p
and h(SC) (R>0.99) was obtained for each set of fiber diameter. The difference in the linear regression slopes means that the fiber diameters have significant effect on C
p
and fibers with smaller diameters have greater values of C
p
. Correlation curves of the pressure drop coefficient as a function of the mesh cover factor h(SC).
The dependence of the pressure drop coefficient on wetted perimeter function g(p
w
) was investigated by conducting a series of simulations for velocity 2 m s−1. As shown in Figure 13, the simulation results confirm that the relation based on wetted perimeter function g(p
w
)
49
gives very good correlation with C
p
, and the following expression was obtained for wetted perimeter function Correlation curves of the pressure drop coefficient as a function of the mesh cover factor and wetted perimeter h(SC)g(pw) (y = 0.0669x + 0.4198, R2 = 0.9991).

However, the constant parameter in the equation (5) is slightly different from that was obtained by Castellano et al. 49 This can be attributed to the fact that the velocity range and Reynolds number in calculating equation (5) are less than Castellano et al. 49 experiments.

Virtually estimated aerodynamic efficiencies of woven samples.

Comparison of simulation and experimental results of fog capture efficiency
The plain-woven meshes made from stainless-steel fibers were used to investigate the droplet capture efficiency and verify the reliability of the simulation results. Figure 14 shows the comparisons between the simulation and experimental results for droplet capture efficiency of the woven samples. Although a slight difference is observed, there is a good correlation (y=0.9136x, R2 = 0.9973) between the numerical simulation results and the experimental data. Comparisons between measured and calculated values for droplets capture efficiency (y = 0.9136x, R2 = 0.9973).
The most important reasons for this discrepancy are the decrease in injected droplet concentration and the local clogging phenomena. About 5% of produced droplets’ weight evaporates to saturate the air flow through the inner cylinder of the experimental set. On the other hand, when droplets impact to the surface of the fibers, they will not leave the mesh immediately, they merge and cover a part of the collector open area. Although this phenomenon makes a mesh less permeable and decreases the aerodynamic efficiency, it increases the fog capture efficiency. It should be noted that the above simulation results are valid in the condition of the present work, assuming that aerodynamic efficiency and clogging effects are negligible.
Parameters affecting fog capture efficiency
Since the droplets are captured as collide with the fiber surface, fog capture efficiency, η
cap
, can be estimated by calculating the proportion of the number of droplets removed by the collector, N
R
, to the total number of droplets entering the domain, N
T

Figure 15 (a) shows the influence of the shading coefficient on the fog capture efficiency at different air velocities. These simulation results were obtained for meshes with the same fiber diameter of 100 μm. According to the results, increasing the shading coefficient significantly improves the capture efficiency. The effect of the fiber diameter on the capture efficiency at different values of shading coefficients is displayed in Figure 15 (b). The droplet capture efficiency increased with decreasing the fiber diameter. a) Effect of shading coefficient on the fog capture efficiency at different air flow velocities, b) Influence of the fiber diameter on the fog capture efficiency at different shading coefficients.
The optimal shading coefficient of woven meshes
Assuming that the droplets will be captured once collide with fibers surface, drainage efficiency is ηdra=1 and collection efficiency (Equation (1)) changes to
Aerodynamic collection efficiency of fog collectors at different values of cover factor was virtually estimated from the equation proposed by Rivera 38 . The drag coefficient CD was chosen based on the large fog collectors dimensions (4 m height × 10 m length) for a rectangular plate with aspect ratio 2.5. 58 These results were calculated for droplet diameter of 3 μm and air flow velocity 2 m s-1 at different fiber diameter. Pressure drop coefficients were obtained from simulation data.
Figure 16 (a) shows the virtually estimated aerodynamic collection efficiency as a function of shading coefficient at different fiber diameter. This figure indicates that the maximum value of virtually estimated aerodynamic collection efficiency is obtained at the shading coefficient 0.546, similar to the results reported by Rivera
38
. According to Figure 16 (a), thicker fibers increase the virtually estimated aerodynamic efficiency while reducing the capture efficiency. Figure 16 (b) represents the effect of shading coefficient on the overall collection efficiency at different fiber diameters. (a) Influence of shading coefficient on virtually estimated aerodynamic collection efficiency at different fiber diameters (maximum at SC = 0.546), (b) Influence of shading coefficient on collection efficiency at different fiber diameters when ηdra=1 (maximum at SC = 0.72).
With increasing the shading coefficient, the overall fog collection efficiency increased to a maximum value and then decreased. The results show that in a constant shading coefficient, the fibers with smaller diameters provide higher overall collection efficiencies. There is an optimum shading coefficient of 0.72 that provides the maximum overall collection efficiency.
Conclusions
In this study, the onset time, droplet collection rate and collection efficiencies of various conventional structures (plain-woven, plain-knitted, and 3-D spacer) with different characteristics (fiber diameter, fiber spacing, fiber arrangement, shading coefficient, and test direction) were investigated using a custom-made fog collecting device. CFD simulation was conducted to study the influence of geometrical parameters of the plain-woven mesh, such as fiber diameter, fiber spacing, and shading coefficient on fog collection efficiency. The proposed CFD simulation approach can be used to virtually calculate the aerodynamic collection efficiency and droplet capture efficiency. • Increasing the fiber diameter and decreasing the fiber spacing in a woven mesh structure results in an elongated onset time in the fog collection process. In woven samples with constant shading coefficient, the onset time decreases with decreasing the fiber diameter. • The 3-D spacer samples exhibited a dual stage for onset time. The outer surface of the spacer mesh that directly exposed to the fog flow (front layer) exhibited a short onset time (first stage). The back layer of the spacer sample required an elongated onset time to be fully saturated (second stage) due to the presence of the inner monofilaments. • In woven and knitted structures, the weight of the collected water after a short time (less than 5 min) reached to the steady state. In 3-D spacer structures, the time duration to reach the steady state is much longer than that of the knitted or woven structures. • Unlike the linear behavior of the knitted or woven structures, some periodic changes were observed in the collection rate of the spacer structures due to the high critical volume of water captured between the spacer monofilaments. • The fog collection efficiency of a knitted structure is not only affected by cover factor of the mesh and fiber diameter but also by loop shape factor, stitch density, and loop arrangement. • From the geometrical point of view, the high collection rate and almost low onset time in 90° rotated spacer structure with intersected fibers suggests that 3-D structures with modified fiber arrangement are capable to enhance the collector performance. • In the spacer fabrics, the position and arrangement of the spacer fibers posed considerable effects on the collection efficiency. When the 3-D structures with intersected spacer fibers were used perpendicular to the knitting direction, the highest collection efficiencies were obtained which was 3.5 times higher than efficiency of woven meshes. • The simulation results revealed that in the woven structure, the optimal shading coefficient of 0.72 with the fiber diameter of 100 μm maximize the overall fog collection efficiency when drainage efficiency is 100%. • Also, the simulation results showed that there was a correlation between the air flow velocity and the pressure drop gradient according to the Forchheimer equation (R=0.998). • The pressure gradient increases with increasing the shading coefficient and also depends on the wetted perimeter of the mesh unit cell.
The authors strongly suggest conducting fog collection tests in other conditions with considering the effects of aerodynamic efficiencies in future works. Moreover, using 3-D woven structures in the form of sandwiched nets together with engineered interlayer metallic fibers is suggested to enhance the collection rate with reduced onset time.
Footnotes
Declaration of conflicting interests
The author(s) declared no potential conflicts of interest with respect to the research, authorship, and/or publication of this article.
Funding
The author(s) received no financial support for the research, authorship, and/or publication of this article.