
Abstract
Fast and facile one-step preparation of paraffin/polyacrylonitrile hybrid nanofibers via single needle (uniaxial) electrospinning system was studied. As-spun paraffin/polyacrylonitrile nanofibers were used for thermal hysteresis enhancement of paraffin actuators. Solid paraffin with the melting point of 32, 58, 89 and 114°C were employed for the preparation of the paraffin/polyacrylonitrile nanofibers. Differential scanning calorimetry measurements revealed that the melting point of the paraffin in paraffin/polyacrylonitrile hybrid nanofiber was clearly detectable and the melting entalpy coming from the paraffin part gradually increased from 9.6 to 101.5 J/g with the increase in the melting points of the added same amount of paraffins in paraffin/polyacrylonitrile nanofibers. When both calorimetric and weight loss measurements were considered, the paraffin which has the melting point of 32°C was found to be suitable to produce hybrid nanofibers paraffin actuator. Therefore, this hybrid nanofiber was selected for the application in paraffin actuators for e-vehicle battery cooling systems where the battery temperature must be kept between 15 and 35°C. Paraffin compound of the paraffin actuators was prepared with a mixture of pure paraffin and paraffin/polyacrylonitrile nanofiber with the wt.% of 2.5, 5, 7.5 and 10. In the hysteresis measurements, the hysteresis value at 3 mm stroke was successfully enhanced as 1.7, 3.4, 11.9 and 15.3% sequentially for the samples produced with the above ratios. Beyond hysteresis enhancement, the phenomena of thermal percolation threshold effect and thermal conductivity contrast ratio effect in nano scale were emprically exposed on opening and closing behavior of the paraffin actuator.
Introduction
Paraffins are widely used as thermal regulating materials because of its exclusive properties including diverse melting temperatures, chemically inert and stable behaviors [1]. On the other hand, because of its low thermal conductivity [2], some research works have focused on to enhance the thermal conductivity of paraffin by combining it with other materials [3,4]. Thermal hysteresis enhancement of paraffin is an important subject especially for the thermal management applications from cooling systems of internal combustion engines till battery cooling systems of e-vehicles in automotive industry [5]. Thermal management of lithium-ion battery of an e-vehicle recommends on supplying the desired stable battery operating temperature as quickly as possible. Temperature dependent performance of lithium-ion batteries enforces new challenges in thermal management systems. Battery temperature must be limited between 15–35°C for the optimal operating and life cycle conditions where lower and higher temperatures will cause performance losses and shorter battery life [6]. A precision thermal management for lithium-ion batteries is an indispensable subject of thermal hysteresis capability of the paraffin actuator when it is selected for the battery thermal management system of the e-vehicle.
The enhancement of thermal properties of paraffin (n-Eicosane-based) composite was reported by Fang et al. with the addition of graphene nanoplatelets and 400% enhancement of thermal conductivity at 10°C was obtained [7]. Warzhoa et al. studied on temperature-dependent thermal properties of graphite nanofibers embedded in paraffin, and showed that thermal conductivity was enhanced with the addition of graphite nanofibers [8]. Fliescher et al. studied on paraffin/graphite nanofiber composites for thermal conductivity improvement of paraffins. The improvement of the thermal performance of paraffin with the addition of high thermal conductivity graphite nanofibers was achieved [9]. Thermal conductivity enhancement of paraffin was also improved by dispersing carbon nanofibers in it [10]. Chaichan presented his attempt on enhancing thermal conductivity of paraffin by the addition of Al2O3 and TiO2 and they achieved an improvement of up to 65% with Al2O3 and 45% for TiO2 added samples [3].
Leakage of paraffin causes a limited use for thermal applications such as heat storage, thermal regulating, and phase change material. In order to use paraffin with considering leakage, paraffins have been encapsulated into other materials for stable usage. Encapsulation of paraffin in cellulose nanofibers and the formation of stable thermal regulation nanocomposites were investigated by Li et al [11]. Paraffin was encapsulated by cellulose nanofiber through a pickering emulsion method, while simultaneously forming of composite material. The phase change material (PCM) composite showed a solid content of paraffin of more than 72 wt.%. Iqbal and Sun developed thermoregulating polypropylene fiber by incorporating microencapsulated paraffin and the produced monofilament showed 9.2 J/g of latent heat [12].
Encapsulation of paraffin in several polymers was achieved by producing core-sheath nanofiber via coaxial electrospinning technique. Paraffin core was encapsulated by poly-(methyl methacrylate) sheat to form nanofibers and production was carried out via coaxial electrospinning method by Lu et al. for heat storage applications. The nanofibers possessed 58.25 J/g latent heat, −56.49 J/g of solidifying enthalpy and even after 200 thermal cycles, they observed little change in latent heat [13]. In another study, fabrication of core/shell paraffin polymer nano-composite was investigated by Sun et al. [14] Paraffin/polyvinyl butyral nanofibers with hydrophobic polyvinyl butyral shell were successfully fabricated via coaxial electrospinning using ethanol as solvent. Effect of polymer concentration on morphology as well as encapsulation efficiency were investigated. The maximum encapsulation ratio of the paraffin/polymer nanofibers was reported as high as 46.4%, corresponding to maximum melting enthalpy and crystallization enthalpy values of paraffin/polymer nanofibers measured as 105.9 and 106.5 J/g respectively [14]. Cs0.32WO3 nanoparticles were also added into nanofibers, and the prepared smart textile structure possessed the latent heat of 60.31 J/g and after 500 heating cooling cycles the fibers still exhibited high latent heat with good stability [15]. Luminous thermoregulated smart textiles were produced by incorporating phosphor nanoparticles from the sheath layer into coaxial electrospun core-sheat paraffin-PAN nanofibers for thermal and luminescence regulation [16]. The structure exhibited 64.08 J/g entalphy and afterglow of the phosphor loaded structure continued during 60 min and the light appeared again after with the cyclic utilization [16].
Various researchers focused on the effect of thermostat performance with paraffin actuators on engine cooling systems where the circuit design and thermostat design are investigated [17–20]. The paraffin actuator for car thermostats are working particularly between 30 and 120°C. The working temperature range of e-vehicle battery cooling circuits is at around 30°C [6], the conventional internal combustion engine cooling circuits is at around 80°C [21] and also heated thermostat cooling circuits is around 120°C [22]. So, we have selected the melting temperature range of paraffins 32, 58, 89 and 114°C which are suitable for different kind of application in automotive engine cooling systems. We have investigated their thermal properties with and without nanofibers first, and spesifically selected 32°C sample for the observation of their applicability as the nanofiber assisted paraffin actuator for car thermostats.
In order to enhance the thermal conductive properties of paraffin actuators, conductive particles in nano and micro sizes such as copper powder are added in them. The very high metallic thermal conductivity of copper powder is not reflected directly to thermal properties of the paraffin actuators, because of the missing network which connects the conductive paths in the composite structure (percolation threshold) [23]. In our approach, the PAN nanofibers have built a continuous conductive path in the paraffin-PAN composite structure which improves the thermal behaviours. Another novelty of this study will be on the life cycle of the paraffin actuator system comparing conductive metal powder addition with nanofiber addition. During the melting and the solidification of the paraffin in the actuator, the metallic particles tends to precipitate down to the bottom of the actuator due to the high density difference between liquid paraffin and copper powder [2,24]. After a period of time the metallic particles separate themselves from the composite structure and a thin metal powder layer is formed at the bottom of the actuator where the down side has a thiny layer with very high metal particle amount and upper side has large layer without conductive additive, just pure paraffin. The thermal conductivity enhancement of the copper powder perishes due to precipitation in time [25]. In case of nanofiber application, the density difference is much lower than that of metallic powder, so that the precipitation of the nanofibers will take much longer time. Therefore, the thermal conductivity enhancement will remain a longer period of paraffin actuator life cycle.
In this study, one-step preparation of paraffin/polyacrylonitrile hybrid nanofiber for the use in paraffin actuators as the phase change material was performed and reported. In this regard, various paraffin types which have different melting point were combined into electrospinning solution to obtain paraffin/polyacrylonitrile hybrid nanofibers. Morphological, chemical and thermal properties of the as-spun hybrid nanofibers were investigated as well as their applicability paraffin/polyacrylonitrile in paraffin actuators. Solid paraffin/polyacrylonitrile (P/PAN) nanofibers were mostly produced by co-axial electrospinning process. As reviewed above, none of paraffin-polymer composite approaches exactly focused on the direct electrospinning of the paraffin-polyacrylonitrile with the aim of in situ nanoencapsulation of paraffin in polymer nanofibers for thermal property improvement. PAN nanofibers have been produced by single-needle electrospinning [26–28]. One-step preparation of solid paraffin/polyacrylonitrile (P/PAN) hybrid nanofibers via single-needle electrospinning process was investigated. Various types of paraffins with melting points of 32°C, 58°C, 89°C and 114°C were loaded to PAN nanofibers at room temperature via electrospinning. Solid paraffins were liquefied in PAN/DMF solution by simultaneous heating and magnetic stirring. Liquid paraffin was split into small particles by harsh stirring, and finally these particles were solidified in the solution. As prepared solution was electrospun into P/PAN nanofibers. Morphological, chemical and thermal properties of as-spun P/PAN nanofibers were presented and discussed. This research focuses on a simple facile production of electrospun paraffin/polyacrylonitrile hybrid nanofibers and investigates the thermal hysteresis enhancement of paraffin actuators for use in lithium ion battery cooling system on an e-vehicle.
Material and methods
Chemicals and equipments
Polyacrylonitrile (PAN, Mw of 150.000) and N,N-dimetilformamid (DMF) were supplied from Sigma Aldrich and used without any purification. The paraffins (P) were purchased from the International Group, Inc (Toronto, ON, Canada). New Era (NE-300) micropump was used as a solution feeding equipment. Gamma High Voltage Research D-ES 30PN/M692 power supply was employed as a voltage source for electrospinning process. Plastic medical syringe with needle gauge number 21 was used, and the needle of syringe was cut to set 1.5 cm before the usage.
Preparation of electrospinning P/PAN/DMF solutions and electrospinning of P/PAN hybrid nanofibers
Firstly, 8 wt.% of PAN in DMF was dissolved by magnetic stirring at an ambient condition in a glass vial. Preparation of PAN nanofiber by using electrospinning method has been investigated by several groups [29,30]. In this study, 6 ml of the prepared solutions were filled into the separate vials. The defined weight of solid paraffins were added into each vial. Two different sample groups were prepared. In the first group, the same amount of paraffins were added into the same amount of PAN/DMF solutions, and weight of paraffin and PAN were the same in the final solution. The labels of the selected paraffin types were P1, P2, P3 and P4 for the samples which had melting points of 32, 58, 89 and 114°C. Paraffin/polyacrylonitrile hybrid nanofibers were labeled as P/PAN (Ex: if P3 was used in P/PAN nanofibers, it was labeled as P3/PAN). In the second group, P3 was selected and different amount of paraffins were added into the same amount of PAN/DMF solutions. P/PAN weight ratios were adjusted as 15/100, 30/100 and 100/100 in the PAN/DMF solutions, and the samples are symbolized as P3/PAN-1, P3/PAN-2 and P3/PAN-3. All the vials were capped strongly. Then the vials were put on a magnetic stirrer and stirred by simultaneous heating. Each stage of the solution preparation was schematically shown in Figure 1. When the paraffins in the solutions were transformed to liquid state (stage 2), the solution was stirred harshly (at 500 rpm) to break liquid paraffin apart into small particles and the heater was turned off and stirring was continued until the temperature of the solutions reached to the ambient condition. When the temperature came to the ambient condition, small paraffin particles were obtained in the solution (stage 3). The prepared final solution was filled in the plastic syringes (21-gauge, needle length was 1, 5 cm) and electrospinning was performed and demonstrated as stage 4 in Figure 1. Electrospinning was carried out with 1 ml/h feeding rate and 17.5 kV applied voltage, and keeping the collector to tip of the needle distance as 15 cm. In order to eliminate clogging of the needle and unwanted spraying of the solution, tip of the needle was cleaned up with 5 minute intervals. The solution was ejected from the needle to the grounded collector, and finally P/PAN hybrid nanofibers were obtained on the collector in the mat form. DMF in the solution was evaporated during the nanofiber formation between tip of the needle and the collector.
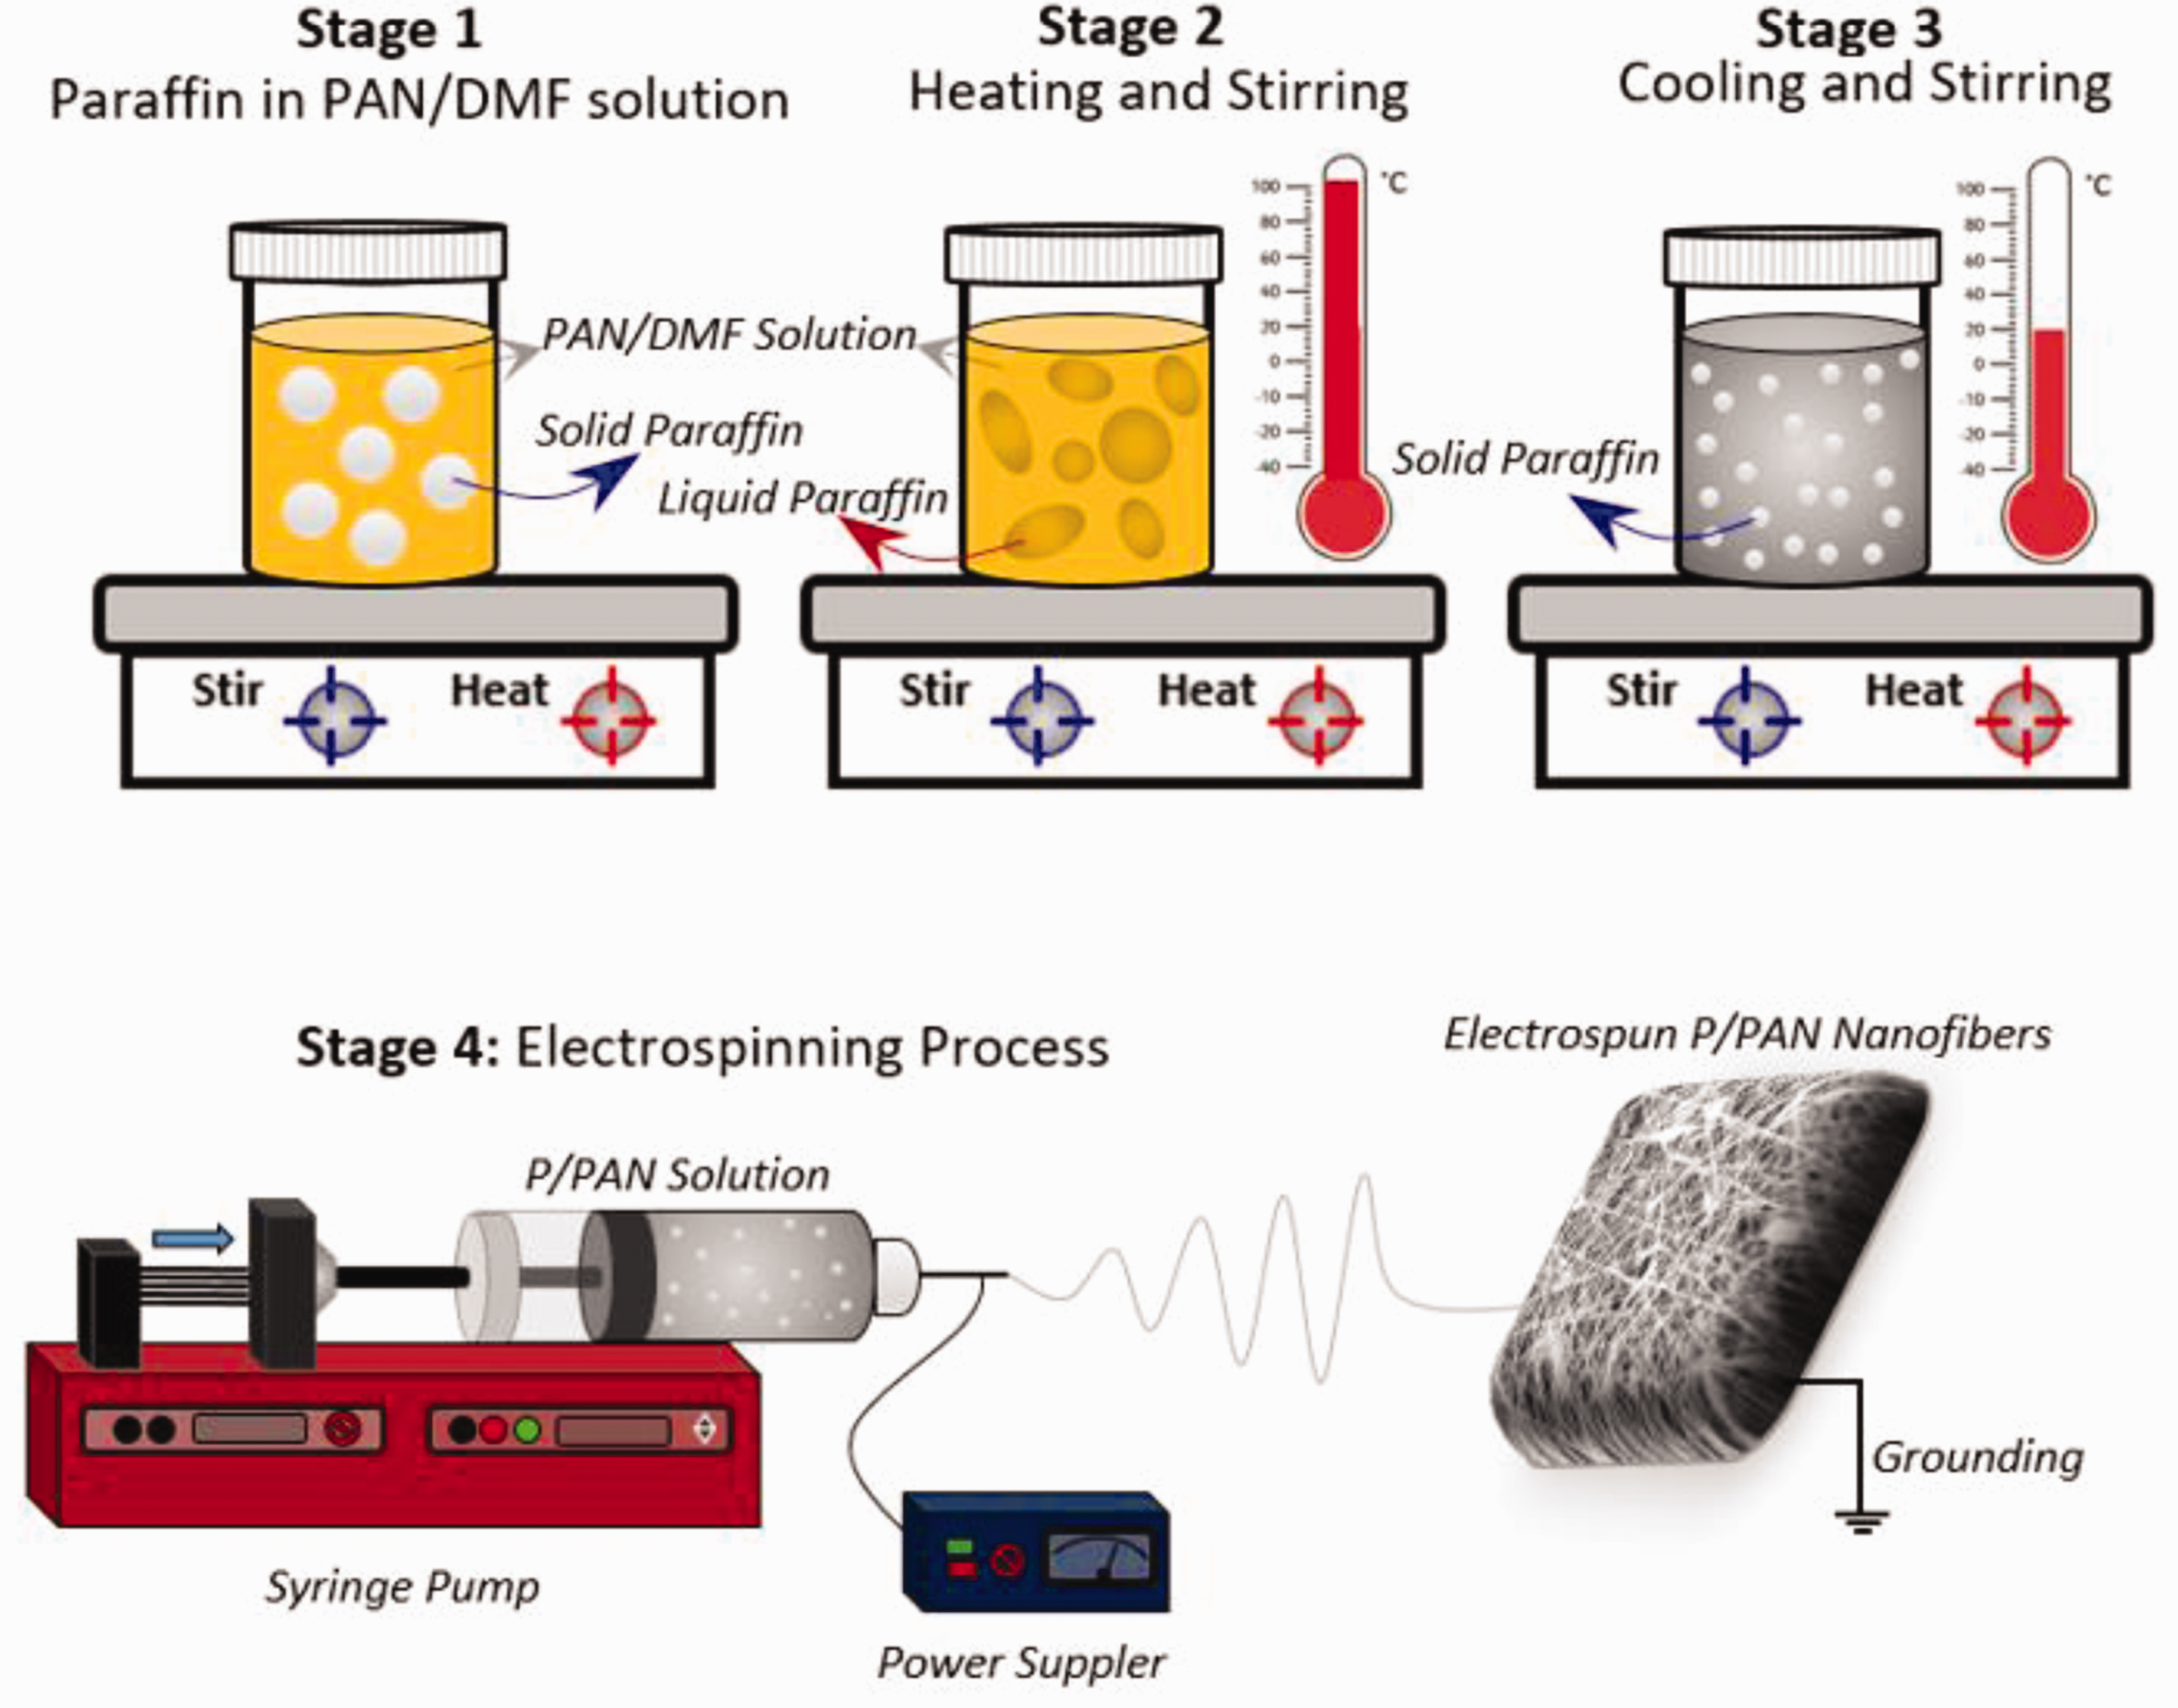
Schematic illustration of the one-step preperation of P/PAN solutions and nanofibers production via electrospinning process.

Steps of sample preparation from as-spun nanofibers for Paraffin Actuator testing and analysis.
Characterizations of P/PAN hybrid nanofiber
Morphological investigation of as-spun pure PAN and paraffin loaded P/PAN hybrid nanofibers was conducted with a ZEISS EVO 40 scanning electron microscopy (SEM). The samples were conductive coated with gold-palladium (60/40) about 30 sec for better imaging by using a Baltec sputter coater. Fiber diameter was measured by pixel processing based free, open source program, ImageJ program (The National Institutes of Health, USA). 100 nanofibers were measured in the SEM images. Fiber diameter distribution chart built as fiber diameter vs frequency in MS Excel. FTIR spectra was acquired with a FTIR spectrometer (Bruker Optics Tensor37, Ettlingen, Germany) equipped with ATR detector. The measurements were carried out between 4000 and 400 cm−1 wavelength with 4 cm−1 resolution. DSC tests were carried out with Differential Scanning Calorimetry Analyzer (TA Instruments/Discovery DSC251, New Castle, USA) using 10°C/min of heating rate from 0 to 400°C. TGA tests were conducted with a simultaneous thermogravimetric analyzer (Hitachi Hi-Tech STA7200, Tokyo, Japan) with 75 ml/min nitrogen flow and 10°C/min of heating rate from 30 to 600°C.
Sample preparation of paraffin actuator
Paraffin compounds were prepared from pure N-Eicosane (Melting point 32°C, P1) and N-Eicosane mixed with P1/PAN hybrid nanofiber 2.5%, 5%, 7.5%,10% by weight and named as S2, S3, S4 and S5. Table 1 shows detailed information for each prepared sample. A stepwise visual demonstration of sample preparation and hysteresis testing of the paraffin actuator is shown in Figure 2.
Paraffin actuator samples: P1/PAN hybrid nanofiber composition.

Note: Paraffin compound total weight for each sample is 440 mg.

SEM images of P/PAN hybrid nanofibers (depending on paraffin rate): (a) Just PAN, (b) P3/PAN-1, (c) P3/PAN-2, and (d) P3/PAN-3.
Working principle of paraffin actuator
Volume expansion of paraffin is observed during phase change from solid phase to liquid phase [31]. A paraffin actuator consists of a sealed stainless steel capsule (4), stainless steel cover (2), stainless steel piston (1) elastomeric diaphragm sealing (3) and paraffin compound (5) as shown Figure 3(a). The paraffin compound sealed inside the capsule which avoids the leakage of the paraffin to the outside of the capsule during melting/expansion. When the temperature of the medium outside the capsule rises and exceeds the melting point of the paraffin compound of the actuator, the paraffin compound expands and presses against the diaphragm sealing. The movement is transferred to the piston. The cover part guides the movement of the piston into the vertical direction and keeps the diaphragm sealing in upright position. Counter spring pushes the piston back inside the diaphragm sealing if the medium temperature decreases down under the melting point where the paraffin compound shrinks. Volume change of the paraffin compound is converted to displacement of the piston where the opening stroke of the paraffin actuator is recorded by displacement sensor in millimeter. Principle of the thermal hysteresis has been explained in the Supporting data file.
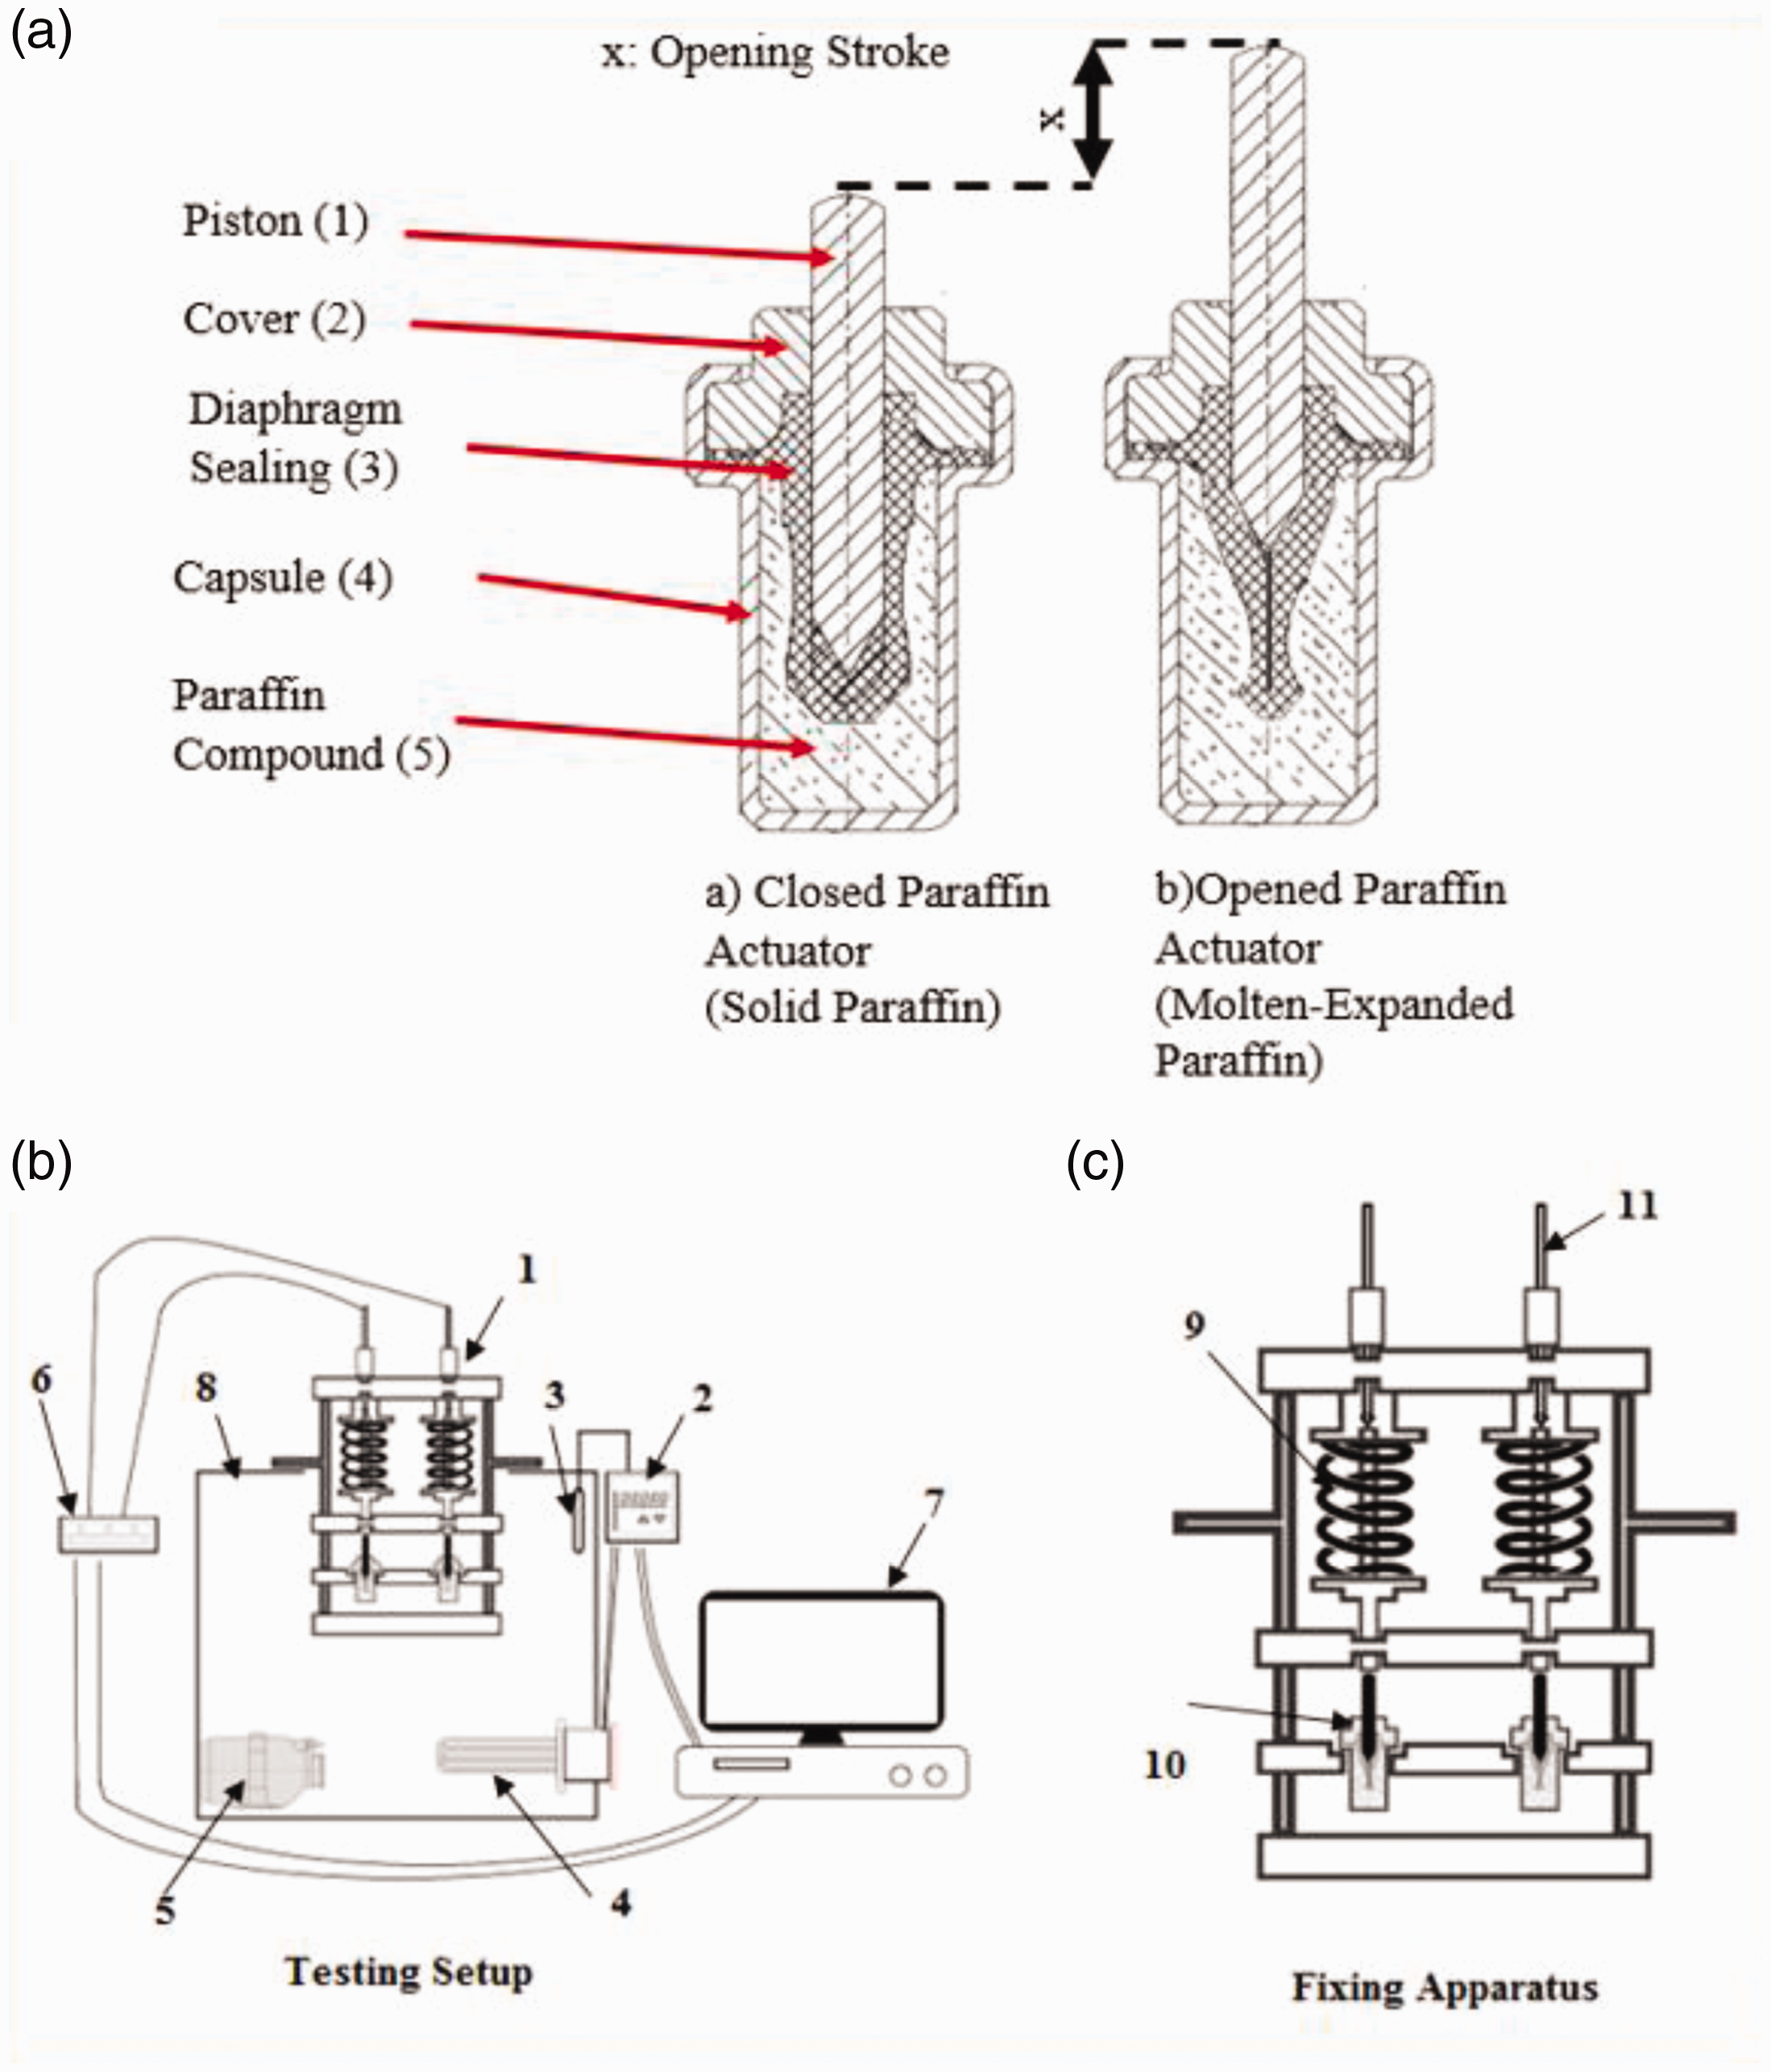
(a) Paraffin actuator subcomponents a) closed paraffin actuator before heating/displacement of piston b) opened paraffin actuator after heating/displacement of piston, x: displacement of the piston in mm; (b, c) Hysteresis Testing Setup and Fixing Apparatus.
Testing setup for thermal hysteresis
Testing setup consists of paraffin actuator (10), compression spring (9), displacement sensor (11), heated/circulated coolant bath (8), analog digital converter (6), electrical resistance heater (4), K-Type thermocouple (3), circulation pump (5), temperature programmer (2), computer (7) and fixing apparatus (1) as shown in Figure 3(b) and (c). In testing setup, the paraffin actuator is fixed in an apparatus and only the vertical movement of the piston is allowed. A spring is working against the piston with the initial force of 70 N and spring constant (k) of 7 N/mm to confine the piston movement during paraffin melting phase change and compressing it in to capsule during solidification. Circulated coolant media is flowing around the capsule for securing the dynamic temperature transfer from coolant to paraffin actuator simulating the coolant flow in the car cooling system. Temperature programmer gives the input for the heating and cooling temperature speed to operate the electrical resistance heater. K-Type thermocouple and displacement sensor record the temperature value and piston stroke simultaneously where the computer collects these data in a text file for later data processing.
Hysteresis measurements for thermostats are performed according to specifications of OEM automotive producers. Common specifications for hysteresis require 1°C/min heating up speed and 1°C/min cooling down speed for the paraffin actuator where the thermal bath temperature starts with 5°C before the first movement of the piston and heated until 15°C hereafter. The bath is cooled down with a speed of 1°C/min until the starting temperature (5°C before initial stroke of the piston). At the testing setup, all the affecting external factors are kept (spring force, heating-cooling speed, coolant media, circulation speed) constant and just the alterations of the paraffin compound in the paraffin actuator samples are investigated. Testing setup is programmed to record into a text file the data of the opening stroke amount of the paraffin actuator against temperature change and time interval during the heating and cooling process. A combined Time/Temperature/Opening curve is plotted from the recorded data into a Microsoft Excel file. Excel Scatter Chart is used to create the hysteresis curve where the opening stroke of the paraffin actuator is depicted according to heating and cooling cycle independent of time interval.
Results and discussions
Morphological observation of P/PAN nanofibers due to paraffin type and amount
Morphlogy analysis of as-spun paraffin loaded P/PAN nanofibers was carried out via electron microscopy imaging due to the both paraffin content (Figure 4) and type of the paraffin (Figure 5) at P/PAN nanofibers. As seen from Figure 4 (A1, A2, a), pure PAN nanofibers exhibited a random distribution in the mat, higly uniform nanofibers were obtained, just a few negligable bead defect structure was observed. Since some paraffin particles were stayed in the solution in suspension form, these particles mostly as sphere forms were directly ejected on the nanofibers and seen on the nanofibers mat surface at low magnificaiton SEM images as seen in Figure 4(B1) to (D1) comparing to low magnificaiton SEM image of pure PAN nanofibers in Figure 4(A1). On the other hand, also bead-on-a-string morphology defect structure was observed by the addition of paraffin in P/PAN nanofiber as seen from the inset Figures in Figure 4(B1) to (D1). The amount of bead-on-a-string morphology defect structure in the nanofiber mats increased by increasing paraffin ratio in electrospinning solution (inset Figures in Figure 4(B1) to (D1). Even though the electrospinning process was applied at the ambient condition and the paraffins in the solutions were in solid state, Figure 4(C3) revealed that some paraffin particles were melted during the electrosinning and solidified when they reached on the nanofiber surface, and these molted paraffin bonded the fibers by solidification. During the electrospinning process, some sparks can be seen because of high voltage electricity. These sparks may had melted some paraffin. Another reason for the formation of this structure may be that some parrafin particles melt during the sputter coating (during the SEM sample preperation) and then bonded to the fibers after solidification. Nanofiber diameters were measured from selected 100 nanofibers in SEM images and diameter distribution chart graphics were given in Figure 4(A3) to (D3) with average nanofiber diameters. As seen from the graphs, most of the pure PAN fibers have the diameters ranging between 300-500 nm. The diameter tendency shifted to lower values with the addition of paraffin, and nanofibers have the diameter range between 150-300, 150-300 and 100-250 nm for samples P3/PAN-1, P3/PAN-2 and P3/PAN-3 respectively. Average nanofiber diameter in PAN nanofibers mat was measured as 376 nm. Average nanofiber diameter decreased with the addition of paraffin into PAN nanofibers, and the counted average fiber diameters were 220, 241 and 214 nm for samples P3/PAN-1, P3/PAN-2 and P3/PAN-3 respectively.

SEM images of P/PAN hybrid nanofibers (depending on paraffin type): (a) P1/PAN, (b) P2/PAN, (c) P3/PAN and (d) P4/PAN.
SEM images of P/PAN nanofibers due to paraffin types were shown in Figure 5. Nanofiber diameter distribution chart graphics with the average nanofiber diameters of different paraffin type P/PAN nanofibers were demonstrated in Figure 5(A3) to (D3). As seen from the graphs, the fiber diameter distributions were various depending on paraffin type. Sphere type particles were observed on the surface of nanofibrous mat at all the sample types as seen from the low magnification SEM images in Figure 5(A1) to (D1). Some little beaded defect structures were also seen in all types of paraffin additions. Nanofibers have the diameter range mostly between 250-400, 250-400, 150-300 and 200-350 nm for samples P1/PAN, P2/PAN, P3/PAN and P4/PAN respectively. Average nanofiber diameter in PAN nanofibers mat was measured as 376 nm. Average nanofiber diameter decreased with the addition of paraffin into PAN nanofibers, and the counted average fiber diameters were 314, 311, 236 and 381 nm for samples P1/PAN, P2/PAN, P3/PAN and P4/PAN respectively.
Chemical analysis of P/PAN nanofibers due to paraffin type and amount
Chemical observation of pure PAN and P/PAN hybrid nanofiber structures were conducted via FTIR analysis to investigate if there was any chemical change in the nanofibers. Firstly, the chemical structure of the pure paraffins used in the study were observed as seen in Figure 6(a). The same amount of these paraffins were added in the same concentration of PAN/DMF solution. Effect of the amount of paraffin on P/PAN nanofibers were analysed and the results were shown in Figure 6(b). Nanofibers were produced by electrospinning and chemical analysis of P/PAN nanofibers depending on paraffin types were demostrated in Figure 6(c).

FTIR spectra of (a) pure paraffins (a) P1, (b) P2, (c) P3 and (d) P4; (b) P/PAN nanofibers with different paraffin concentration (a) just PAN, (b) P3/PAN-1, (c) P3/PAN-2 and (d) P3/PAN-3; and (c) P/PAN nanofibers with different paraffin types (a) just PAN, (b) P1/PAN, (c) P2/PAN, (d) P3/PAN and (e) P4/PAN.
As seen from Figure 6(a), the prominent paraffin peaks detected around 715–719 cm−1 were attributed to inplane vibration of CH2 groups [32,33]. The peaks between 729–731 cm−1 could be attributed to rocking absorbtion band of lineer aliphatic structure of paraffin [34]. The peak between 1452–1462 cm−1 corresponds to scissoring mode of CH2 groups [35], 1469–1471 cm−1 assigned to C–H bending vibration [32] and 2912–2914 cm−1 corresponds to CH2 asymmetric stretching [35]. The peak 2947 cm−1 is related to C–H stretching vibrations of CH3 groups [36], and the peak at 2955 cm−1 assigned to asymmetric stretching of CH3 groups [35]. Additionally, the symmetric carbon-hydrogen bending absorption of the CH3 groups are detected at 1371 cm−1 for P1 and 1377 cm−1 for P2 and P3 samples [34].
FTIR spectrum of pure PAN nanofibers were demostrated in Figures 6(b) and (c) as inset plots indicated by “a”. Prominent peaks for pure PAN nanofibers were detected at 1359, 1450, 1664, 2243 and 2939 cm−1. C-H wagging of methly groups was detected at 1359 cm−1 [37] and bending vibrations of methylene groups were observed at 1450 cm−1 [38]. The peak at 1664 cm−1 could be related to trapped residual non evaporeted DMF solvent [39]. Stretching vibration of C≡N nitrile functional group was observed at 2243 cm−1 [31,34]. C-H stretching vibration was seen at 2939 cm−1 [40].
As seen from Figure 6(c), when the FTIR spectra was inspected by the addition of different melting point paraffins to PAN nanofibers, the peak intensities at 2847 and 2912–2614 cm−1 were significanly increased with all types of paraffin additions to PAN nanofibers revealing the existence of parrafins in the structure. Intensities of these peaks were not proportionally changed by changing paraffin contents in P/PAN nanofibers (Figure 6(b)). This implied that either the paraffin content didn’t increase proportionally in P/PAN nanofibers or the distribution of the paraffin in the nanofibers or mat were not homogenious. Even though the paraffin content was increased proportionally in the electrospinning solution, since the final paraffin suspensions were not homegeniously distributed in the solution and there should had been some paraffin precipitation in the plastic syring during the electrospinning procces. The intensities of paraffin peals were not in a proportional orders due to their rate in P/PAN nanofibers. These positions of the corresponding peaks coming from PAN molecules in P/PAN nanofibers as in Figure 6(b) didn’t change significanltly comparing PAN nanofibers. This revealed that there was not a chemical interaction between PAN and paraffin molecules both at solution and nanofiber preperation processes. So, the phase transition property of paraffin could be very applicable for the cyclic usage.
Thermal analysis of P/PAN NFs due to paraffin amount and type
Differential scannig caloriemeter measurements were carried out to observe melting points (Tm) and entalpies of the pure paraffins (Figure 7(a)) and paraffin loaded P/PAN nanofibers (Figure 7(b) and (c)). Melting points, enthalpies, onset temperature and starting and ending temperatures of the melting peaks of all the samples were given in Supporting Table 1. The same plots for Figure 7(b) and (c) were given without sliding the plots along y axis in Supplemental Material as Supporting Figure 2 A and 2B. As seen from Figure 7(a), single melting peaks (Tm) were detected at 38.5, 89.9 and 114.7°C for the samples P1, P3 and P4. Sample P2 demonstrated two distinct melting peaks located at 58.6 and 69.5°C. They revealed that this sample could have contained two different crystalline structures. Since these two peaks are coalesced, both peaks were considered for the entalpy determination of the sample. Producing P/PAN nanofibers with different concentration of the same type of paraffin didn’t change the melting point of parraffin part in the nanofibers distinctively as demostrated in Figure 7(b) and Supporting Table 1. The positions of melting points of paraffins were shifted when they were loaded with different parrafin types and produced in the form of P/PAN nanofibers. The detected paraffin melting points in P/PAN nanofibers were 34.5, 88.3 and 110.7°C for P1/PAN, P3/PAN and P4/PAN samples respectively (Figure 7(c)). Melting points were shifted to 59.8 and 88.3°C for P2/PAN and P3/PAN sample as shown in Figure 7(c). As seen, melting points of paraffins decreased for P1, P3 and P4 samples when the paraffin was loaded to PAN nanofibers as in P1/PAN, P3/PAN and P4/PAN. Even though the first detected melting point of P2/PAN increased to 59.8°C, the second detected melting point decreased to 67.8°C.

DSC of neat paraffins and P/PAN nanofibers: (a) pure paraffins (a) P1, (b) P2, (c) P3 and (d) P4; (b) P/PAN nanofibers with different paraffin concentration (a) just PAN, (b) P3/PAN-1, (c) P3/PAN-2 and (d) P3/PAN-3; and (c) P/PAN nanofibers with different paraffin types (a) just PAN, (b) P1/PAN, (c) P2/PAN, (d) P3/PAN and (e) P4/PAN.
As seen from Figure 7(b) and (c) and Supporting Table 1, a strong exotermic peak was detected at 298.1°C for pure PAN nanofiber. This peak is related to complex chemical reaction (dehydrogenation, cyclization, and cross-linking) [41] taking place atPAN molecules in the nanofibers. The position of this peaks didn’t increase or decrease consistently with either paraffin type or with the amount of paraffin in P/PAN nanofibers (Figure 7(b)). But the intensity of the peak decreased with increasing melting point of added paraffin (Figure 7(c)). The reduction of the peak could be related to the stronger interaction of paraffin and PAN molecules compared to pure PAN nanofibers [42].
Melting enthalpy (ΔHm) of the pure parrafins obtained from the DSC plots were 231.1, 219.7, 242.0 and 233.9 J/g for P1, P2, P3 and P4 samples as demonstrated in Figure 7(a) and given in Supporting Table 1. The results showed that melting entalpy was not changed consistently due to increase of melting point of the paraffins (Figure 7(b) and Supporting Table 1). When the same amount of weight but different type of the paraffins were included in P/PAN nanofibers, melting enthalpy increased with increasing melting point of the paraffin (Figure 7(c) and Supporting Table 1). The measured enthalpies of paraffin parts in P/PAN nanofibers were 9.6, 51.9, 64.2 and 101.5 J/g for P1/PAN, P2/PAN, P3/PAN and P4/PAN samples (Figure 7(c) and Supporting Table 1). But melting enthalpy differences were not consistent at P/PAN nanofibers when changing the amount of paraffin addition in the electrospinning solution (Figure 7(b) and Supporting Table 1). Melting enthalpy of pure PAN nanofibers was measured as 298.1 J/g. The melting entalpy of PAN nanofibers was not consistently changed with the addition of paraffin type and rate.
Thermogravimetric analysis of P/PAN nanofibers due to paraffin type and amount
In order to observe the thermal stabilities and weight loss of pure paraffin, PAN and P/PAN nanofibers, TGA measurements at the temperature range between 30 and 600°C in nitrogen atmosphere were conducted. The results of TGA measurement were presented in Figure 8 and Supporting Table 2. Differential thermal analysis (DTA) and derivative thermogravimetric (DTG) plots of pure paraffins and P/PAN nanofibers due to paraffin types and rates were given in Supplemental Material as Supporting Figure 3 and 4, and Supporting Table 3. As shown in Figure 8(a), only one step weight loss was observed for all paraffin types and the weight loss was related to volatilization of paraffin [43].

Thermogravimetric analysis (TGA plots) of (a) pure paraffins (a) P1, (b) P2, (c) P3 and (d) P4; (b) P/PAN nanofibers with different paraffin concentration (a) just PAN, (b) P3/PAN-1, (c) P3/PAN-2 and (d) P3/PAN-3; and (c) P/PAN nanofibers with different paraffin types (a) just PAN, (b) P1/PAN, (c) P2/PAN, (d) P3/PAN and (e) P4/PAN.
Paraffin actuator hysteresis test results due to nanofiller content.

TGA results of pure PAN and P/PAN nanofibers were given in Figure 8(b) for different paraffin concentrations and in Figure 8(c) for different paraffin types. First weight loss mainly began around 100°C and made a plateau at around 134°C corresponding to water loss from the nanofibers. Since mostly PAN part held water molecules, the release of water was higher at pure PAN nanofibers comparing to P/PAN nanofibers as seen at inset in Figure 8(b) and (c). Release of excess DMF from the fibers started at the beginning of the test. Weight loss mostly took place between 295 and 471°C. The weight loss at PAN nanofibers could be related to chemical reactions taking place in PAN molecules and removal of volatilities from the system. Similar weight loss plot has been reported in the literature by conducting TGA examination of PAN nanofiber in the nitrogen environment [44,45].
As seen from TGA plots in Figure 8(b), weight losses mostly started earlier at P/PAN nanofibers especially when low melting point paraffins were loaded. This could be related to the evaporation of paraffins before the starting degradation temperature of PAN. The residual percentage of pure PAN nanofibers after TGA measurements at 600°C was 39.2 wt.%. Except the sample P4/PAN, the residuals of P/PAN nanofibers decreased comparing to pure PAN nanofiber sample. The residuals of the different type of paraffin loaded P/PAN samples after TGA measurements under nitrogen atmosphere were 38.7, 33.9, 26 and 39.5% respectively for P1/PAN, P2/PAN, P3/PAN and P4/PAN nanofiber samples. The residuals of the different amount of paraffin added P/PAN samples after TGA measurement were 36.9, 27.3 and 30.8% respectively for P3/PAN-1, P3/PAN-2 and P3/PAN-3 samples.
Effect of P/PAN hybrid nanofiber addition into paraffin compound on thermal hysteresis of the actuator
In this work, it was aimed to produce a paraffin-PAN hybrid nanocomposite which is compatible for simply mixing in paraffin compound of paraffin actuator by its nano-sized impregnated/encapsulated paraffin portion. Moreover, the PAN-nanofiber portion of the nanocomposite is meant to carry the thermal properties of PAN-nanofibers as a thermal network into paraffin actuator. The investigation started with P3 paraffin in different mixing proportions with PAN polymer. The goal was to ensure the best suitable mixing range of PAN and paraffin molecules. It was found experimentally that the best applicable proportion for mixing and electrospinning process was 50% PAN polymer and 50% paraffin for the hybrid nanofiber synthesis. Especially higher paraffin proportions were found to cause difficulties during electropinning. Further hybrid nanofibers with paraffins of different melting points were produced to confirm the compliance of this simple process for a wide range of paraffin types. Among these paraffin types, DSC results showed that P1/PAN hybrid nanofiber had literally lowest melting enthalpy in comparison with pure paraffin. This throughput indicated that the thermal behaviour of the P1/PAN nanocomposite inclined to thermal properties of PAN portion rather than paraffin portion of hybrid structure. In terms of melting enthalpy of DSC results the other samples (P2/PAN P3/PAN and P4/PAN) inclines to thermal properties of paraffin portion of nanocomposite. Under this circumstances we have incorporated P1/PAN hybrid nanofiber in paraffin actuator application whose melting temperature is truly suitable for thermal management of e-vehicle batteries cooling systems.
Hysteresis of the paraffin actuator was affected by adding nanofiller into paraffin compound as indicated in Figures 9 and 10. Hysteresis results according to samples were listed in the Table 2. Increase of the nanofiber amount in the paraffin compound improved the hysteresis in a direct proportional way. Figure 11(a) depicts the trend of hysteresis change according to nanofiber addition amount. The highest improvement of hysteresis was recorded at S5 with the 10% of P1/PAN hybrid nanofiber ratio by weight. Hysteresis enhancement up to 15.3% was achieved. In Figure 9 from A to J depicted temperature/stroke curves and temperature/stroke/time curves for all samples S1, S2, S3, S4 and S5 separately.

Temperature/Time/Stroke Curves and time independent Temperature/Stroke Curves for the samples a) and b) for S1, c) and d) for S2, e) and f) for S3, g) and h) for S4, i) and j) for S5.

Temperature vs Stroke curves of the samples S1, S2, S3, S4, and S5 on the same graph for the comparision.

a) Change in Hysteresis of acc. nanofiller rate by weight of 5 paraffin actuator samples, b) Change in full stroke at 45 °C nanofiller rate by weight for 5 paraffin actuator samples.
Thermal percolation threshold effect in the paraffin actuator
Addition of 2.5 and 5% nanofillers improved the hysteresis moderately up to 3.4% while the addition of 7.5 and 10% nanofillers indicated a jump up to 15,3% hysteresis improvement compared with pure paraffin. This jump demonstrated the thermal percolation threshold effect of the nanofibers in paraffin actuator. A substantially nanofiber network with highly inter fiber connections formed especially at the samples of S4 and S5 with nanofiber content of 7.5 and 10%. This feature complied with the findings of the investigation of Tian and Yang on Phonon Transport and Thermal Conductivity Percolation in Nanocomposites and can be explained as follows [23]. At the paraffin actuators S2 and S3 with low volumetric concentration of high thermal conductivity constituent, percolation network could not be formed and the thermal conductivity of the composites was effectively controlled by the low thermal conductivity constituents (hereby paraffin proportion) and phonon-interface scattering. When the volumetric concentration of high thermal conductivity constituents (hereby nanofiber proportion) is higher than the percolation threshold as seen at paraffin actuators S4 and S5, geometrically percolate channels for phonon transport is formed [23]. This structure allowed the paraffin actuator to achieve the hysteresis enhancement jump at sample S3 by 3.4%, at sample S5 by 11.9%.
Thermal conductivity contrast ratio effect in the paraffin actuator
In Figure 10 it can be seen that the opening curve of the 5 samples are very close to each other during the paraffin phase change from solid to liquid at heating cycle. Thermal conductivity of solid paraffin is higher than thermal conductivity of liquid paraffin. This trend proved the thesis of Mamunya et al that short of high thermal conductivity contrast ratio was postulated to be the main reason for the lack of the thermal conductivity percolation in composite materials [46]. The contrary closing curve of the 5 samples were dissociating from each other during cooling cycle where the liquid paraffin changed to solid phase. Thermal conductivity of n-Eicosane λ solid is slightly over 0.350 W/m K and λ liquid is close to 0.150 W/m K [47]. Literally, thermal conductivity contrast between nanofiller and n-Eicosane increased 2.33 times because of the thermal conductivity loss during phase change of paraffin compound. Samples of S4 and S5 with higher nanofiber content proved that the thermal conductivity increased with increasing of the thermal conductivity contrast ratio.
Effect of P/PAN hybrid nanofiber addition on paraffin actuator full stroke
The total paraffin compound filling capacity of the paraffin actuator capsule was 440 mg. The paraffin content of the paraffin compound was reduced and nanofiller was added gradually with following nanofiller/paraffin (mg/mg) amounts of 0/440, 11/429, 22/418, 37/403 and 44/396. Thus the expandable phase change material was replaced with nanofiller, and so the full stroke amount decreased accordingly. Figure 11(b) depicted a relative change of full stroke amount parallel to sample preparation of paraffin compound. Nanofiller addition had a positive effect on thermal performance of the paraffin actuator but a stroke loss up to%27 was observed with 10% nanofiller addition. Full stroke amount of each sample at 45°C are listed at Table 2. The capsule inner volume of the paraffin actuator should be increased in accordance with the nanofiller addition if the stroke loss needs to be eliminated for a specific application area.
Conclusions
Paraffins with different melting temperatures were successfully loaded to PAN nanofiber via electrospinning process at the ambient temperature. A simple preparation procedure was followed by mixing paraffin in PAN/DMF solution at over melting temperature of paraffin via magnetic stirring. After paraffin was melted in the solution, the mixture was slowly cooled down to the ambient temperature while continuously stirring. Homogenious colloidal molten paraffin particles transformed to homogenious suspension just by cooling the system down under melting temperature according to paraffin type. Paraffins with melting temperatures of 32, 58, 89 and 114°C were included in PAN nanofibers. The addition of paraffin reduced the PAN nanofiber diameter from 376 nm (neat PAN) to as low as 214 nm under the same electrospinning parameters. Entalpies of the paraffin portion in P/PAN nanofibers increased from 9.6 to 101.5 J/g respectively by increasing melting point of the loaded paraffin. FTIR results demostrating the positions of the corresponding peaks of PAN molecules in P/PAN nanofibers didn’t change significantly compared to neat PAN nanofibers. These revealed that since there was not a chemical interaction between PAN and paraffin molecules both at solution and nanofiber preperation processes, the phase transition property of paraffin could be very applicable for the cyclic usage of P/PAN nanofibers in thermal regulation applications.
P/PAN hybrid nanofibers were successfully applied in paraffin actuator which is adequate for e-vehicle battery cooling systems. Paraffin compound of the paraffin actuator was prepared with a mixture of pure paraffin and P/PAN nanofiber with weight ratios of 2.5, 5, 7.5 and 10%. Hysteresis value at 3 mm stroke was improved at 1.7, 3.4, 11.9 and 15.3% levels respectively. The effect of thermal percolation was observed between the samples of 5 and 7.5% nanofiber additions. Effect of thermal conductivity contrast on the nanocomposite structure was observed between solid and liquid paraffins by the thermal response performance of the paraffin actuator, which showed difference during heating and cooling periods, based on weight ratio of hybrid nanofibers in paraffin compound.
Supplemental Material
sj-pdf-1-jit-10.1177_1528083721988964 - Supplemental material for Paraffin/polyacrylonitrile hybrid nanofibers for thermal hysteresis enhancement of paraffin actuators
Supplemental material, sj-pdf-1-jit-10.1177_1528083721988964 for Paraffin/polyacrylonitrile hybrid nanofibers for thermal hysteresis enhancement of paraffin actuators by Ahmet Kutlu, Recep Eren and Yakup Aykut: the Core Outcome Set for Hand Fractures and Joint Injuries in Adults Group* in Journal of Industrial Textiles
Footnotes
Acknowledgements
The study is a part of Ahmet Kutlu's PhD thesis in Textile Engineering at the Graduate School of Natural and Applied Sciences, Bursa Uludag University. The authors thank to Kirpart Otomotiv Parçalari Sanayi ve Tic. A.Ş. for financial support on FTIR, DSC and TGA tests, and Nefise Yavuz for her help on nanofiber sample preparation.
Declaration of conflicting interests
The author(s) declared no potential conflicts of interest with respect to the research, authorship, and/or publication of this article.
Funding
The author(s) received no financial support for the research, authorship, and/or publication of this article.
Supplemental Material
This information is available free of charge via the internet at journal web page.
References
Supplementary Material
Please find the following supplemental material available below.
For Open Access articles published under a Creative Commons License, all supplemental material carries the same license as the article it is associated with.
For non-Open Access articles published, all supplemental material carries a non-exclusive license, and permission requests for re-use of supplemental material or any part of supplemental material shall be sent directly to the copyright owner as specified in the copyright notice associated with the article.