
Abstract
Thickness-loss is the most common problem in carpet after static and dynamic loading. Pile yarn properties as well as carpet structural parameters are mainly responsible for carpet thickness-loss. In the present research, an advanced version of recently developed fuzzy logic model is introduced. The model is able to predict thickness-loss of polyester carpets based on carpet pile density, pile height, and pile yarn count. Experimental work was performed to provide data for model knowledge base. Genetic algorithm was employed to optimize the fuzzy logic model parameters. Finally, lowest possible thickness-loss value together with corresponding values of carpet and pile yarn parameters bring this result was defined, using developed model. Modeling results showed that the model attained correlation coefficients as 0.9932, 0.9911, 0.9950, and 0.9957 between predicted and experimental values of carpet thickness-loss after low and high dynamic loading and static loading with short and long relaxation times, respectively. On the other hand, model predictions in four new unsighted conditions have brought correlation coefficients as 0.82, 0.89, 0.88, and 0.90 for low and high dynamic loading and static loading after short and long relaxation times, respectively. These results denote acceptable reliability of new developed model. Eventually, it is defined that levels of 850, 7.5, and 957.5 for carpet pile density, pile height, and pile yarn linear density, respectively, bring minimum carpet thickness-loss.
Introduction
Carpet is often exposed to the compression loading during usage in home and office. The weight of furniture as a static load and the users treading force as dynamic load on the carpet are typical applied compressional loads. Thickness-loss is the most common problem in carpet after static and dynamic loading. It causes bad appearance in carpet surface and cluttered carpet design and pattern. Also, it reduces initial softness and compressibility of the carpet and losses carpet resilience capability.
Some research studies have been carried out on carpet compression.1–9 Also, carpet compression loading mechanism has been evaluated by different theoretical-analytical models.10–14 In this way, carpet thickness-loss after static and dynamic loading as an important index of carpet compression behavior has been investigated in some other studies.6,7,15–28 In the mentioned works, physical and mechanical properties of pile yarns and geometrical parameters of carpet structure have been introduced as responsible factors to determine carpet compression behavior. In addition, the effect of fiber type in pile yarns on the compressibility of face-to-face carpet has been investigated in some studies. 15
It can be found that carpet compression or thickness-loss issue has been addressed in many research studies. Among these studies, carpet deformation mechanism under compression load has been explored and theoretical-analytical models have been introduced to describe carpet compression behavior.10,11,14,29 In these studies, physical and mechanical properties of pile yarn and geometrical parameters of carpet structure (such as pile density, pile height, yarn linear density, filament yarn structure, pile fiber material, fibers blend ratio, and pile fiber cross-section shape) have been introduced as factors influencing carpet compression behavior.
On the other hand, some soft computing modeling techniques have been introduced that they can be used to predict carpet compression behavior. Some of them were accomplished in different fields of textile science and engineering.30–40 Among modeling research studies, a semi-experimental fuzzy logic model has been implemented to predict acrylic cut-pile carpet thickness-loss under compression for carpet pile density, pile height, and pile yarn count, recently. 41 In this model, experimental data have been used for both construction of model knowledge base and model precision assessment. However, it was able to make reliable predictions in a logic precision.
Mentioned model has been used for cut-pile carpets made by acrylic pile yarns. 41 It seems that model needs to be generalized and expanded for other types of carpet. For this purpose, an advanced version of model has been introduced for polyester carpets by using recently developed model framework 41 in present work. Then, experimental work including polyester filament pile yarns production, carpet samples providing, and carpet static and dynamic loading tests has been carried out to provide data for model knowledge base and model verification. Theoretical and experimental values of carpet thickness-loss have been compared by regression method, finally. The new model enjoys stronger knowledge base and has more reliability. On the other hand, using developed model, lowest possible thickness-loss value together with corresponding values of carpet and pile yarn parameters bring this result is defined.
Experimental works
Carpet samples producing
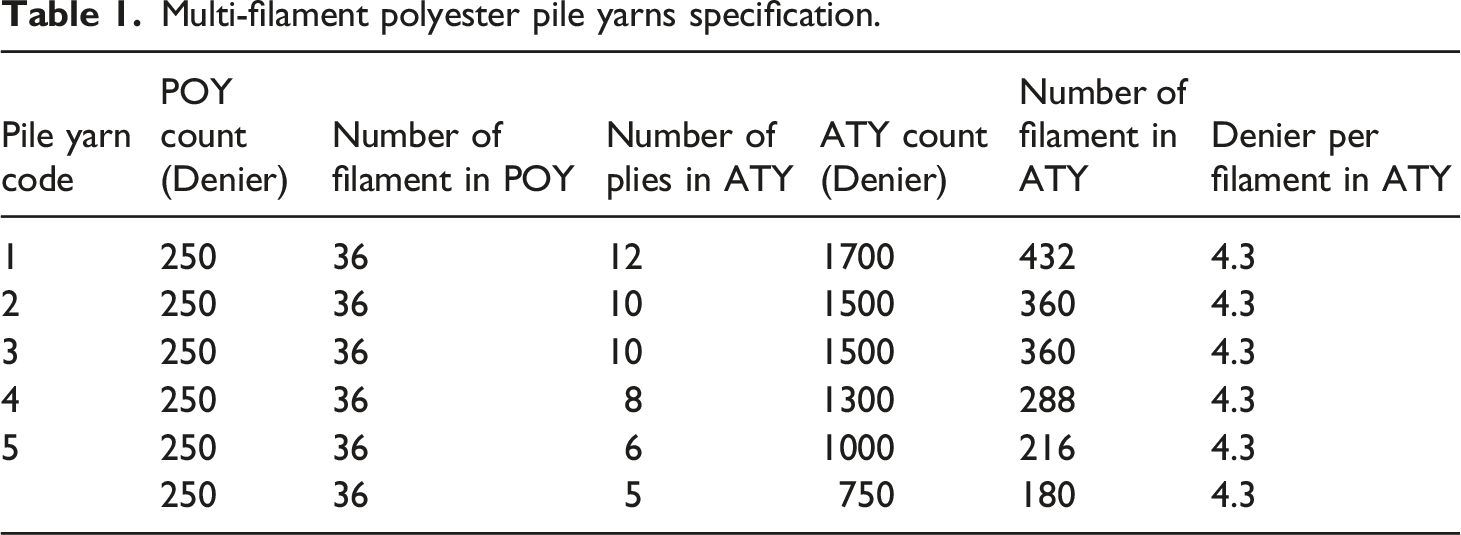
In order to produce carpet samples from multi-filament polyester pile yarns, six ATY (Air-jet Textured Yarn) polyester plied yarns were produced according to flow chart (Figure 1). At first, multi-filament polyester yarns were prepared on a melt spinning system. All polyester yarns were produced from PET Textile Grade granules with 285°C melting point as a POY (Partially Oriented Yarn) yarn with linear density of 250 denier and trilobal fiber cross-section. Then, they were assembled in form of 5, 6, 8, 10, and 12 plied yarns. After that, POY yarns were passed through the drawing machine with 1.7 draw ratio to make FOY (Fully Oriented Yarn) polyester yarns. In the following, pile yarns were textured by an air-jet texturing machine (made by SSM® Company) under 10 bar pressure and 10% overfeed. To have a suitable weaving process, all kinds of prepared ATY polyester pile yarns were twisted under 100 TPM (Twist Per Meter) and heat set in an autoclave machine during 40 min. The specification of six used polyester pile yarn samples (1, 2, …, 6) has been presented in Table 1. Carpet pile yarns production flow chart. Multi-filament polyester pile yarns specification.
Applied carpet weaving machine specifications.

After weaving process, all carpet samples were passed through the carpet finishing process including brushing, initial shearing, initial cleaning, back sizing, drying, steaming, final shearing, final cleaning, and cutting stages (Figure 2). Carpet samples.
Carpet thickness values.

*N and R: Carpet samples with “Normal” and “Reduced” pile height, respectively.
Carpet compression loading tests
To find out thickness-loss value as a carpet compression behavior criterion, standard static and dynamic loading tests have been carried out. For this purpose, all carpet samples were kept in standard atmosphere condition for 24 h before testing according to ISO 14253-1 standard test method. Then, thickness values of five specimens of each carpet type were measured by means of a digital carpet thickness tester (Figure 3) based on ISO 1765 standard test method. ReesSanj® Digital Thickness Gauge TG92 (maximum error Digital carpet thickness gauge.
For static loading test, five specimens of each carpet type (with dimension of 12.5 * 12.5 cm2) were inserted into the carpet static loading instrument under pressure of 700 kPa for 24 h under standard atmosphere according to ISO 3416 standard test method (Figure 4). Then, thickness values of carpet specimens were measured at 2 and 1440 min of relaxation times after removing the pressure. Carpet static loading instrument.
In dynamic loading test, five specimens of each carpet type (with dimension of 10 * 10 cm2) were tested by means of carpet dynamic loading instrument (Figure 5). Carpet dynamic loading instrument.
According to ISO 2094 standard test method, 100 and 1000 impacts were imposed on each carpet specimens with constant frequency (14 impacts/min.) under standard atmosphere. Then, thickness values of each carpet specimen after each of two impacting stages were measured.
Static and dynamic thickness-loss values (

Fuzzy logic modeling
Recently, fuzzy logic semi-experimental model has been implemented to predict acrylic cut-pile carpet thickness-loss under compression. 41 In this model, data are used to provide the model knowledge base, enhance the model precision, and verify the model. Although, some simplifications were applied in providing the fuzzy logic rules, but the model was able to predict the expected values with a good precision. In the present research, abovementioned model is proposed to set up for the carpets made by polyester pile yarns, meanwhile, by applying an advanced rule providing method, it is upgraded to a more reliable version.
Experimental work for the present research (described in Experimental) was performed with the same methodology as what performed and described in previous modeling research, 41 except for materials. Also, all new expanded model specifications are the same as those of previously developed model, 41 except for rules composing algorithm and reference values of polyester pile yarns and carpet samples.
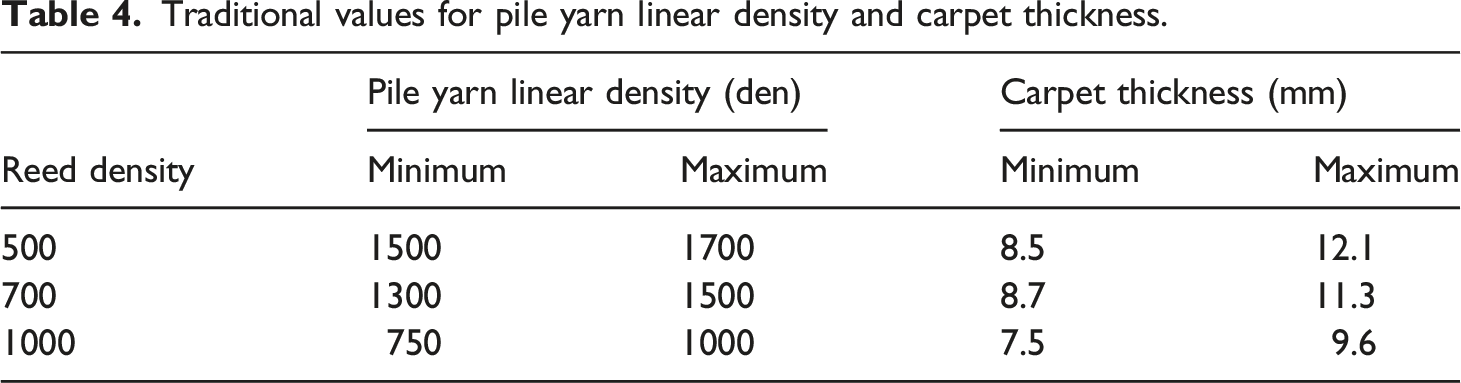
In the model, pile yarn linear density, carpet pile density, and carpet pile height were predictors for four compressibility indices; carpet thickness-loss under low and high dynamic loadings, as well as under static loading followed by short and long relaxation times. Three linguistic levels for carpet pile density (500R, 700R, and 1000R), two levels for pile yarn linear density (“Fine” and “Coarse”), and two levels for carpet pile height (“Normal” and “Reduced”) have been proposed (Figure 6). To select membership function shapes, simplest forms of common functions were considered in Ref. 41 and also in the present modeling attempt. Hence, z-shape function for lower linguistic levels, π-shape for intermediate levels, and s-shape for upper levels were chosen as input parameters. Membership function of linguistic levels for predictor variables.
41
(a) pile density, (b) pile yarn linear density, and (c) carpet thickness.
Traditional values for pile yarn linear density and carpet thickness.
Each of four output variables has five linguistic levels with triangular membership functions who are uniformly distributed over horizontal axis of de-fuzzification graphs. Minimum and maximum values on horizontal axis of each graph are those observed in the experimental.
During extraction of the rules from the experimental data, firstly, each observation condition must be explained as levels of three predictor variables. The samples are produced in the conditions that each production variable has full membership in only one linguistic level and null for the others, but four related measured durability indices do not. In fact, by referring each observed durability index to its defuzzification graph, (often) two non-zero memberships for two linguistic levels are met (Figure 7). Having two output levels related to a unique observation condition, two different if-then rules with same antecedent statement, and two different consequent statement are composed. Membership of each linguistic level is proposed as weight of the rule who points to this level in its consequent. Composing rules from an observation in this way are shown in Figure 8. Membership function shapes of five linguistic levels for each predicted variable,
41
(for low dynamic loading: min = 19 and max = 33.8; for high dynamic loading: min= 24.3 and max = 41.5; for static loading with short relaxation time: min = 15.11 and max = 38.6; for static loading with long relation time: min = 10.3 and max = 33.1). Composing the rules from an observation.

Composed rules for the fuzzy logic model.
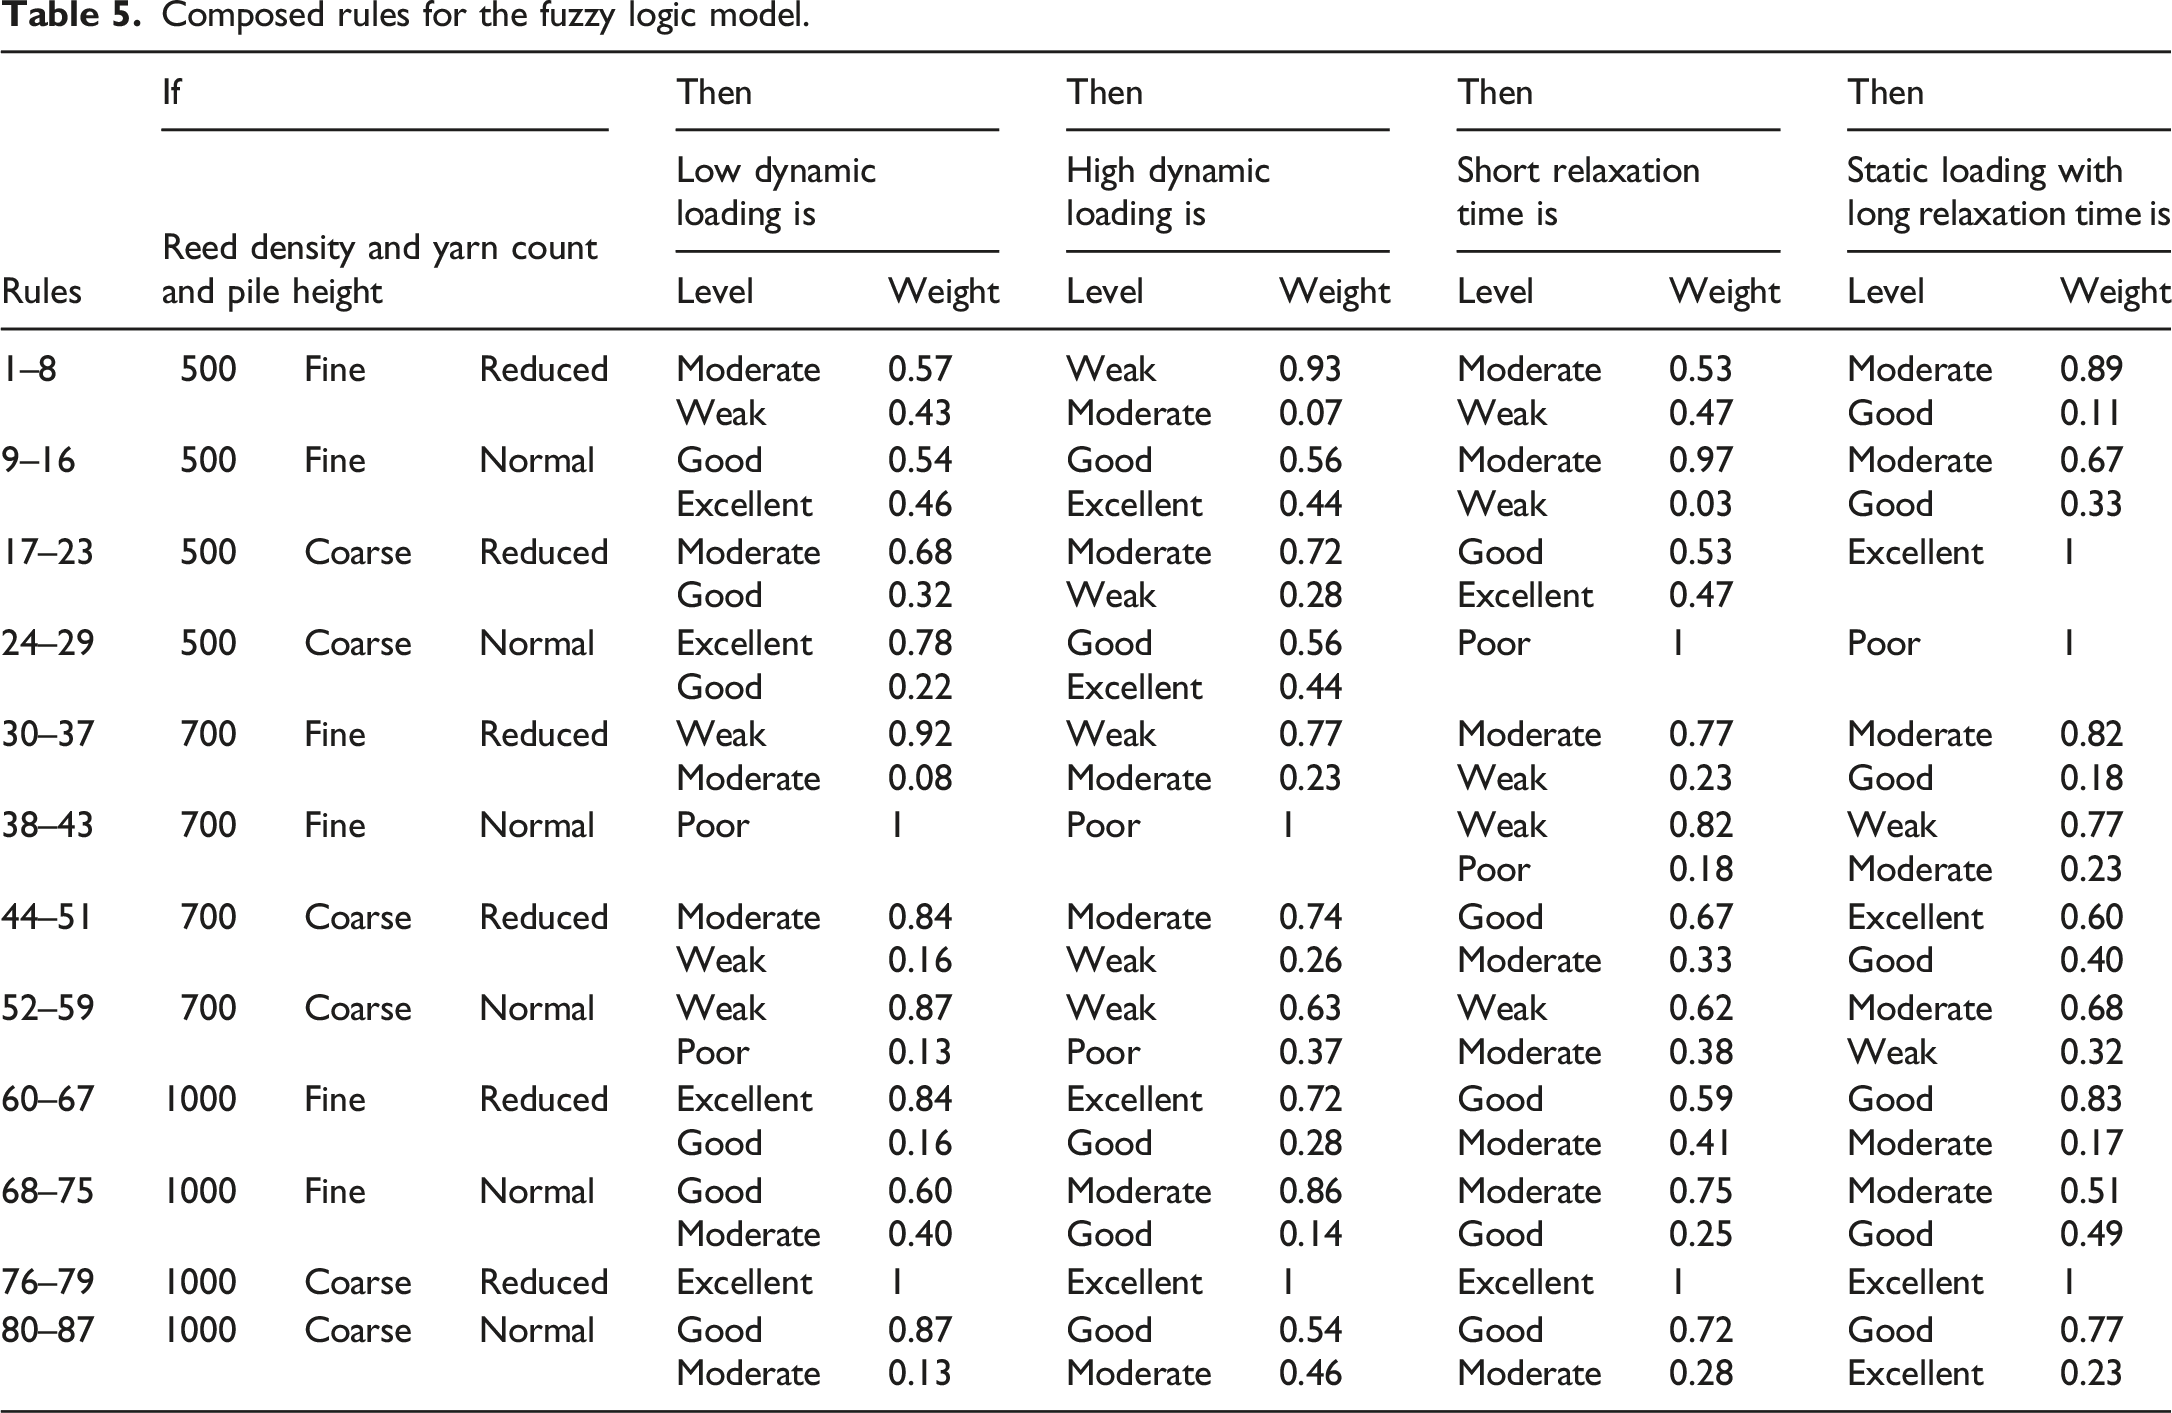
As a matter of fact, composing these rules is the extreme possible usage of experimental data, to prepare model knowledge base. Although, it is beneficial, but brings over-dependency of the model to employed experimental data. So, reliability of the model predictions in other conditions than those employed in rules extraction must necessarily be verified. Other FL model specifications have been: The operator AND description: Minimum, Defuzzification procedure: Centroid, and Modeling tool: MATLAB®2015.
Genetic algorithm (GA) has been run to find the best setting points of the predictors’ linguistic levels over a logical range (totally 20 points) (Figure 9). In Figure 9, logical ranges of setting points are shown. Proposed logical range for values of parameters. (a) Reed density, (b) pile yarn linear density, and (c) carpet thickness.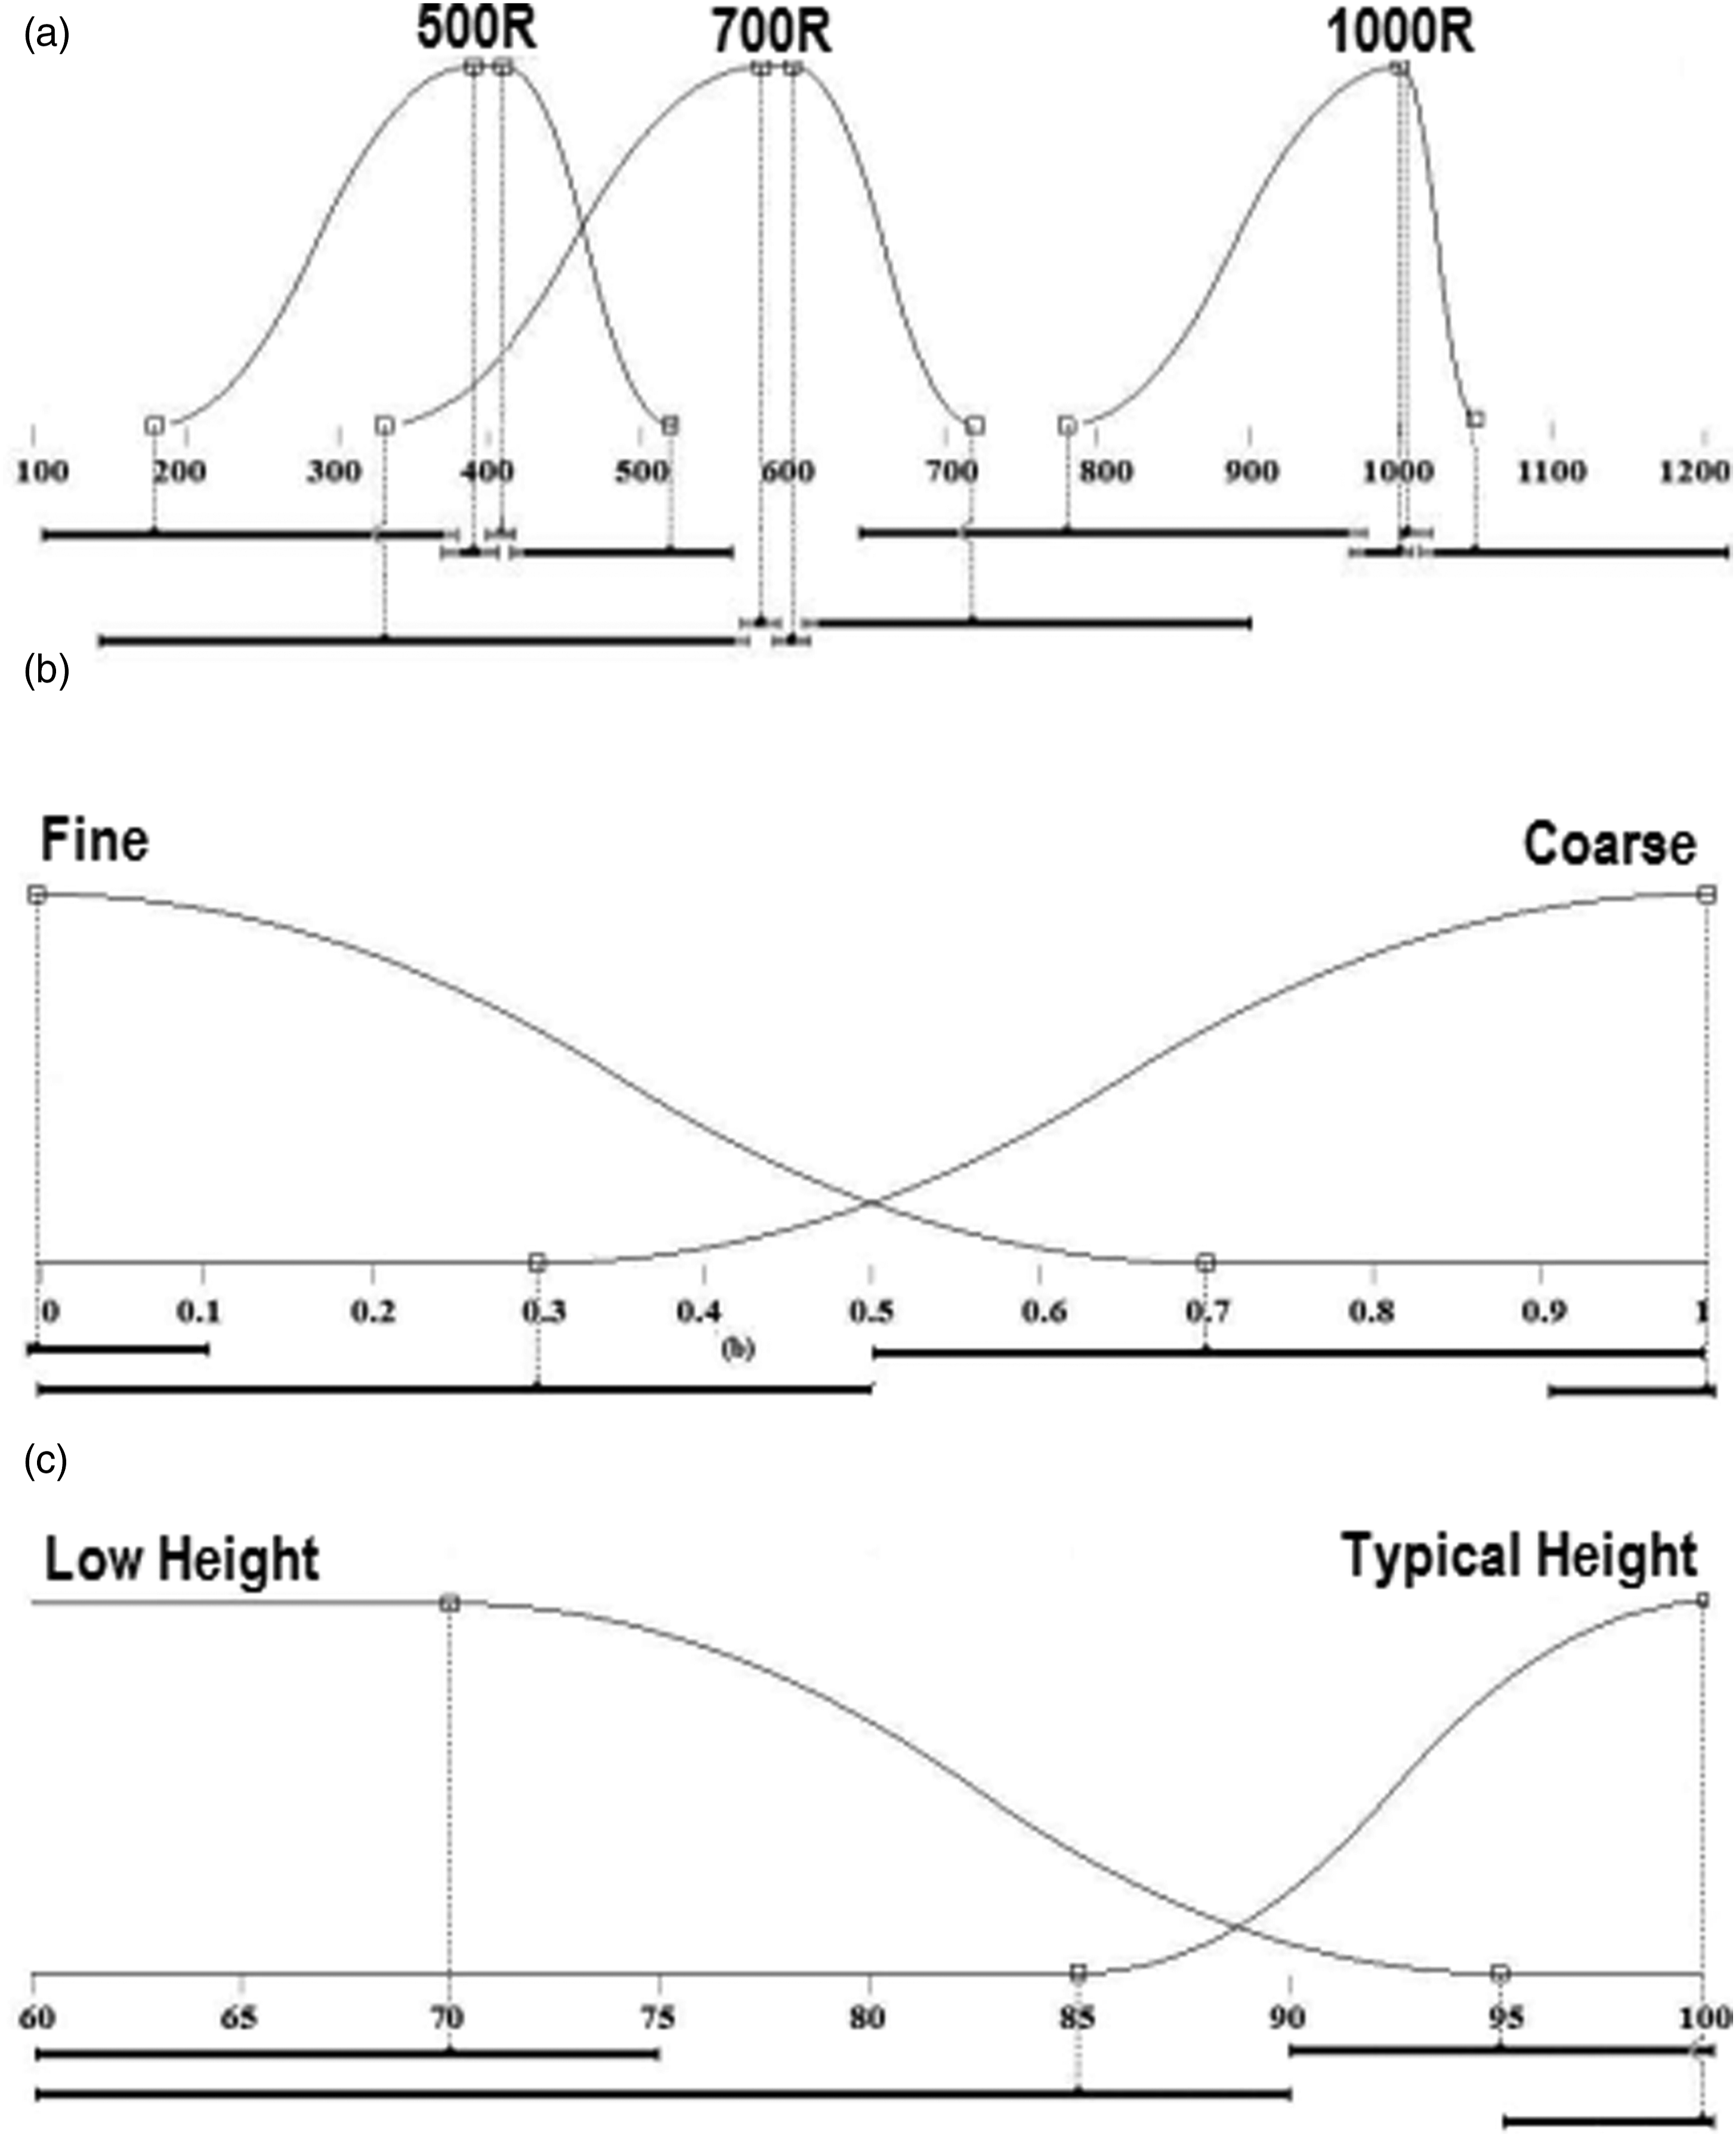
Genetic algorithm for model settings.

Results and discussion
Experimental results
Thickness-loss values of carpet samples after static loading tests.

aAv: Average.
bSD: Standard deviation.
cCV%: Coefficient of Variation.
dTLS: Thickness-loss after static loading test.
Thickness-loss values of carpet samples after dynamic loading tests.

aAv: Average.
bSD: Standard deviation.
cCV%: Coefficient of Variation.
dTLD: Thickness-loss after dynamic loading test.
Modeling results
The optimization algorithm produces 308 generations to find the best answer. In Figure 10, trends of the best chromosome fitness and fitness values in generations have been presented. The best and average fitness of generations (notice: Negative signs must be neglected in vertical axis labels and the graph title).
In Figure 11, fuzzy logic model variables have been illustrated in which the membership function parameters have been set according to the GA optimization answers. Fuzzy logic model with setting of membership function parameters according to genetic algorithm answer.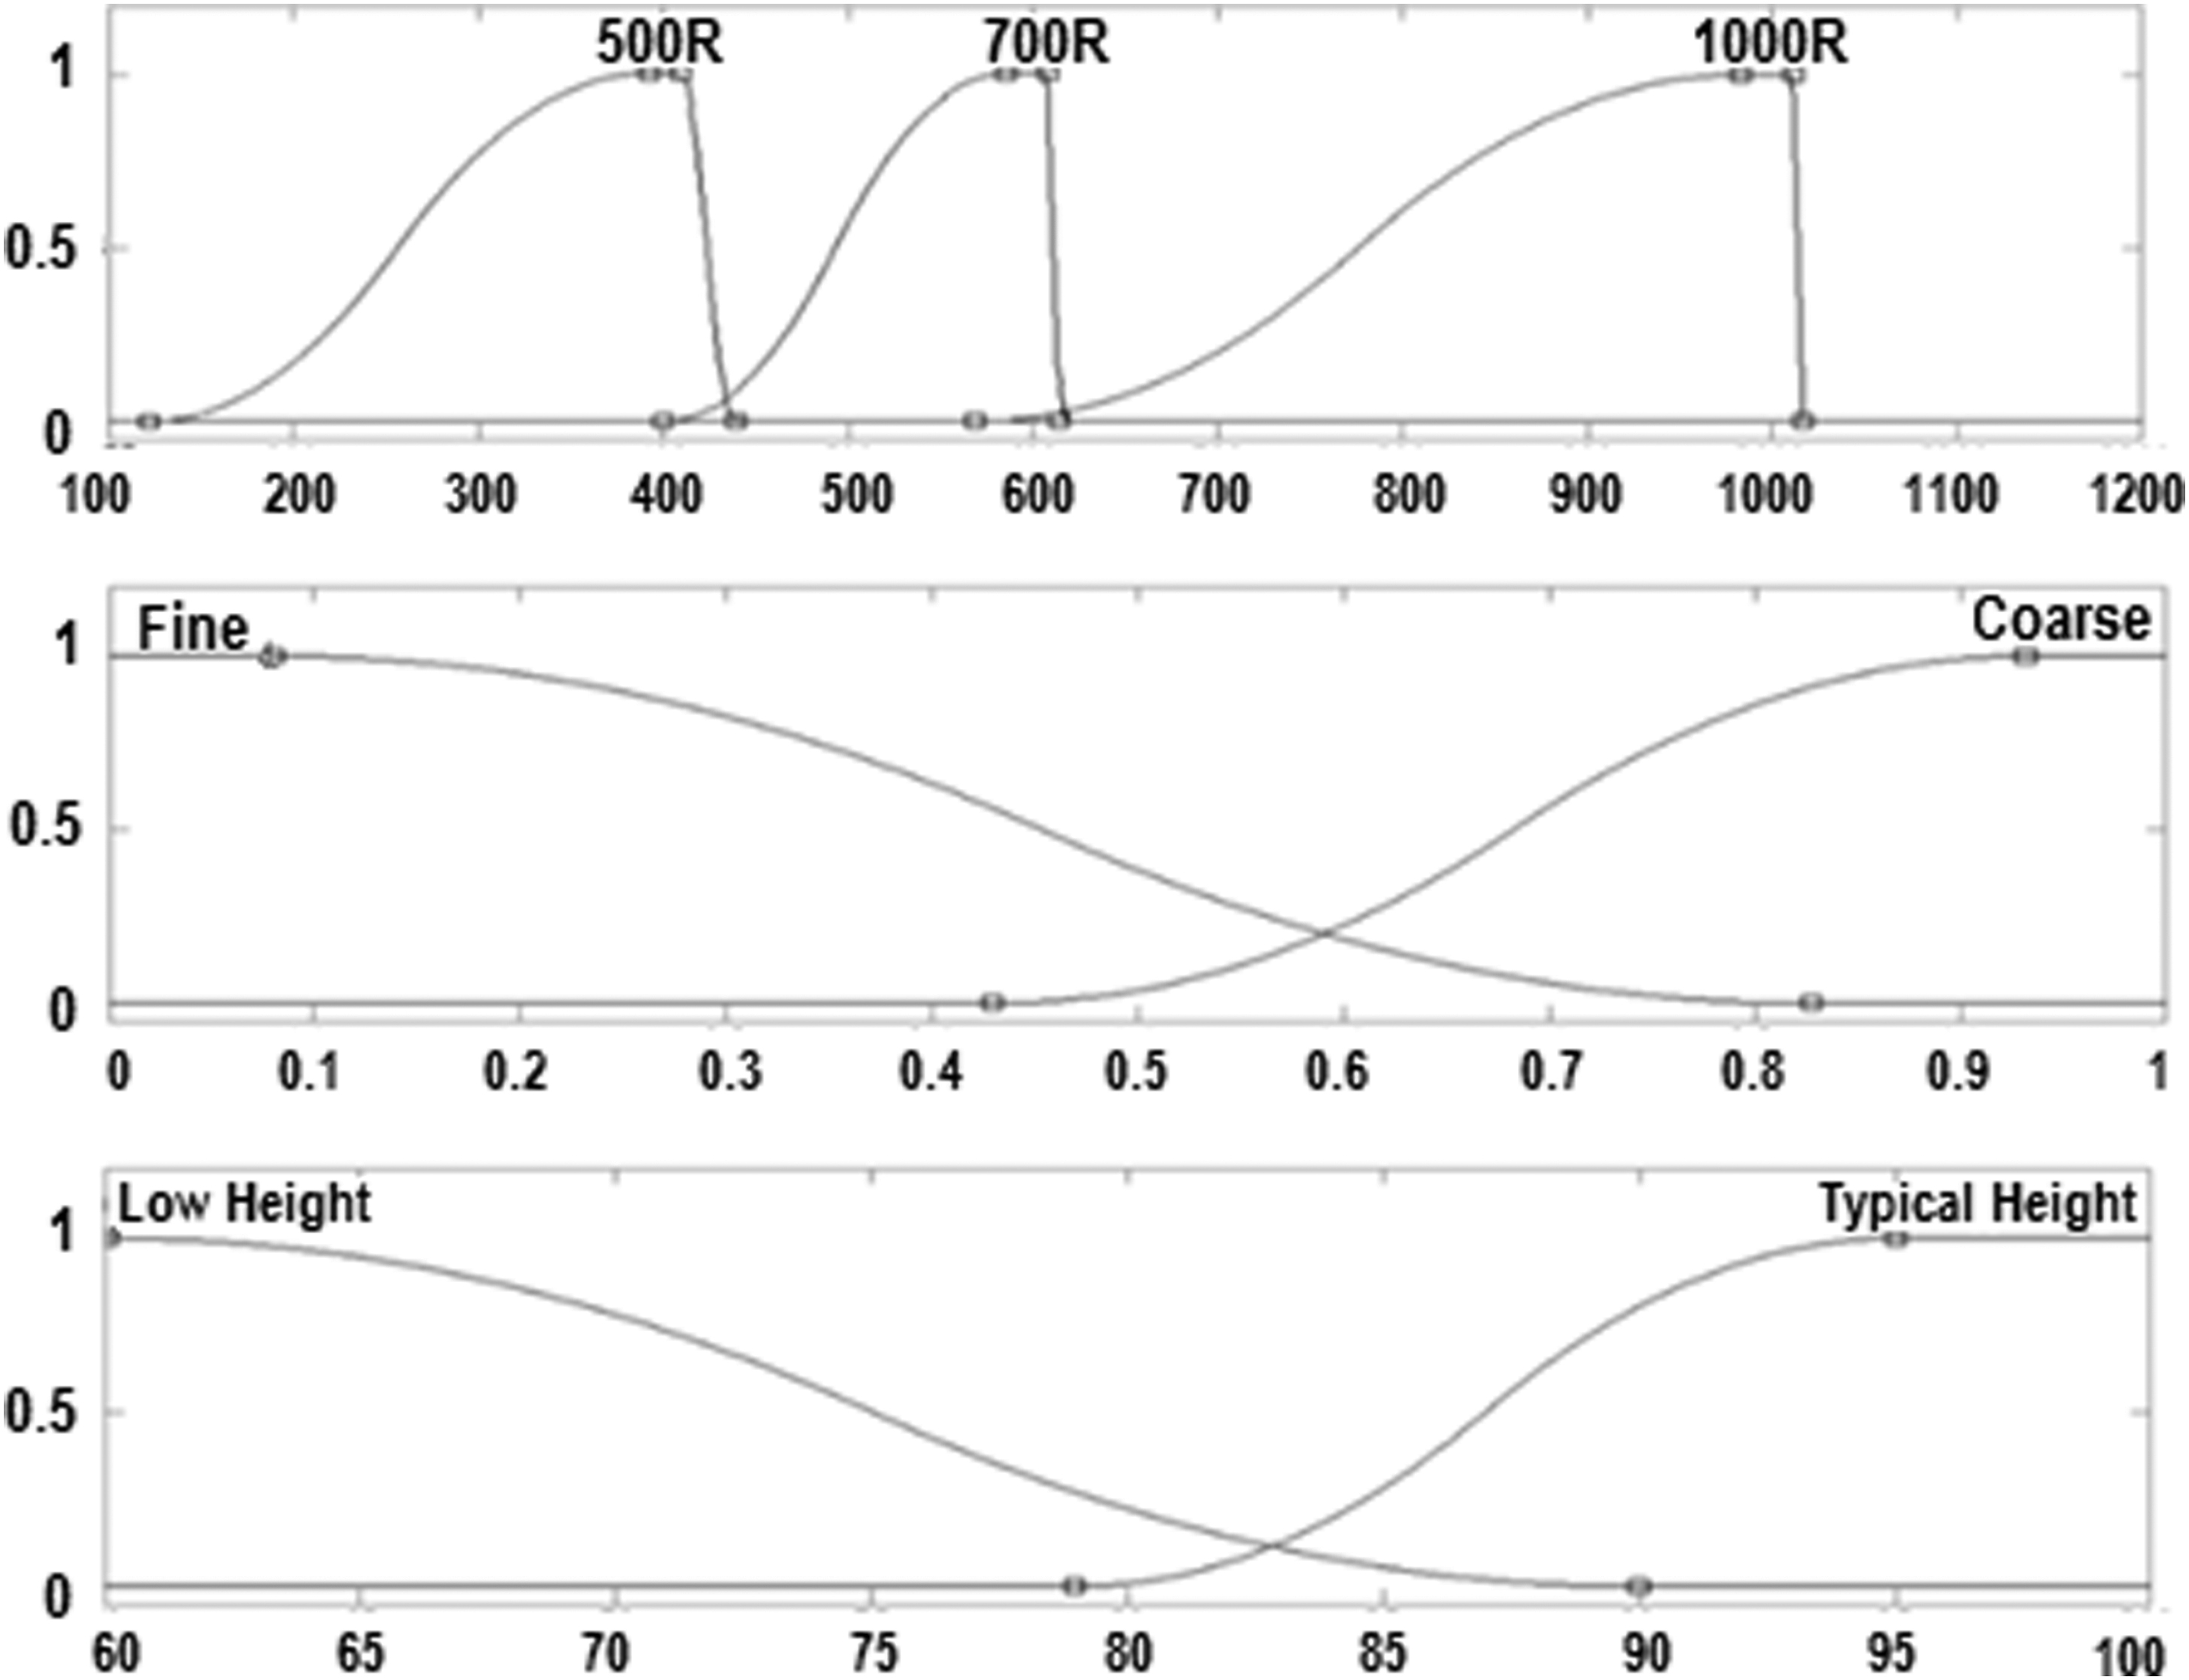
In Figure 12, the Genetic algorithm optimization answer has been presented an averaged correlation as 0.99. Relation between experimental and model predicted values for (a) low dynamic loading, (b) high dynamic loading, (c) and (d) static loading with short and long relaxation time, respectively.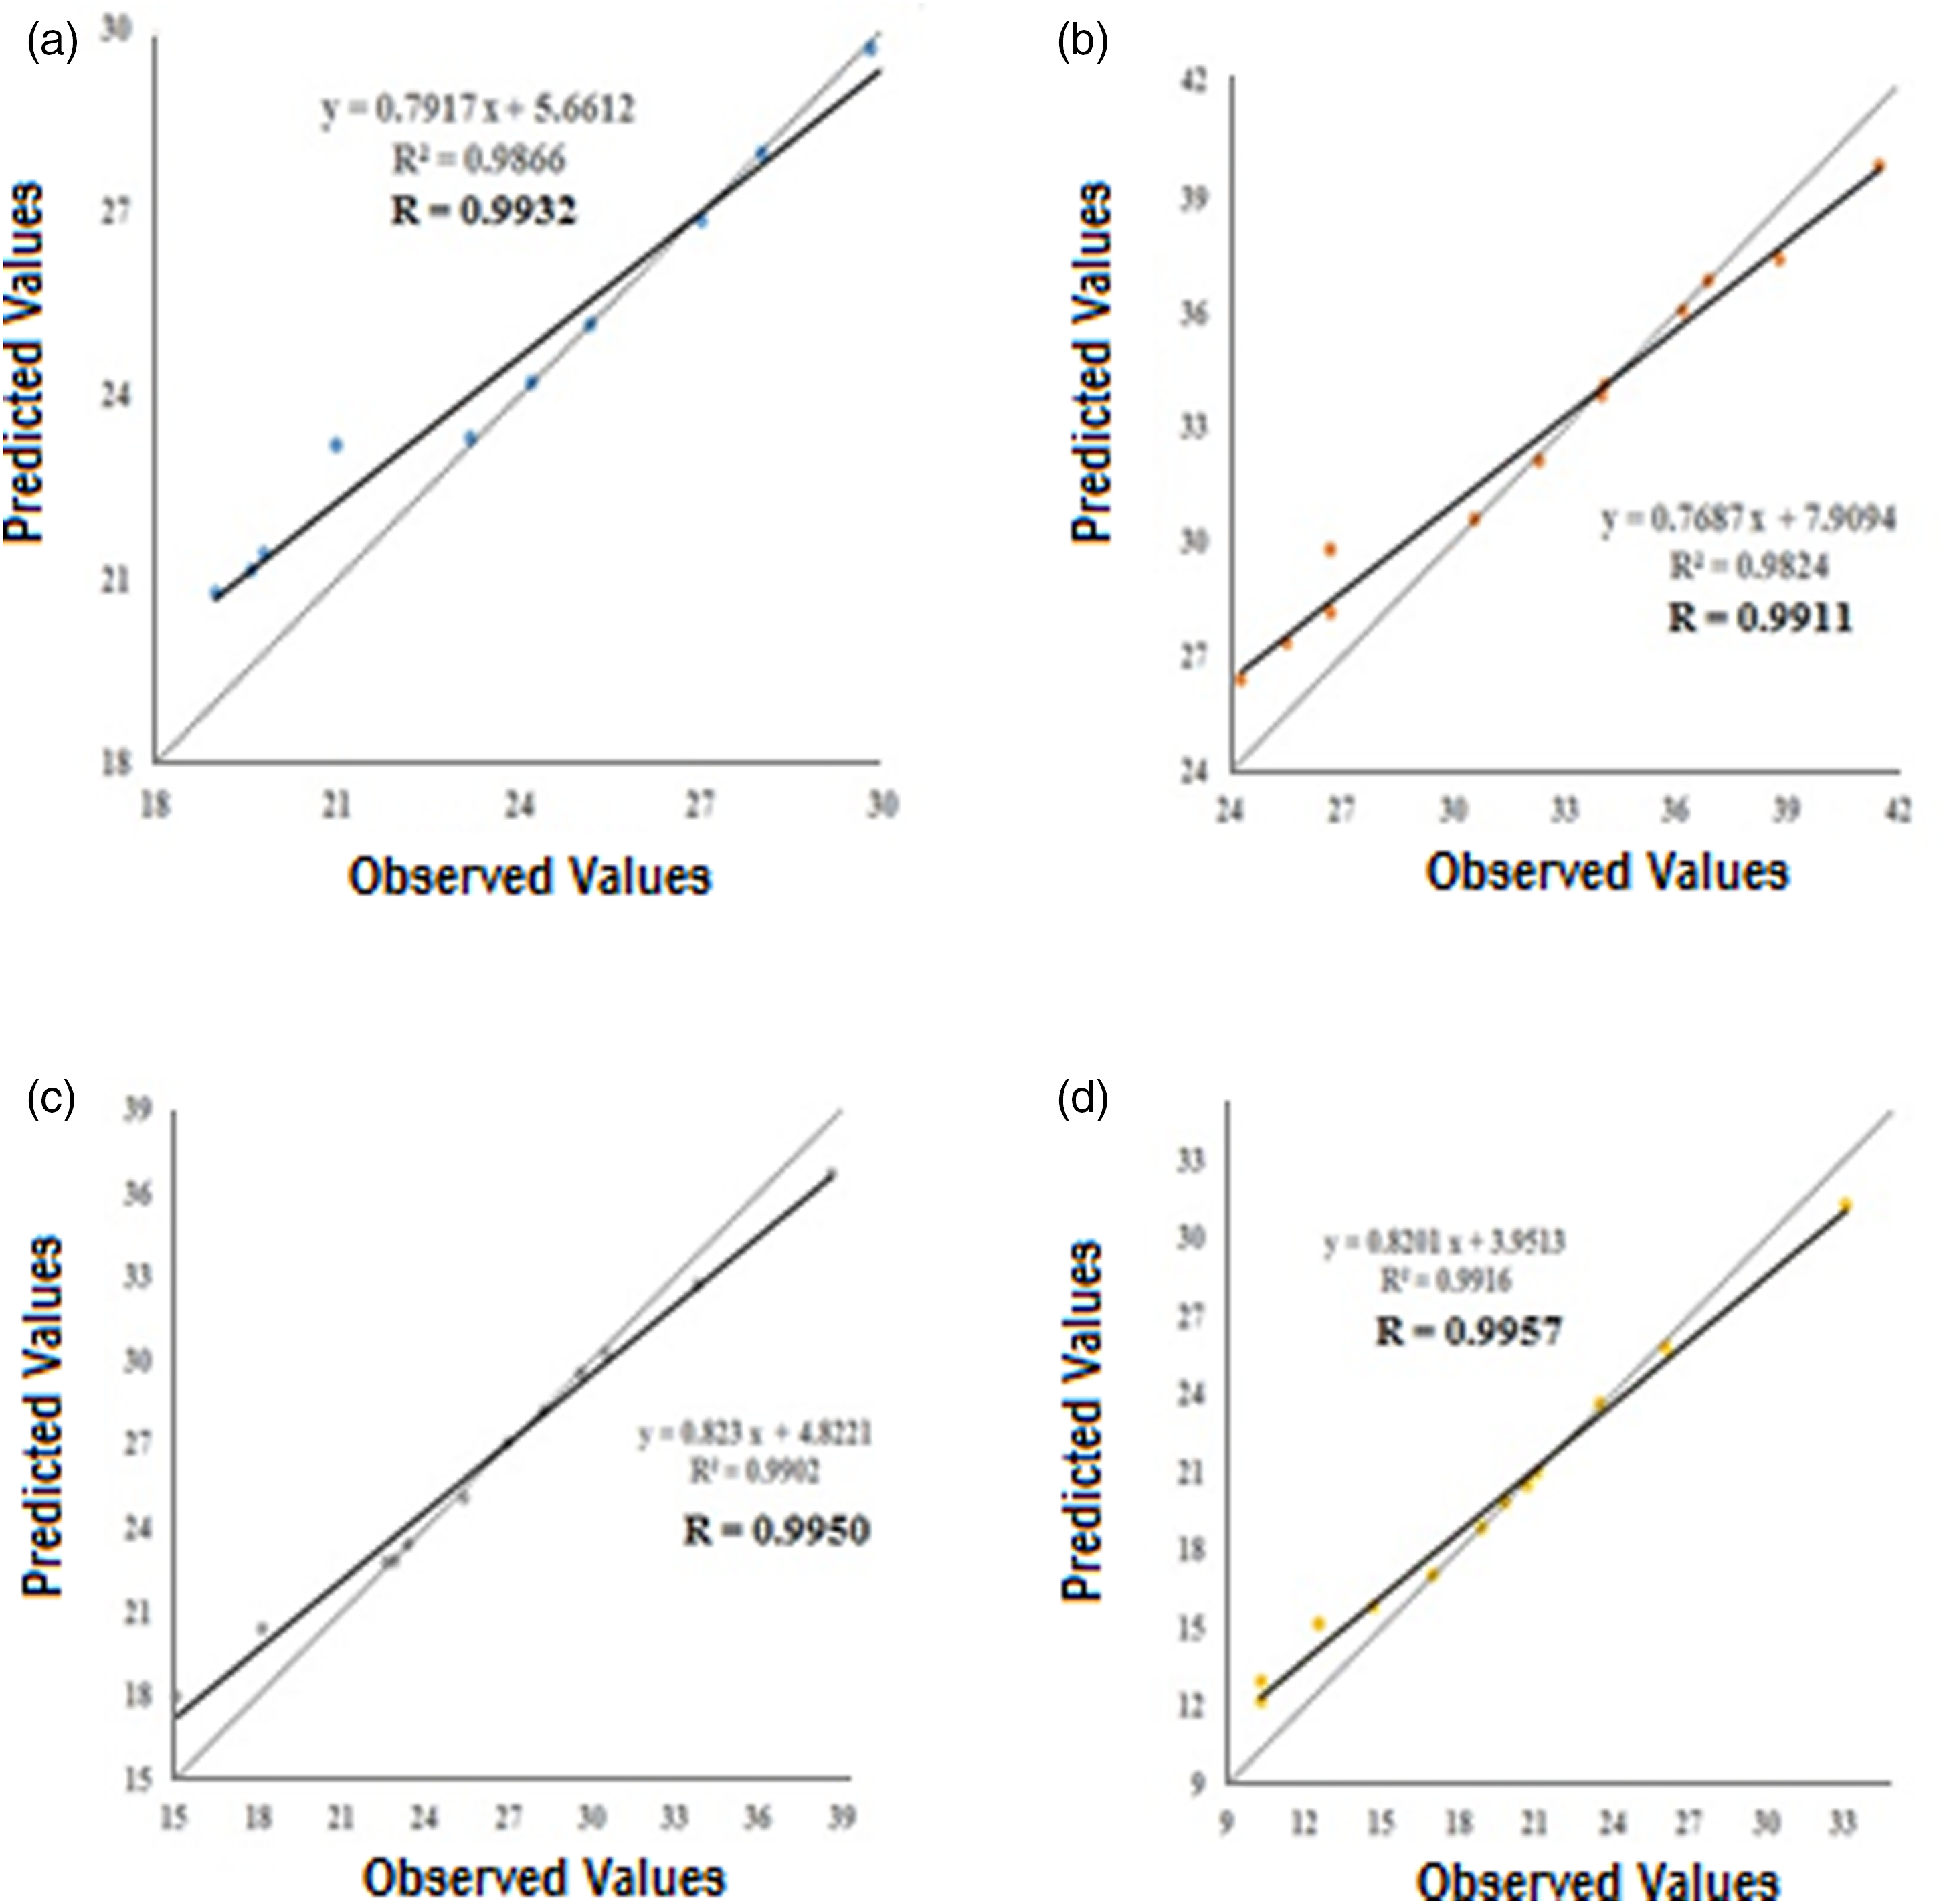
Detailed inspection has indicated that the best optimization answer has attained correlations as 0.9932, 0.9911, 0.9950, and 0.9957 together with mean squared errors as 1.3, 2.04, 1.5, and 1.84 for low dynamic loading, high dynamic loading, and static loading with short and long relaxation times, respectively.
The slope of linear regression in all cases was less than one (Figure 12). Also, all the models overestimate in low output levels and underestimate in high levels. This means a systematic error in model predictions. So, a detailed insight into the model is necessary to find the reasons. Meanwhile, superior correlation coefficients between predicted and experimental values may be related to the fact that: experimental values are compared to model predictions, then the model predictions have been implemented considering the rules, and consequently, the rules, in turn, have been developed regarding the experimental observations. So, a new model assessment considering diverse data is essential. In this way, validity of model predictions in some new conditions has been evaluated. Then, four carpet samples were used to perform the evaluation. All specifications of used carpet samples were identical with those of main 12 used carpets, except for predictors’ levels. The compressional behavior indices of new carpets were defined experimentally, too. Fuzzy logic (FL) model is used to predict four compressibility indices of these carpets. Then, in Figure 13, linear regression between estimated with experimental values is presented. Linear regression and correlation coefficient between model predicted and experimental values of four test data for (a) low dynamic loading, (b) high dynamic loading, (c) and (d) static loading with short and long relaxation time.
As displayed in Figure 13, correlation coefficient between predicted and observed values are 0.82, 0.89, 0.88, and 0.90 for low and high dynamic loading and static loading after short and long relaxation, respectively. These results denote acceptable reliability of developed model. However, the regression line slopes are 0.53, 0.72, 0.72, and 0.74. The slopes are comparable to what are seen in initial evaluation of model (Figure 12(a)–(d)). ANOVA test results for the linear regressions show all the slopes have significant values more than zero. However, somewhat worse happens in new evaluation than what in initial evaluation. Detailed consideration on the trends reveals that in the case of low dynamic loading, one of registered points on the graph is guilty for reduced slope. Of course, as discussed previously, better prediction for 12 main data than those for four extra ones is a normal observation. Also, if one agrees with existence of an error source in model predictions which causes low trends slopes, result of extra assessment procedure proves its reliability in unconsidered carpet specifications.
Suitable carpet specifications for having lowest thickness-loss in each loading condition and brought TL%.

The search results in Table 9 indicate that predictors’ levels as 850, 7.5, and 957.5 for pile density, pile height, and pile yarn count, respectively, bring minimum thickness-loss for all four loading programs. Optimized four thickness-loss levels are reported in Table 9.
Conclusion
Fuzzy logic semi-experimental model was previously implemented to predict thickness-loss values of acrylic cut-pile carpets under static and dynamic loadings. In that model, carpet pile density, pile yarn linear density, and carpet pile height were predictors of carpet thickness-loss after low and high dynamic loadings and static loading with short and long relaxation times. Meanwhile, experimental data provided model knowledge base, and GA is employed to optimize model parameters. In the present research work, an advanced version of that model with similar predictor/predicted variables has been developed for cut-pile carpets made by filament polyester pile yarns. Developing new model, each experimental observation had been used to prepare two weighted rules. Model precision is validated via comparison of predicted values with the experimental. By applying new method for rules extraction, available experimental data have been used in a non-loss form. It brings over-dependency to experimental data. So, in order to ensure the model validity, its reliability in some new conditions rather than those employed for extracting the rules has been assessed, too.
Results showed that the model attained correlation coefficients as 0.9932, 0.9911, 0.9950, and 0.9957 between predicted and 12 main experimental values of carpet thickness-loss after low and high dynamic loading and static loading with short and long relaxation times, respectively. However, all the models overestimate in low output levels and underestimate in high levels (the regression slopes are less than one). On the other hand, model predictions in four new unsighted conditions have brought correlation coefficients as 0.82, 0.89, 0.88, and 0.90 for low and high dynamic loading and static loading after short and long relaxation times, respectively. These results denote acceptable reliability of newly developed model.
Finally, carpet compression behavior indices of all possible predictors’ levels have been defined using developed and optimized model. The result of total search over the calculated values has indicated that predictor levels as 850, 7.5, and 957.5 for carpet pile density, pile height, and pile yarn linear density bring minimum carpet thickness-loss, respectively. Applying present developed model to predict thickness-loss of other carpet structures (e.g., loop-pile) and other pile yarn material is suggested for the future works.
Footnotes
Declaration of conflicting interests
The author(s) declared no potential conflicts of interest with respect to the research, authorship, and/or publication of this article.
Funding
The author(s) received no financial support for the research, authorship, and/or publication of this article.