
Abstract
Polymeric biomaterials, such as polyether ether ketone (PEEK) and cellulose, have been explored as scaffolds for bone tissue engineering in the past decade. In this study, microstructure and mechanical behavior of uncoated and hydroxyapatite (HA)-coated polymeric meshes, fabrics, and mats were investigated. Commercially available monofilament PEEK meshes, and cellulose fabrics and mats were selected, then coated with a customized low temperature sol–gel method (≤ 150°C). Adhesive HA coating consisting of HA, β-TCP, and CaO with nanorod structure was derived. After HA coating, porosity of substrates (except filter-paper cellulose mats) decreased by up to 43%, indicating effective coating. Both uncoated and HA-coated substrates’ degradation rate in phosphate-buffered saline decreased after day 3. This is a result of ion precipitation or calcium compounds formation, indicating potential stability in biofluids for an extended period of time. Regarding tensile test results, highest tensile strength and elongation at break were obtained for PEEK meshes (approximately 80 MPa and 35%, respectively), as a result of the bulk material properties. HA coating did not significantly affect the tensile properties of the specimens, except for cellulose mats with an initial porosity of 77% (tensile modulus increased by 270% and strength by 210%). The increase in tensile properties could be attributed to increased rigidity, resulting from the adhesion between HA coating and cellulose fibers. Overall, HA-coated cellulose mats and PEEK meshes show promise as customizable, flexible scaffolds for implant applications and bone regeneration for future work.
Introduction
Traditional implants for repair of bone defects are often made of titanium (Ti) and its alloys, as they possess good chemical stability, biocompatibility, and mechanical properties.1–4 Metallic implants, however, are heat conductive, potentially cytotoxic due to the release of harmful ions, and may present allergenic effects. In addition, as Ti elastic modulus is above 100 GPa, it may lead, in some cases, to resorption of surrounding bone. To improve upon Ti’s limitations, polymeric biomaterials, such as polyether ether ketone (PEEK), polymethyl methacrylate (PMMA), and cellulose, have been explored as scaffolds for bone tissue engineering or repair of bone defects, including applications like cranioplasty.1,5,6 Polymeric bulk materials typically require custom design, taking place before their use in the operation room, but flexible films or scaffolds can partially circumvent this limitation.7–9
PEEK is a biocompatible, semi-crystalline polymer with excellent mechanical properties, non-toxicity, high chemical resistance, and natural radiolucency.10,11 It has been used as orthopedic implants, with a complication rate similar to Ti, but better than autologous bone grafts based on surgical meta-analysis results. 12 However, the smooth surface of PEEK implants typically needs to be modified to improve osseointegration or incorporated with fillers, such as hydroxyapatite (HA). 13 In addition, porous PEEK scaffolds, such as woven monofilament or multifilament fabrics, have been shown to lead to good levels of cell attachment, even without surface modification, suggesting weave pattern and open areas play an important role in biocompatibility properties. 14 Cellulose has also been explored in the past years for bone repair applications. Natural and synthetic cellulose (C6H10O5)n-based mats, films, and scaffolds have been used for different bioengineering applications, from wound dressing to tissue engineering.15–17 Cellulose is known for its biocompatibility, low cytotoxicity, and good biochemical properties.13,18 As mats are porous and consist of randomly oriented fibers, 19 they are flexible and the open areas between fibrils can hold liquids, for instance, cell suspension or human body fluids. 19 Cotton threads are made from fibrous cellulose, which have been used as biocompatible sutures. 20 As the basic component is biocompatible, any stable shape should be biocompatible as well. Consequently, cotton fabric could be considered for various tissue engineering applications. 21 PMMA is a polymeric biomaterial that has been employed for cranioplasty implants during and after World War II.22,23 To overcome low mechanical properties of PMMA and provide flexibility, it was combined with mesh materials, such as stainless steel, to create a composite material.24,25 Thus, PMMA has potential for customizable implants when combined with a flexible substrate, as reinforced PMMA scaffolds could be both biocompatible and flexible.
By themselves, pure polymeric biomaterials are typically not bone regenerative, 26 but they can be coated by osteoinductive factors.27,28 Bioceramics are osteoinductive according to their chemical structure. HA (Ca10(PO4)6(OH)2) is an inorganic part of bone and tooth, which can initiate bonding with surrounding bony tissues. 29 Therefore, it can be used as a thin coating on various scaffolds to circumvent ceramic brittleness issues, while promoting osteoinduction and adhesion to nearby tissues. This was demonstrated for PEEK implants in an animal study, where ion beam assisted deposition-coated PEEK exhibited improved bone regeneration and implant fixation compared to uncoated PEEK. 30 Multilayered HA coatings have also been used on various cellulose mats and cellulose nanofibers to demonstrate their potential for bone regeneration.5,6 In such cases, a successive dipping or soaking process in different solutions for HA mineralization on the cellulose fibers was employed. Similarly, sol–gel processes may be used, where the sol transforms to gel phase after solvent evaporation. The coated substrates typically undergo calcification at different temperatures to enhance hardness, adhesion, and stability of the coating. Sol–gel is an inexpensive, low temperature method suitable for substrates with complex geometries. It was shown to lead to thin coatings (< 2 μm) with good adhesion for substrates made from a range of materials (metals and polymers).31–35 The main drawbacks of this process is that the coating coverage depends on sol viscosity and the thickness is not uniform. Moreover, the temperature during the drying phase can affect polymeric substrates and deteriorate their mechanical properties.
While porous scaffolds, such as meshes, woven fabrics, and mats, have potential for implant and bone repair applications, they possess additional benefits (over bulk, custom-designed implants), such as flexibility and customizability. However, there are limited studies regarding sol–gel HA coating morphology and its effect on mechanical behavior of porous, polymeric scaffolds. It is expected HA fillers incorporated into the bulk polymer can reduce mechanical properties above a certain weight fraction, 36 while HA coating on hydroxyethyl cellulose/poly (vinyl) alcohol fibrous scaffolds was observed to improve stiffness and strength, but decrease elongation at break. 3 However, the effect of sol–gel HA coating on the mechanical behavior of different forms of polymeric scaffolds (i.e., mesh, fabric, and mat) has not been investigated.
Therefore, the aim of this study is to assess the effect of sol–gel HA coating on the morphology and mechanical behavior of polymeric meshes, and cellulose-based fabrics and mats. Polymeric materials, typically suitable for biomedical applications (commercially available PEEK, PMMA, and cellulose-based substrates), were investigated in different customizable and flexible forms (mesh, fabric, and mat), with and without hydroxyapatite coating. More specifically, this work has two main research objectives: (1) investigate the effect of low temperature drying process for sol–gel coating (≤150oC) on HA crystal structure, and whether it leads to similar structure as high temperature drying, and (2) understand and compare the effect of HA coating on tensile properties (tensile modulus, strength, and strain at break) of different polymeric scaffolds (PEEK mesh, cotton and cotton-PMMA fabrics, and cellulose mats). The microstructure of the substrates was first evaluated for fiber diameter distribution and porosity. Then, HA powder and coated substrates’ chemical structure and surface morphology were studied to understand the effect of drying temperature and coating procedure on substrate microstructure. Degradation tests in phosphate-buffered saline (PBS) were carried out to assess coating performance. Finally, tensile tests were performed to investigate the effect of HA coating on mechanical performance, which was not previously reported in the literature for different substrates (PEEK mesh and cellulose-based fabrics and mats).
Materials and methods
Materials
A sol–gel method was used to derive hydroxyapatite solution and powder. Potassium dihydrogen phosphate (EMSURE® ISO (KH2PO4), Merck KGaA, Germany) and calcium nitrate tetrahydrate (≥99.0%, Ca(NO3)2·4H2O, Sigma-Aldrich, USA) were used as precursors. An ammonium hydroxide solution (ASC reagent, 28.0–30.0% NH3 basis (NH4OH), Sigma-Aldrich, USA) was employed to adjust pH. The cleaning and degreasing reagents were acetone (AR® ACS (C3H6O), Macron Fine Chemicals™, Avantor™, USA) and ethyl alcohol [95% denatured, lab grade (C2H5OH), Aldon Company, USA]. As a solvent, technical grade distilled water was used and purchased from ChemWorld.
Material types, specifications, and sample coding used in this study. Values without standard deviation were taken from the manufacturer’s data sheets.

*From manufacturer’s specifications.
In the rest of this manuscript, uncoated (bare) samples are denoted as “material.b” (e.g., PEEK.b) and HA-coated samples as “material-HA” (e.g., PEEK-HA).
Synthesis of hydroxyapatite sol
Two precursor solutions were mixed at room temperature to produce hydroxyapatite (HA) sols with a Ca/P ratio of 1.67. The overall HA sol synthesis procedure is summarized in Figure 1(a). The calcium solution contained 0.0167 mol Ca(NO3)2·4H2O
29
dissolved in 50 ml distilled water. Ammonium hydroxide (2.5 ml of NH4OH) was added dropwise to the solution, while stirring for 30 mins (with pH ≈ 12). The potassium solution contained 0.01 mol KH2PO4 in 50 ml distilled water and was stirred for 30 mins. The potassium solution was added to the calcium solution dropwise, while stirring for 1 hour. Finally, after two hours, 100 ml of HA white sol was produced with a pH approximately equal to 9. Summary of (a) HA sol synthesis and (b) HA coating procedure for all substrates.
Coating procedures
In order to manufacture a flexible PMMA scaffold, cotton fabric was coated with PMMA solution. To coat the cotton fabric (Cotton-PMMA substrates), PMMA filaments were dissolved in acetone (10 g/L) and stirred for 24 h at room temperature. Then, the fabric was coated with the acetone solution (10 g/L) by dip-coating process (withdrawn rate: 10,000 µm/min, immersion time: 20 s, upholding time: 300 s). This process was repeated three times to achieve PMMA coating. The Cotton-PMMA substrates were then coated with three consecutive HA layers, as described in the following paragraph.
Prior to HA coating, all samples were degreased by soaking in acetone, dried in air at room temperature (room T) for 5 min, then dried in an oven at 65°C for 15 min and cooled down to room temperature in the oven. The overall HA coating procedure is summarized in Figure 1(b). HA sol was sonicated for 15 min to get a homogenous solution before the coating process. Overall, an area of 20 cm2 on both sides of each substrate was coated by drop-casting method (15 µl/cm2) at room temperature with 50% humidity with three consecutive HA layers (Figure 1(b)). The adhesion of the liquid sol to the substrate was high enough that the sample could be flipped, and the other side could be covered by the sol as well. These coating conditions were selected based on preliminary tests and previous research on HA-coated meshes. 35 The drying temperature for PEEK meshes and cotton-based fabrics was chosen considering preliminary tests and our previous research (in which it was 150°C). A drying temperature of 90°C was used for cellulose mat samples, based on preliminary drying tests to avoid visible shrinkage and burning. Between tests, the samples were kept at room temperature (22°C) and constant humidity in a Petri dish in a dark place. An area of each substrate was cut for the different characterization tests listed in the following sections.
Chemical composition analysis
Chemical composition and crystallinity were studied by X-ray diffractometer (PANalytical Empyrean) over 2θ range of 5°–80° for powder of coatings (coating scratched of surface of a sample) dried at various temperatures. The crystal structure of the substrates before and after HA coating was also studied by XRD. The test settings were continuous CuKα radiation (λ = 0.1540598 nm) with a step size of 0.02°, generator voltage of 45 kV and tube current of 40 mA. To investigate crystal structure and plane indices of powder of HA coatings (scratched off the substrates’ surface), high resolution transmission electron microscopy (HR-TEM, JOEL JEM-2011), equipped with a bottom-mounted Gatan SC1000 CCD camera, was used with an accelerating voltage of 200 kV.
X-Ray spectroscopy (EDX) point analysis with field emission electron source (FEI QUANTA 3D FEG FIB/SEM), using an accelerating voltage of 20 kV in statistical imaging mode, was also performed to estimate the Ca/P ratio in HA coatings on PEEK and Cellulose 1 substrates.
Microstructure, morphology, and porosity
Microstructure and morphology of uncoated and HA-coated substrates, as well as failure surfaces resulting from tensile tests were analyzed with a field emission electron microscope (FE-SEM, FEI QUANTA 3D FEG FIB/SEM) using an accelerating voltage of 5 kV in secondary electron mode. The fiber diameter distribution for fabric and mat specimens was measured on FE-SEM images using ImageJ (version 1.53e, National Institutes of Health, USA) for 100 randomly selected fibers (n = 100). PEEK meshes exhibited consistent wire diameters as noted above in Materials.
Porosity volume was measured by using the difference between the volume of bulk material and the volume of material in the water. The porosity volume was divided by the bulk volume to calculate the porosity in %. The measurements were repeated three times (n = 3) per sample type.
Mechanical testing
The tensile behavior was evaluated for uncoated and HA-coated samples by using an eXpert 2610 MTS (ADMET, Norwood, MA, USA). Each substrate was cut into a rectangular shape, based on ASTM D638 IV 37 and ASTM D3822-01, 38 for which the cross-sectional area was 8 mm (width) × specimen thickness in mm. This shape was selected based on preliminary tests to ensure failure occurred along the length of the gauge section for all specimen types, and not in the grips. The crosshead speed was 0.5 mm/min with a load cell of 5 kN. Thickness measurements were done using a digital caliper with a precision of 0.01 mm. Thickness data are listed for uncoated substrates in Table 1. For HA-coated substrates, thickness values were within the same range as uncoated samples for Cellulose 1 mats, Cellulose 2 mats, Filter-Paper mats, and PEEK meshes, given the measuring equipment. The thickness increased by 0.15 ± 0.03 mm for Cotton substrates and 0.10 ± 0.02 mm for Cotton-PMMA substrates.
Five specimens were tested for each substrate type. The stress-strain curves were plotted from the load-displacement curves using the initial cross-sectional area of the specimens (width × thickness) to establish a comparison between the different substrates. Three tensile properties were calculated as follows: initial tensile modulus (from the slope of the initial linear region of the stress-strain curves, unless specified otherwise in Mechanical tests), tensile strength (maximum stress achieved during test), and elongation at break or maximum stress (strain value at maximum stress).
Degradation rate
Following characterization explained in Microstructure, morphology, and porosity and Discussion, degradation rate tests were performed on selected sample types for both bare and HA-coated substrates to assess the effect of HA coating and its stability in phosphate-buffered saline (PBS). An area of 2 cm2 was cut from each sample type for degradation tests. For all substrates, degradation rate was calculated based on the weight of samples before immersion and after immersion in PBS (pH = 7.4) at 37°C, for 0, 1, 3, and 7 days. Samples were dried in an oven at 60°C when they were taken out of the solution. Degradation rate was calculated with equation (1):
Statistical analysis
In the results and discussion section, data are reported as the average ±standard deviation. All statistical analyses were performed with GraphPad Prism (version 9.1.2). For mechanical tensile test results on PEEK meshes, paired t-test analysis (comparison between bare and HA-coated specimens) at the significance level of p < 0.05 was used. For fabric and mat specimens, to assess significance between bare and HA-coated specimens, as well as between material types, two-way analysis of variance (ANOVA), followed by Tukey’s multiple comparisons test, was carried out with α = 0.05.
Results and discussion
Chemical composition and phase analysis
HA powders were collected from both sides of HA-coated substrates by lightly scratching the coating off with a razor blade. HA powders were scratched off different substrates that were dried in an oven for 1 hour at 90°C or 150°C.
X-Ray diffraction patterns are presented in Figure 2(a) for both drying temperatures. Characteristic peaks for HA powders derived at 90°C or 150°C confirm a pure crystalline hydroxyapatite phase, consistent with standard database (JCPDS 09-9432). At both temperatures, diffraction patterns mostly show the peaks for pure crystalline HA. They also reveal peaks for decomposed compounds of HA, such as β-tricalcium phosphate (214, 217, and 220) (β-TCP) and CaO (200). The peaks for HA-150°C have higher intensity than those for HA-90°C in Figure 2, showing higher temperature could affect crystallinity and induce a crystal structure with more aligned atomic planes. Three calcium phosphate phases was obtained after calcination, from the calcium-deficient hydroxyapatite solution: pure HA, β-TCP, and CaO.
39
Typically, β-tricalcium phosphate (β-TCP) is most likely formed for powders from HA sol because the samples were dried at a temperature lower than 1,000°C.
40
Overall, for this study, it is confirmed that low drying temperatures, suitable for polymeric substrates (with glass transition temperature below 150°C), can create HA coatings with the same crystalline structure as those formed under higher drying temperatures.
41
XRD patterns for (a) powders of HA coating scratched from surface of cellulose mat dried at 90°C (HA-90°C, bottom pattern) and PEEK mesh dried at 150°C (HA-150°C, top pattern). (b) XRD patterns for all substrates before and after applying HA coating. For each material, the upper pattern is for uncoated substrate and the lower one is for HA-coated substrate. The HA coating was scratched off the substrate before the test to minimize the overlapping of HA peaks with substrate peaks.
XRD tests were also done for substrates before and after applying HA coating and drying in the oven, to see if HA composition or drying temperature may affect their structure. For HA-coated substrates, the coating was scratched off the surface before XRD to minimize the overlapping of HA peaks with substrate peaks. As shown in Figure 2(b), the characteristic peaks for all bare cellulose mats (Cellulose 1, Cellulose 2, and Filter-Paper), Cotton, and Cotton-PMMA are the same, as they all consist of cellulose. The peaks show the cellulose crystal structure located at 15.1°, 17°, 22.6°, and 25.5°, related to the planes (101), (10
PEEK substrates presented a stable crystal structure after the treatment at 150°C with characteristic peaks at 18.9°, 22.6°, and 28.5°, related to the planes (110), (200), and (211), respectively.46,47 There was a slight reduction in peaks intensity, but the crystallinity index was almost the same: 11% for uncoated and 10% for HA-coated.
EDX point analysis was done to verify the nature of the coating observed under FE-SEM. Two representative samples (PEEK and Cellulose 1), dried at two temperatures (90°C and 150°C), were chosen for the analysis. The results for elemental distribution of Ca and P on HA-coated PEEK and Cellulose 1 showed the Ca/P ratio varied from 1.38 to 1.68. As there are three different compounds in the coating (HA, β-TCP, and CaO) and the substrates consist of carbon, hydrogen, and oxygen, the Ca/P ratio is not necessarily a good estimate for the calcium compound formed in the coating. All three compounds contain calcium, while the substrates contain a high amount of carbon. While 1.68 is close to the Ca/P ratio for pure HA (1.67), the results obtained from XRD (Figure 2) and HR-TEM are more reliable. HR-TEM pictures were captured to characterize the nanocrystal shape of powders of HA coating dried at various temperatures, and the interplanar spacing of the most intense reflections (Figure 3). HA nanorods are visible in Figure 3(a) (red arrow) with lengths from 16 nm to 19 nm and diameters from 5 nm to 7 nm for dried coating at 90°C. For dried coating at 150°C (Figure 3(c)), nanorod lengths from 40 nm to 90 nm (red arrow) and diameters from 8 nm to 16 nm are observed. Those values show the effect of higher drying temperature, which resulted in longer HA nanorod crystals. Figure 3(b) and (d) reveal the nanostructure of the HA powder, which presents pure HA plane spaces equal to d = 0.81 nm (001), d = 0.34 nm (002),
48
and d = 0.31 nm (102)
49
for both 90°C and 150°C. Those results confirm similar nanostructure to the one obtained for HA powders dried at higher temperature (700°C).
35
Representative HR-TEM images for HA coating powders (scratched off from substrates’ surface) dried at various temperatures: (a, b) 90°C (red arrow in a indicates nanorod length), (c, d) 150°C (red arrow in c indicates nanorod length). Pure HA plane spaces of d = 0.81 nm (001), d = 0.34 nm (002), and d = 0.31 nm (102) are marked in panels b and d. Scale bar is 50 nm for (a, c) and 20 nm for (b, d). Images in inset correspond to diffraction patterns with a scale bar of 10 nm−1.
Microstructure and morphology
In this section, the qualitative observations from FE-SEM pictures were combined with image analysis for HA coating coverage quantification on PEEK mesh and fiber diameter distribution for cellulose fabric and mats. FE-SEM images were captured with various magnifications to study the differences between bare and HA-coated substrates. PEEK meshes are shown in Figure 4(a) and (b), where individual PEEK filaments are clearly observed in a plain weave pattern. Based on FE-SEM images (Figure 4(b)), the filaments peaks at the wire junctions display a rougher microstructure, likely due to the weaving procedure or post-processing steps (i.e., packaging, transportation, etc.). After HA coating (Figure 4(c) and (d)), coated and some uncoated areas on the mesh are visible. Although back scatter imaging mode is preferable to more easily distinguish between coated and uncoated areas, the high voltage surface charging limited the imaging procedure and quality. Thus, secondary electron mode was used. HA coating coverage appears generally uniform, with the exception of a few wire peaks (Figure 4(c), arrow). Coating delamination occurred below the fiber junctions (Figure 4(d)), as the accumulation of HA sol at this location led to thicker coating, which would crack and delaminate due to high internal stresses during coating drying in the oven.
50
Image analysis of HA-coated PEEK meshes revealed the following average data: (1) uncoated filament area of 6.6% ± 1.0% and (2) open area of 52.4% ± 3.2% (compared to 56% total open mesh area, as per manufacturer’s specifications). The highest thickness for the HA coating on PEEK mesh was about 4.5 µm, based on the delaminated HA coating at the fiber junctions. FE-SEM images in secondary electron (SE) modes for bare and HA-coated substrates (dashed rectangles are zoomed in areas in adjacent images to the right): (a, b) uncoated PEEK mesh, (c, d) PEEK-HA mesh with arrow pointing at uncoated area in c (on average, uncoated filament area of 6.6% ± 1.0%, and open area of 52.4% ± 3.2%), (e, f) uncoated cotton fabric, (g, h) cotton-HA with arrow pointing at HA block in h, (i, j) uncoated cotton-PMMA fabric, and (k, l) cotton-PMMA fabric with delaminated HA coating in l.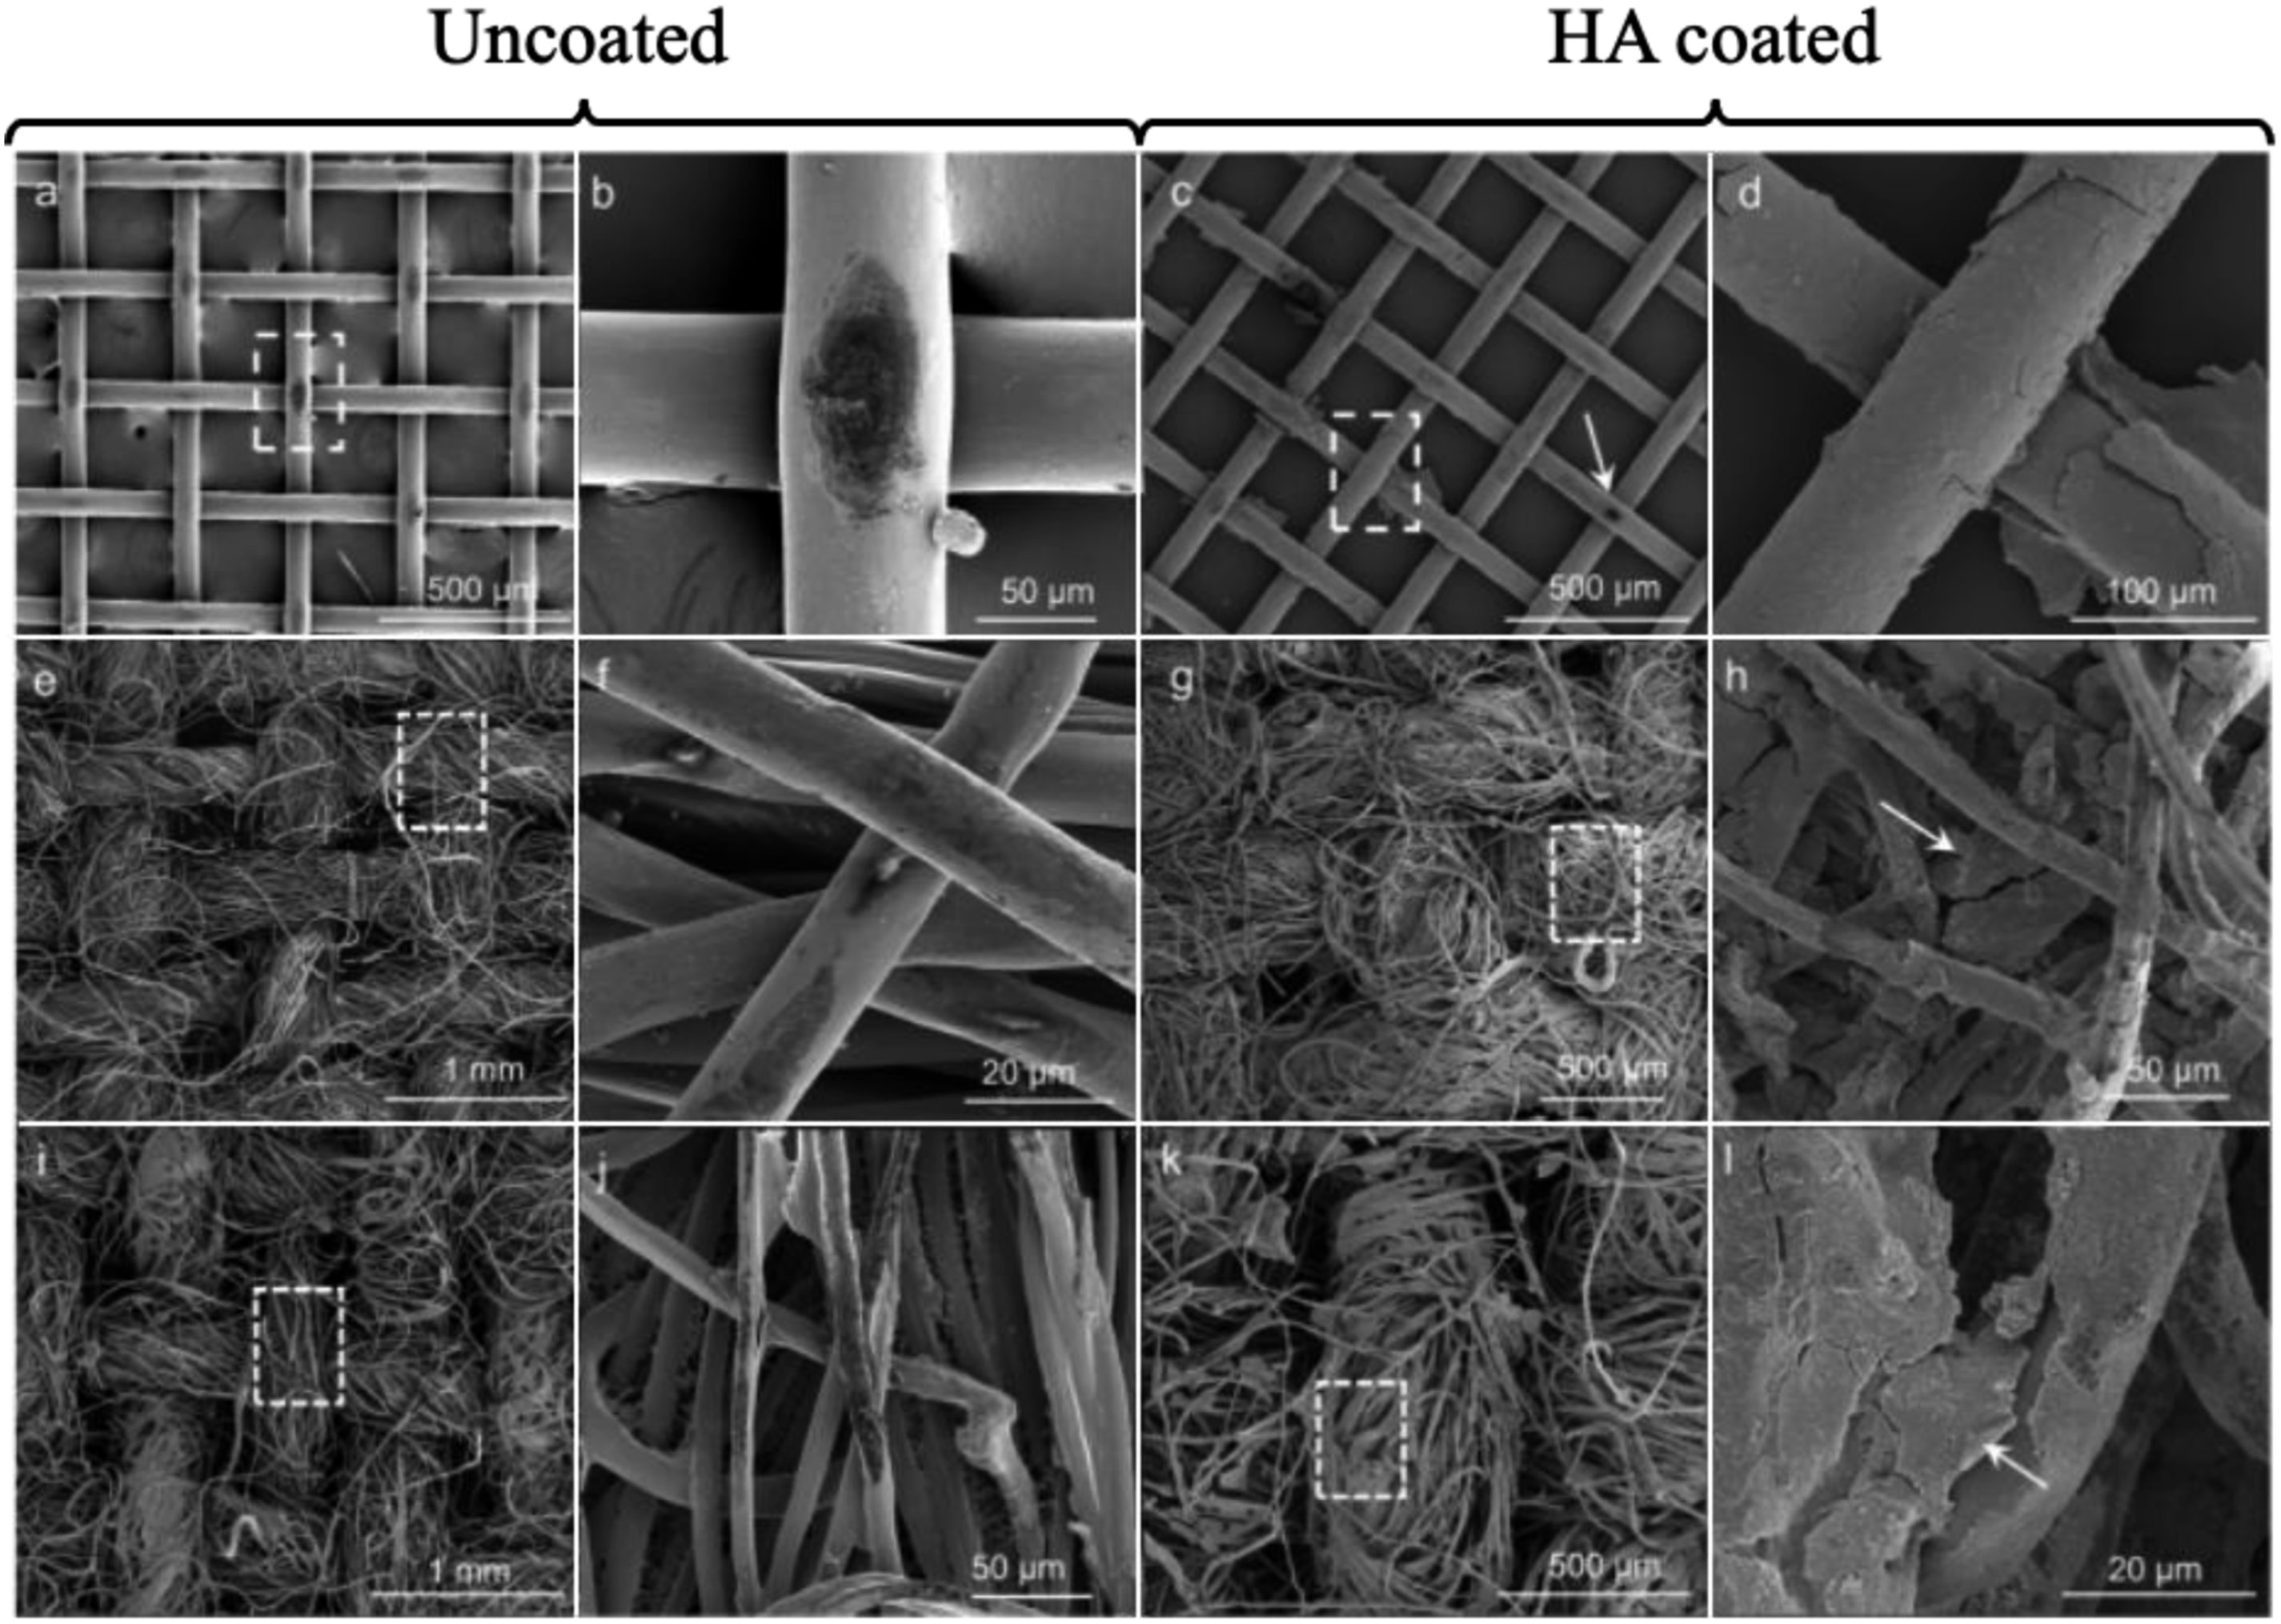
Cotton fabric substrates consist of fiber tows in an even weave pattern, as shown in Figure 4(e) and (f) before coating. The fiber diameter distribution is summarized in Figure 6(a) for n = 100. Three layers HA coating partially filled the porous areas between fibers, as seen in Figure 4(g) and (h). In some cases, HA blocks with a width around 50 µm formed in the areas between fibers (Figure 4(h), arrow). For Cotton-PMMA fabrics, PMMA solution was absorbed by and covered individual fibers, without any visible delamination (Figure 4(i) and (j)). Figure 4(l) shows both adhesive and delaminated HA coating on Cotton-PMMA fabric (see arrow), in which the porous areas between fibers are less occupied by HA blocks, compared to Figure 4(h). This is the result of lower adsorption of HA sol by Cotton-PMMA fibers, as PMMA is water repellent.
For cellulose mats, randomly oriented fibers with different diameters are shown in Figures 5(a)–(l) and 6(b)–(d). Mats appear dense, with the highest areal density for Filter-Paper in Figure 5(a), according to Table 1. HA coating is generally not uniform with the presence of several HA blocks (Figures 5(c), (d), (g), (h), (k), (l)). Lower oven drying temperature for the cellulose mats (90°C), compared to 150°C for PEEK mesh and cotton fabric, resulted in smaller HA blocks. The smallest HA block size (less than 5°µm) was observed and measured for the Filter-Paper substrates (Figure 5(d), arrow). There is no clearly visible difference between Cellulose 1 and Cellulose 2 mats in terms of morphology, except the range of fiber diameter is wider for the former (Figure 6(c) and (d)). FE-SEM images in SE modes for representative bare and HA-coated cellulose mats (dashed rectangles are zoomed in areas in adjacent images to the right): (a, b) uncoated Filter-Paper, (c, d) HA-coated Filter-Paper with arrow pointing at HA block in d, (e, f) uncoated Cellulose 1 mat, (g, h) HA-coated Cellulose 1 mat, (i, j) uncoated Cellulose 2 mat, and (k, l) HA-coated Cellulose 2 mat. Fiber diameter distribution for (a) cotton fabric with inset image from Figure 3 (b) Filter-Paper mat with inset image from Figures 4(a), (c) Cellulose 1 mat with inset image from Figures 4(e), and (d) Cellulose 2 mat with inset image from Figure 4(i) (n = 100 for all substrates).

Porosity measurements
Figure 7 shows the measured porosity before and after HA coating on each type of substrate. PEEK mesh showed little variation after coating because it did not significantly cover open areas, as observed and calculated based on Figure 4(c). The porosity for fabric specimens (Cotton and Cotton-PMMA) decreased with both PMMA and HA coating. As PMMA impregnated the fabric, it occupied porous areas. Similarly, as previously mentioned for Figure 4(h) and (l), HA coating further settled into porous areas, therefore further reducing overall porosity of the fabric. Finally, cellulose mats, as commercially received, possessed decreasing porosity (Cellulose 1 > Cellulose 2 > Filter-Paper). After HA coating, porosity reduced for Cellulose 1 and Cellulose 2, while it slightly increased for the Filter-Paper. Based on statistical analysis (one sample t-test, two-tailed), this difference for Filter-Paper is significant at p < 0.05. Uncoated Cellulose 1 and Cellulose 2 have higher porosity, but lower thickness and areal density (40 µm) than Filter-Paper (see Table 1). Thus, the HA solution could diffuse through the mats, cover the fibers, and fill the pores in Cellulose 1 and Cellulose 2. For Filter-Paper, its higher thickness and areal density hindered the HA solution to diffuse into the bulk of the material and to intertwine with fibers. On the other hand, Filter-Paper should filter out particulate solutions, which means keeping HA particles on the surface. Knowing that Ca in HA can react with hydroxyl groups (OH) in cellulose fibers to make CaOH or Ca(OH)2,51–53 it is possible that Ca attracted parts of the cellulose chains on the surface of the Filter-Paper, resulting in mass loss. In addition, as HA particles could not intertwine in the bulk structure, an HA coating with low adhesion was derived on the surface (Figure 5(c) and (d)), which could delaminate during handling. The chemical reaction between Ca and hydroxyl groups and physical delamination of HA coating and Ca compounds could result in fibers loss at the surface, which could increase porosity. Measured porosity for each substrate type (bare and HA-coated): PEEK mesh, and cellulose-based fabrics and mats.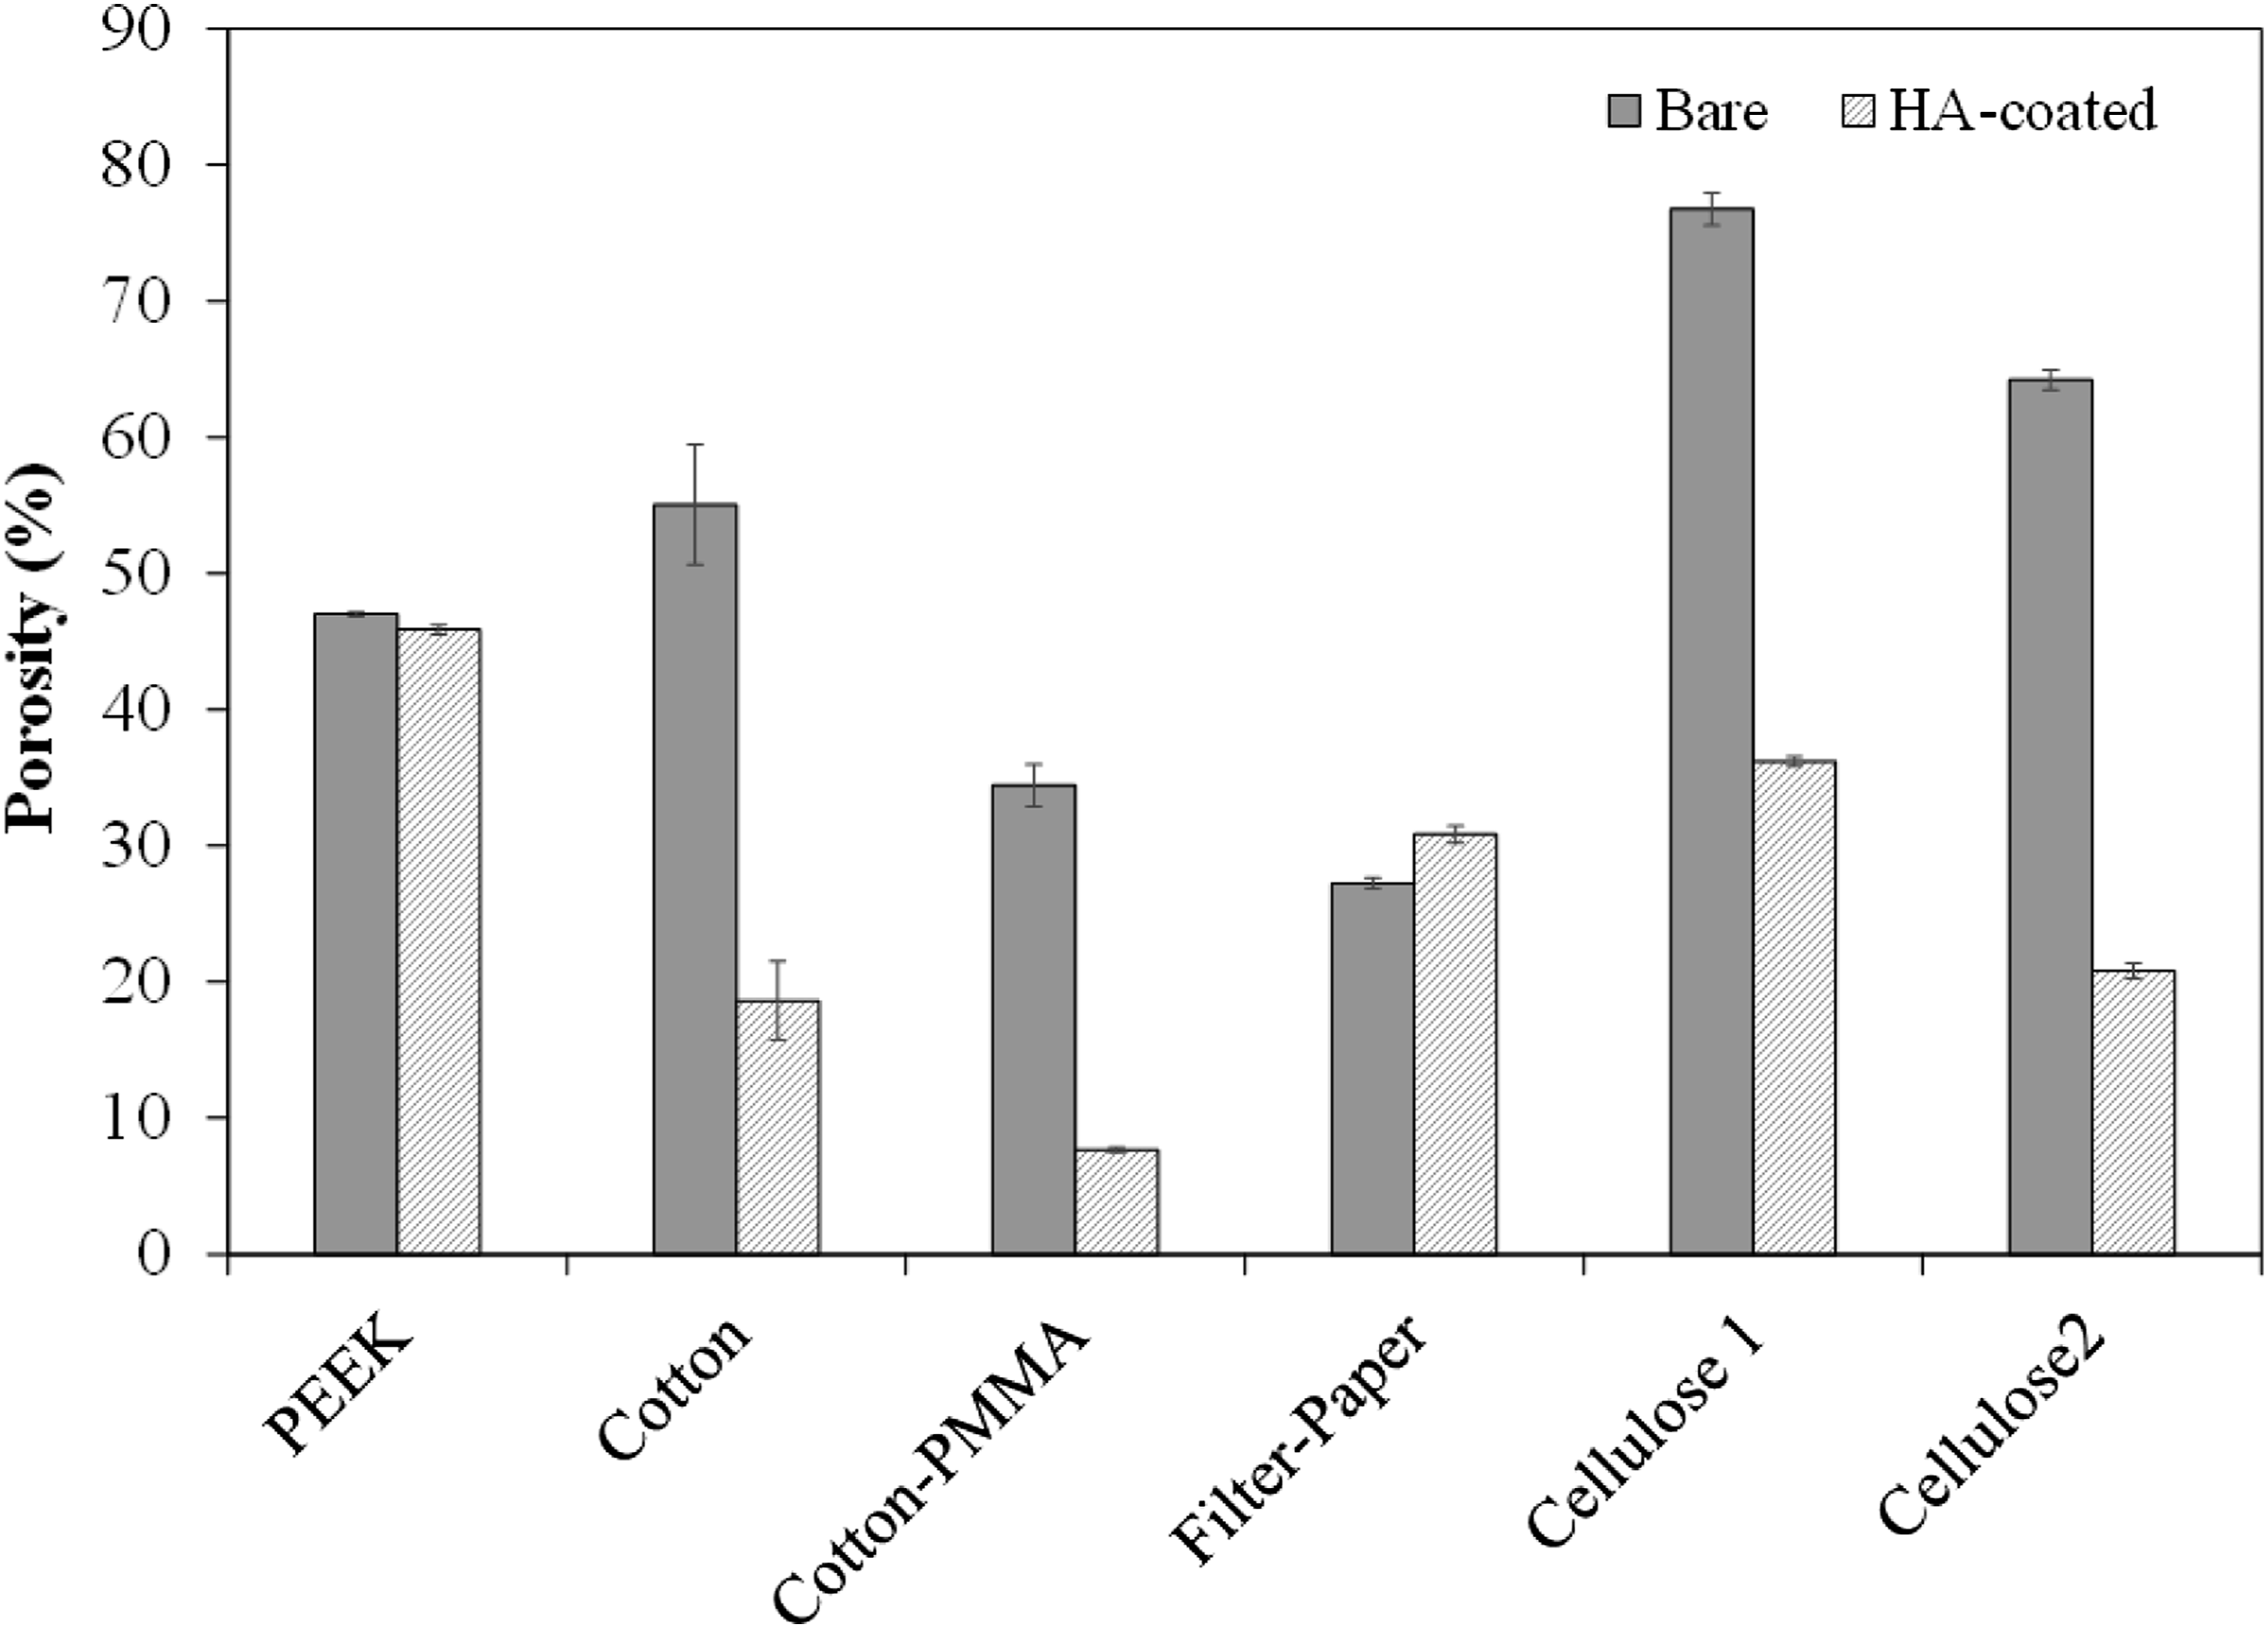
Mechanical tests
Tensile tests were performed for all materials (mesh, fabric, and mat), bare and HA-coated. Representative stress-strain curves until failure are presented in Figure 8, Figure 9, and Figure 10. Photographs of the tested samples are shown in inset with the failure location boxed in red. The curves display different behaviors depending on the material and its form. PEEK meshes exhibit a behavior similar to monofilament woven fabrics (Figure 8) 14,54: initial linear behavior followed by change of slope and linear stress increase until failure initiation, then progressive wires failure (in the warp direction). Fabric specimens (Figure 9), due to their initial flexibility, first go through a tows straightening phase, followed by linear behavior until progressive failure of filaments and tows. This is typically observed for woven fabrics tested under tension.
55
Therefore, their tensile modulus was calculated based on the linear region of the stress-strain curves. Finally, cellulose mat specimens (Figure 10), due to the random fiber orientation and distribution of their diameters, generally display a non-linear behavior with tearing failure. Representative stress-strain curves for bare and HA-coated PEEK mesh samples, with torn region boxed in red in inset. Representative stress-strain curves for (a) bare and HA-coated cotton fabric samples, with torn region boxed in red in inset, and (b) bare and HA-coated cotton-PMMA fabric samples, with torn regions boxed in red in inset. Representative stress-strain curves for bare and HA-coated cellulose mat samples (Cellulose 1, Cellulose 2, and Filter-Paper), with torn regions boxed in red in inset.


From those curves, the following mechanical properties were calculated or determined (as described in Mechanical testing): tensile modulus (Figure 11(a)), tensile strength (Figure 11(b)), and strain at break or maximum stress (Figure 11(c)). Direct comparison between materials and specimen types shows the highest tensile modulus values were obtained for PEEK meshes (Figure 11(a)) and cellulose filter-paper mats (likely due to their denser fiber packing and more consistent fiber diameter compared to Cellulose 1 and Cellulose 2 mats, (Table 1, Figures 6(b)–(d) and 7). Highest tensile strength and strain at break values were achieved for PEEK meshes (Figure 11(b) and (c)), as expected based on PEEK bulk properties.
56
The effect of HA coating appeared to be negligible for all materials, except cellulose mats, more specifically for tensile modulus (Figure 11(a)). Out of all tested materials, cellulose mats displayed the largest standard deviation values, likely resulting from the wide range of fiber diameter distribution (Figure 6(b)–(d)). A more in-depth discussion regarding tensile behavior and mechanical properties for each specimen type, for bare and HA-coated specimens, is presented in Discussion. (a) Average tensile modulus, (b) Average tensile strength, and (c) Average elongation at maximum stress for all materials (bare and HA-coated). Statistical significance between pairs is shown in Table 2 in Discussion.
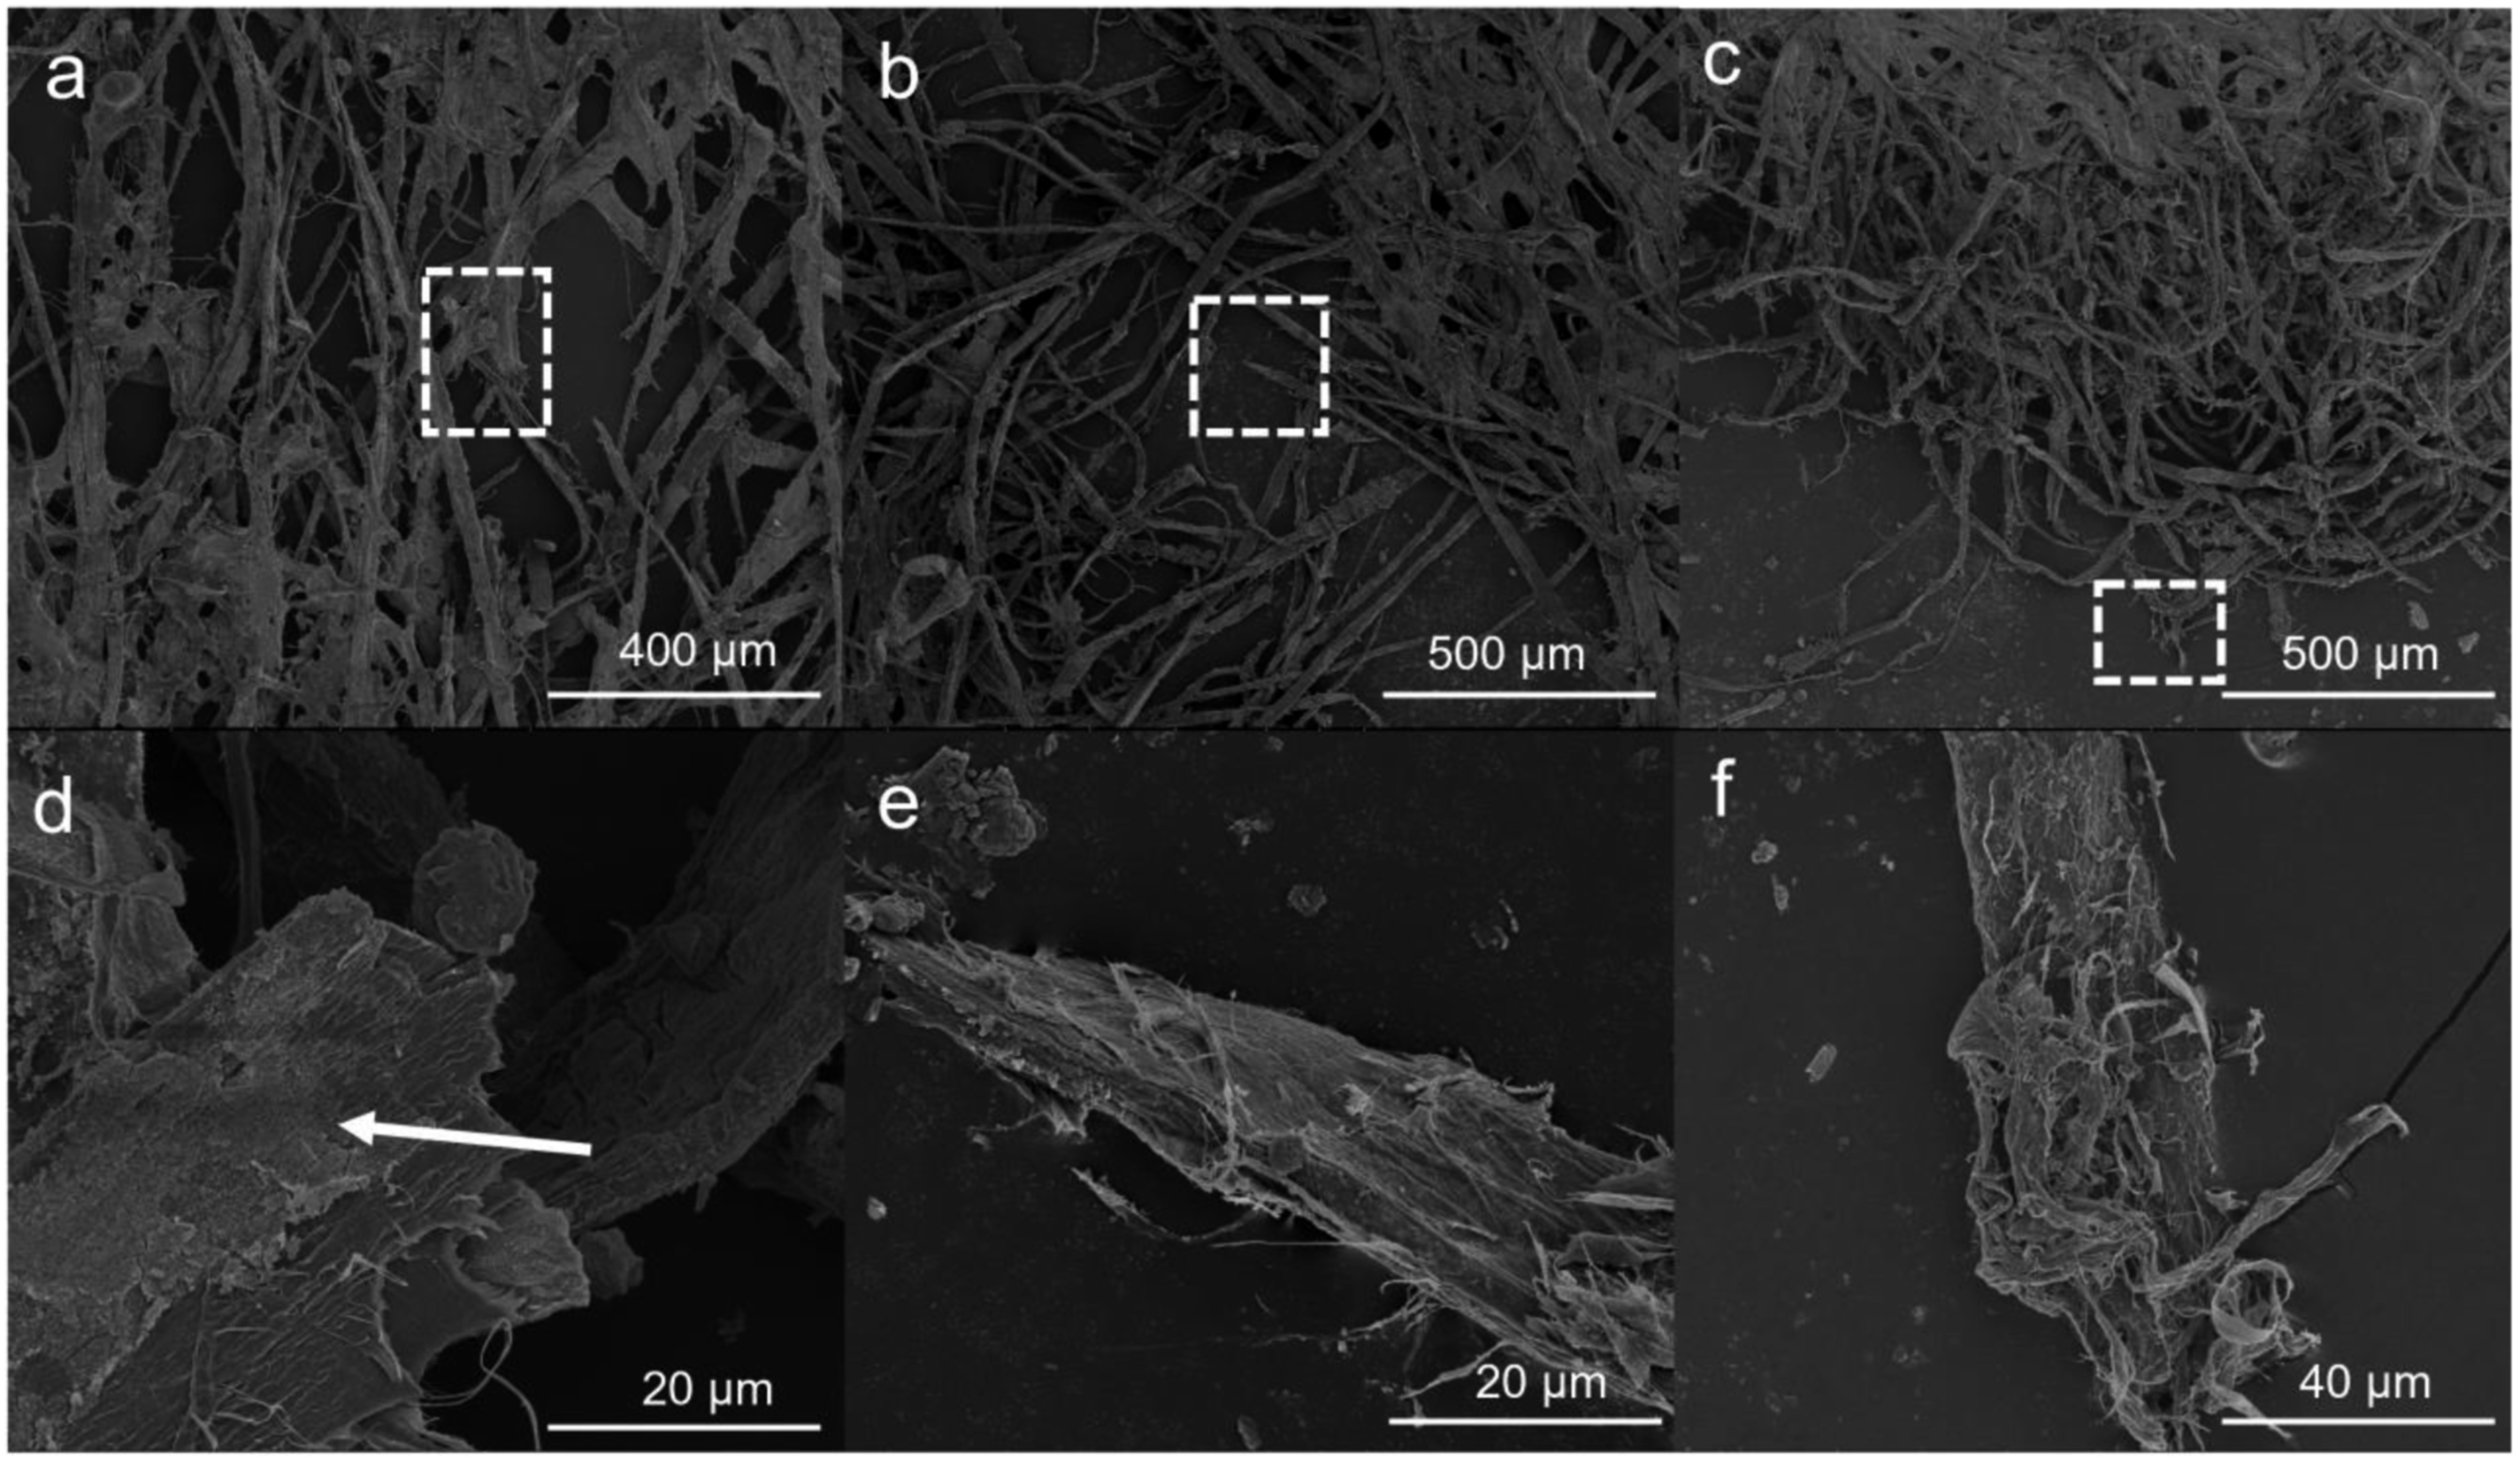
FE-SEM images of torn sections shown in inset in Figures 8 and 9 are represented in Figure 12 for PEEK mesh and cotton fabrics. Torn sections from Figure 10 are shown in Figure 13 for cellulose mats. White arrows in Figures 12 and 13 indicate presence of HA coating. It is to be noted, however, that there are limitations regarding imaging, such as poor contrast between substrate and coating (as explained in Microstructure, morphology, and porosity), especially for Cellulose 1 and Cellulose 2 mats (Figure 13(e) and (f)). HA coating appears to have partially remained stable after tensile tests for half of the cases (Cotton, Cotton-PMMA, and Cellulose 1). For other substrates, this could be a result of coating delamination during tensile tests or non-uniform coverage before tensile tests. Overall, tearing of all substrates was initiated by the breakage of a few fibers, leading to a decrease in tensile stress, as observed in Figures 8−10. Representative FE-SEM images (SE mode) for HA-coated torn sections after tensile tests: (a) wire from PEEK mesh, (b) single filament from cotton fabric, and (c) single filament from cotton-PMMA fabric. Scale bar is 50 μm in (a, c) and 20 μm in (b). Higher magnification images after fracture are shown in Figure 8 and Figure 9. Representative FE-SEM images (SE mode) for HA-coated torn sections after tensile tests (dashed rectangles are zoomed in areas shown in bottom row images): (a) Cellulose 1, (b) Cellulose 2, (c) Filter-Paper, (d) zoomed in rectangular area in (a), (e) zoomed in rectangular area in (b), and (f) zoomed in rectangular area in (c). Scale bar is 400 μm in (a), 500 μm in (b, c), 20 μm in (d, e), and 40 μm in (f).
Degradation rate
Based on the porosity measurements, three substrate types were selected for degradation rate characterization: PEEK mesh, Cotton-PMMA fabric, and Cellulose 1 mat (high, medium, and low porosity). Degradation rate for bare and HA-coated substrates was calculated by measuring the weight of remaining material after immersion in PBS for various durations (1–7 days). Figure 14 shows the degradation rate increased by day 3, but decreased by day 7 for all uncoated and HA-coated samples. It is expected that all samples may have lost fibers, fibrils, and/or sections of HA coating after day 1 and day 3. In contrast, after day 3, they may have gained ions or compounds in PBS, such as NaCl, KCl, Na2HPO4, and KH2PO4, replacing the lost mass. It is also possible for HA-coated substrates to gain compounds of calcium (bone-like minerals) on the scaffold as the calcium in the hydroxyapatite coating reacted with PBS ions and deposited new calcium compounds.57,58 This shows potential stability of the substrates in biofluids for an extended period of time. Degradation rate (%) over time for bare and HA-coated substrates (PEEK mesh, cotton-PMMA fabric, and Cellulose 1 mat) after immersion in PBS at 37°C. Dashed lines were added for visualization purposes.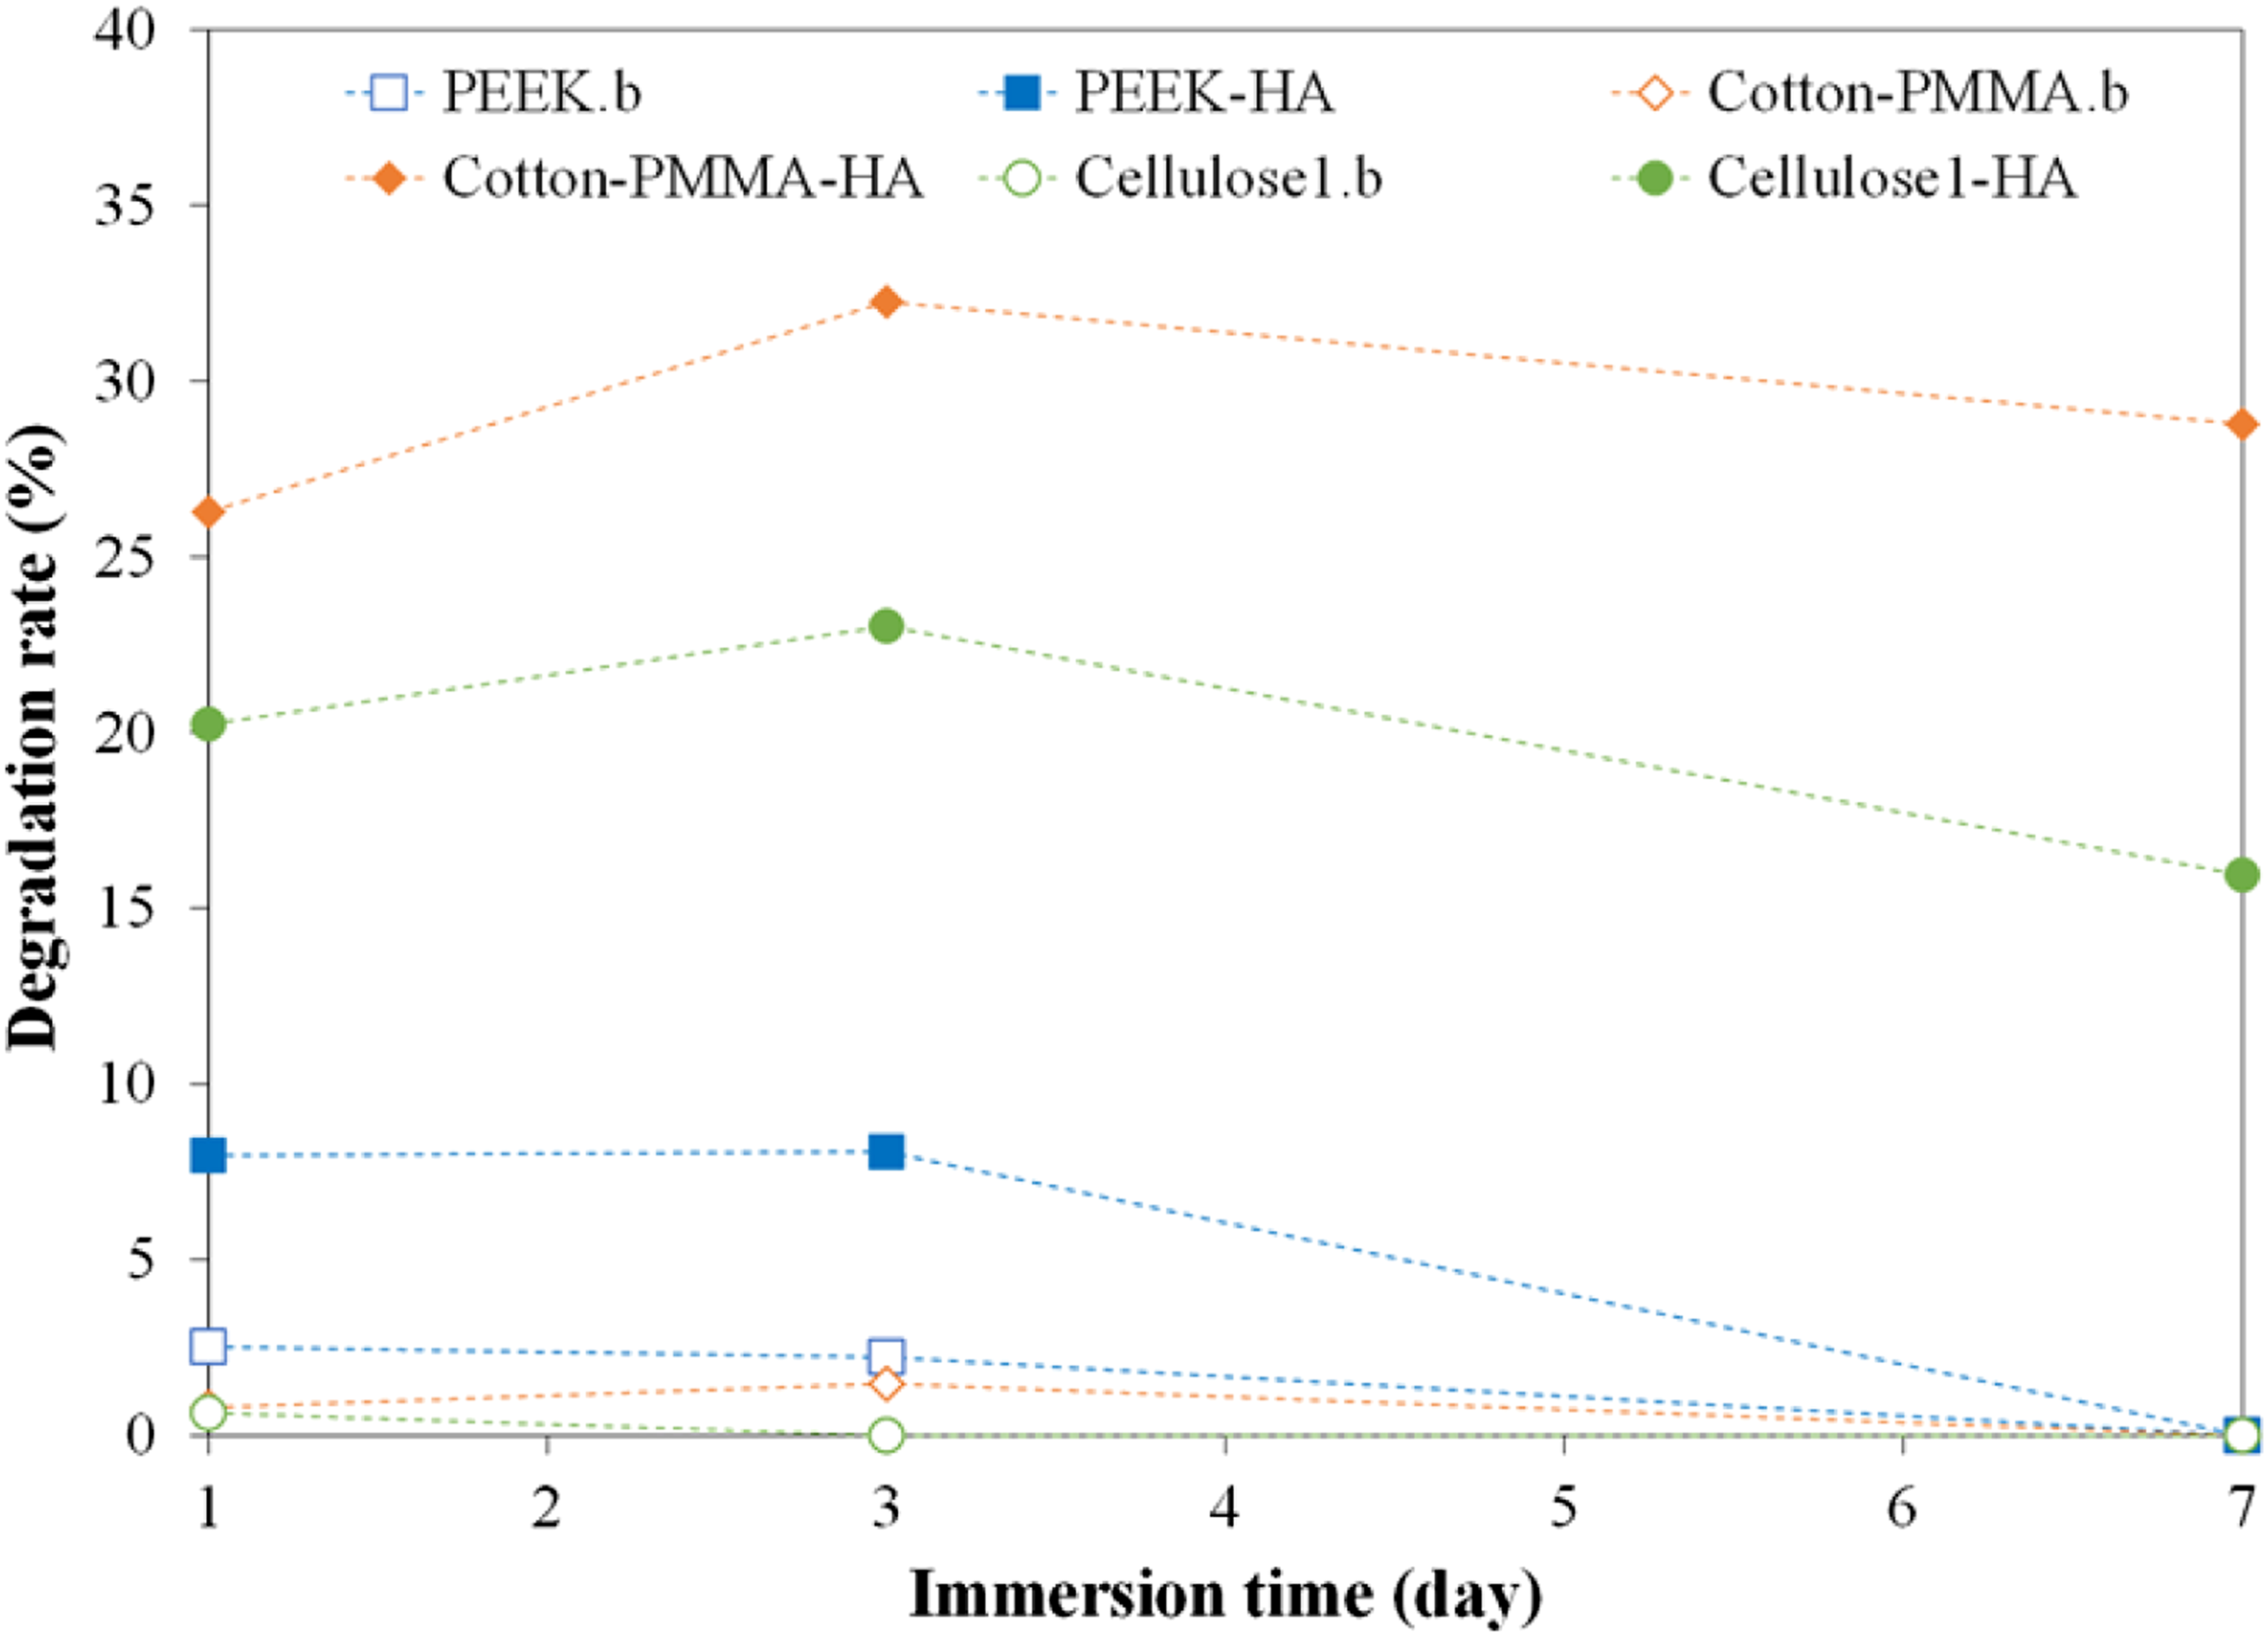
Degradation rate for HA-coated substrates is higher than bare ones, as HA coating can detach more easily than substrates’ fibers or fibrils during immersion. This can be expected from Figures 4(d) and (l), Figure 5(h), Figure 12, and Figure 13. Areal weight measurements before (Table 1) and after HA coating showed that PEEK meshes displayed a lower increase, compared to Cotton-PMMA and Cellulose 1 (4% vs. 10%–12%). This is likely due to the large pore size of the mesh, which cannot be covered by HA coating. HA-coated Cotton-PMMA has the highest degradation rate followed by Cellulose 1, which could be due to more exposed HA-coated area and smoother PMMA-coated surface (compared to cellulose fibers), facilitating coating detachment.
Discussion
Mechanical behavior of different substrate types
PEEK mesh specimens displayed the most deviation from generally expected properties for bulk PEEK.
59
This is partly based on the use of the cross-sectional area (width × thickness) to calculate properties, which ignores the actual wire area sustaining tensile load. Corrected stress-strain curves and tensile properties were estimated based on open area, shown in Figure 15(a)–(c). Those values are comparable to 3D printed PEEK specimens, which is a format similar to the mesh specimens, as both types are made from PEEK filaments.60,61 In the literature, properties were found to vary from 0.25 GPa to 4 GPa for tensile modulus, from 5 MPa to 100 MPa for tensile strength, and from 2% to 135% for strain at break. For mesh specimens, tensile strength and strain at break values are on the mid-end of those ranges, while tensile modulus is on the low-end (for bare and HA-coated specimens). (a) Corrected stress-strain curves for bare and HA-coated PEEK mesh samples, (b) Average tensile modulus, and (c) Average tensile strength. Strain at break values are the same as presented in Figure 10c.
A few factors play a role in the tensile behavior of mesh specimens, compared to literature. The first one is particular to mesh testing, which may affect the stress-strain behavior. One challenge with tensile testing of the mesh specimens is the alignment of individual wires, even when tabs are used. This means tensile load may not be evenly distributed across all filaments, leading to consecutive failure of individual wires that were unevenly strained. This is confirmed by the progressive wire failure behavior seen in Figures 8 and 15(a). This behavior was also observed in the literature for tensile testing of a number of plain weave fabrics, such as polyethylene terephthalate. 54 The second factor is related to the degree of crystallinity of the PEEK filaments, which affects mechanical properties.60,62 As it increases, tensile modulus and strength are improved since polymer chains are organized and aligned along the filament axis. On the other hand, crystallinity reduces strain at break as the chains are already stretched along the filament length. Therefore, a direct comparison with literature may not be possible as thermal history is not known for all cases.
As observed in Figure 11, cellulose mats (Cellulose 1, Cellulose 2, and Filter-Paper) show large variations among themselves, especially for tensile modulus. Cellulose-based fabrics and mats present a wide range of mechanical properties in the literature.5,63–65 There are several factors playing a role in those variations for cellulose mats, namely, fiber diameter, fibrous network density or fiber content, and fiber alignment. Various models and experimental results in the literature showed an increase in the tensile modulus with fiber orientation from random to aligned, and with fiber content. 66 Overall, fiber diameter distribution range was most similar between Filter-Paper and Cellulose 2 (Figure 6(b)–(d)), with average diameters equal to 15.53 ± 4.54 μm (Filter-Paper), 16.36 ± 5.43 μm (Cellulose 1), and 16.19 ± 4.27 μm (Cellulose 2). For uncoated Cellulose 1 and Cellulose 2 mats, their mechanical properties did not show significant differences. Filter-Paper specimens, however, possessed lower porosity and higher areal density than Cellulose 1 and 2 (Figure 7 and Table 1), corresponding to a higher fiber content and likely leading to increased tensile modulus, as seen in Figure 11(a). Similarly, the maximum tensile strength was obtained for Filter-Paper specimens, with average strengths below 5 MPa for Cellulose 1 and 2 mats. In general, tensile strength may depend on testing parameters (e.g., strain rate) and fibrous mat microstructure. It is to be noted that out of all tested cellulose-based materials, cellulose mats displayed the largest standard deviation values for tensile modulus, compared to cotton fabrics, likely resulting from the wider range of fiber diameter distribution (Figure 6) and their random planar fibrous microstructure.
Strain at break values were lowest for cellulose mats (less than 5%), while cotton fabrics were in the 20–25% range. This may be due to the microstructure of the fabric, composed of tows made of several individual fibers. Under tensile load, those fibers realigned themselves, and similarly to the PEEK mesh, may have sustained uneven load distribution, leading to progressive failure (observed in Figure 9). This is also confirmed by looking at the specimens after tensile tests in inset in Figure 9, where complete tow failure did not occur, comparable to the PEEK mesh (Figure 8), while the cellulose mats displayed tearing failure (Figure 10).
Effect of HA coating on mechanical behavior
Summary of p-values from analysis of variance (ANOVA) on mechanical properties for main comparison pairs with Tukey’s test (α = 0.05).

Overall, out of all materials tested in this study, and based on their mechanical properties after HA coating, Cellulose 1 mats could be suitable for low-load bearing applications, because of their moderate elastic modulus (up to 1.0–1.2 GPa), but low tensile strength (< 10 MPa). For instance, it was reported that proximal tibia and proximal femoral bones possess elastic modulus and tensile strength values around 440 MPa–445 MPa and 5 MPa–7 MPa, respectively. 67 As PEEK meshes displayed tensile strength up to 800% higher than all other materials (Figure 15(c)), they could be candidates for load bearing applications, provided increased stiffness. This could be accomplished by combining a few methods: (1) post-annealing of the meshes to increase their crystallinity and (2) reinforcement through HA filler or short carbon fibers. However, when discussing potential for implant applications and bone regeneration, mechanical properties are not the sole consideration. Biocompatibility comes into play, including cell viability, proliferation, and extra cellular matrix growth. For instance, previous work on flexible, HA-coated metallic meshes showed that mesh size (i.e., open areas) had an effect on extracellular matrix development. 35 Therefore, PEEK meshes and cellulose mats should be considered for future biocompatibility studies.
Conclusion
In this study, flexible PEEK and cellulose-based scaffolds with potential for bone regeneration were studied. PEEK meshes, Cotton and Cotton-PMMA fabrics, and cellulose mats were investigated with respect to their mechanical behavior, with and without HA coating. First, it was demonstrated that HA adhesive coating could be synthesized by sol–gel method at low temperatures (90°C and 150°C) for compatibility with polymeric substrates without significantly affecting their crystalline structure. The nanostructured coating consisted of HA, β-TCP, and CaO for both temperatures. Crystallinity index for all substrates before and after coating was measured, in which there was no significant change for PEEK, while cellulose mats and cotton-based fabrics presented a small reduction in peak intensity with 3%–5% reduction in crystallinity index. Second, after HA coating, morphology analysis showed HA coating coverage in PEEK, Cotton and Cotton-PMMA samples, while HA block formation was observed on cellulose mats. Porosity of most substrates decreased by up to 43%, indicating effective coating. Filter-Paper cellulose mats were, however, not well suited for HA coating, as they filtered out the sol during the process. Third, uncoated, and HA-coated substrates’ degradation in PBS decreased after day 3, as a result of ion precipitation or calcium compounds formation, showing potential stability in biofluids for an extended period of time. Finally, HA coating did not significantly affect the tensile properties of the specimens, except for the following cases: Cellulose 1 (tensile modulus increased by 270% and strength by 210%) and Filter-Paper (strength decreased by 12.5%). As Cellulose 1 possessed the highest porosity and the widest fiber diameter distribution, it is expected that HA coating would have a more significant effect on mechanical properties as it reduced porosity by over 40%. The increase in tensile modulus could be attributed to an increase in rigidity, resulting from the adhesion between HA coating and cellulose fibers. Out of all substrates, PEEK meshes possessed the highest tensile strength and elongation at break (approximately 80 MPa and 35%, respectively), Therefore, overall, HA-coated Cellulose 1 mats and PEEK meshes show promise as flexible scaffolds for implant applications and bone regeneration as future work. Cellulose mats possessed a moderate tensile modulus (up to 1.0–1.2 GPa) and low tensile strength (< 10 MPa), making them suitable for low-load bearing applications. PEEK meshes, due to their higher tensile strength (by up to 800%), could be candidates for higher load bearing applications, provided increased stiffness. This could be accomplished by combining thermal treatment and reinforcing the matrix with nano-filler or short fibers.
Footnotes
Acknowledgments
The authors would like to acknowledge Dr Guoqiang Li, Dr Xiaming Feng, and Siavash Sarrafan from the Department of Mechanical Engineering at Louisiana State University for mechanical testing equipment and assistance with experiments. Finally, we would like to thank Drs Dongmei Cao and Yang Mu for electron microscopy imaging, and Dr Xiaochu Wu for XRD testing.
Declaration of Conflicting Interests
The author(s) declared no potential conflicts of interest with respect to the research, authorship, and/or publication of this article.
Funding
The author(s) disclosed receipt of the following financial support for the research, authorship, and/or publication of this article: This work was partially supported by the Louisiana Board of Regents (LaBOR) Research Competitiveness Subprogram [contract LEQSF(2018–2022)-RD-A-05].