
Abstract
This article aims to investigate the effect of dispersion and uniformity of fiber length distribution on the rheological and mechanical behavior of polypropylene reinforced with short glass fiber. The composites were prepared through melt compounding with three various glass fiber concentrations using a twin-screw extruder. Multiple extrusion processing was used to alter and manipulate the fibers’ length inside the composites. The fiber length distribution was analyzed via the photomicrograph technique. Rheological measurements indicated that the molten samples were visco-plastic fluids and the Herschel–Bulkley model is the best model for fitting on the rheological behavior diagram. Variables of the fitted model are noticeably altered by the fiber length distribution. Moreover, rheological assessments revealed that the non-Newtonian behavior of the molten composites significantly diminished after the second extrusion processing, while it did not have much effect on the fiber length reduction. In the second phase, tensile and flexural properties were determined to detect the mechanical properties. The results indicated that the tensile strength of the composite has a direct relation with the fiber length distribution factor while the flexural strength is independent of fiber length. Furthermore, the highest tensile and flexural strength attained from the composite containing the highest fiber volume fraction.
Keywords
Introduction
Nowadays, many research and industrial developments have dealt with the incorporation of organic and inorganic fillers into polymeric materials.1–5 The combination of particles and fibers with thermoplastic, thermoset, and elastomer matrixes is one of the most effective ways to develop composite materials with desirable properties.6–9 For less than thirty years, polyolefins, especially polyethylene and polypropylene, have received much attention in numerous applications.10–14 Short fiber–reinforced thermoplastics (SFRTs) are well-known engineering materials with substantial mechanical properties due to their easy and low-cost manufacturing. Extrusion compounding and injection molding are two of the most utilized methods that have been used to develop SFRT materials.15–17
Although concentrated fiber composites (higher than 20 vol% fiber content) are utilized for practical and industrial performances, most of the scientific studies investigated the low filled polymer/fiber composites (up to 20 vol%), which is far from the actual engineering products. 18 Processing of composites with fiber’s high-volume fraction struggles with some difficulties mainly is attributed to the high mixture’s viscosity.19,20 During the manufacturing of SFRT, the distribution of fiber length is adjusted by several factors such as fiber–fiber interaction, fiber–matrix interaction, and fiber contact with equipment surfaces.21,22 It should be stated that the mechanical properties of short fiber–reinforced polypropylene (SFRP), such as strength, Young’s modulus, and fracture toughness, depend on the fiber length distribution (FLD). By increasing the fiber content, fiber length reduction would be increased due to the enhancement of fiber–fiber interaction and as a result diminishes the reinforcement efficiency. So, the addition of short fibers into a polymer matrix does not always lead to a significant increase in mechanical properties.23–25 Moreover, researches on the rheological properties of SFRP showed the critical dependence of SFRP composite’s rheological behavior on filler size, shape, content, and surface chemistry of fibers.26–29 Therefore, it is crucial to gain more insight into exploring the relationship between FLD and the rheological and mechanical properties of the final product.
The most commonly used method for the determination of fibers’ breakage level is the direct measurement of their length after resin burn out or dissolution, known as the photomicrograph technique. In this technique, fibers are generally cast on a surface of glass slides or the like. The fibers are then photographed using an optical microscope. Afterward, fiber lengths are measured using computer software or a scale on photographs of extracted short fibers from the samples. But it should be noted that the photographs are not unlimitedly large. So, many fibers are intersecting the edges of the pictures, which cannot be counted because the parts of the fibers outside the pictures cannot be seen. 23
To the best of our knowledge, there is no specific report to theoretical and experimental evaluation of fiber distribution’s and content’s impact on rheological and mechanical properties of short glass fiber–reinforced polypropylene (PP). Therefore, the purpose of the current study is to examine the impact of the dispersion and uniformity of the fiber lengths on the rheological and mechanical properties of the polypropylene/short glass fiber (PP/SGF) composite. Extrusion processing was conducted to produce composite samples and to manipulate the fibers’ final length. Herein, the theoretical modeling was carried out to describe the flow and rheological behavior of the composites. The effect of the FLD on the flow behavior and model’s variables were also profoundly discussed.
Theoretical modeling
The modified rule of mixtures (MROM) is often used to predict the tensile strength of SFRP by assuming a perfect interfacial interaction between fibers and matrix.30–32 The formula of the MROM is given as equation (1)


Lc—the critical fiber length—is calculated by

The first and second terms take into account the contributions of the fibers with the sub-critical length shorter than Lc and the fibers with super-critical length longer than Lc, respectively. However, the contribution of the fiber orientation is not considered.
34
So

Integrating equation (5) over the range of fiber lengths results in equation (6), which is used in this study to investigate the effect of FLD on the rheological and mechanical properties of SFRP

Experiment
Materials
Properties of used materials.

MAH: maleic anhydride; MFI: melt flow index.
Fabrication of short fiber–reinforced polypropylene
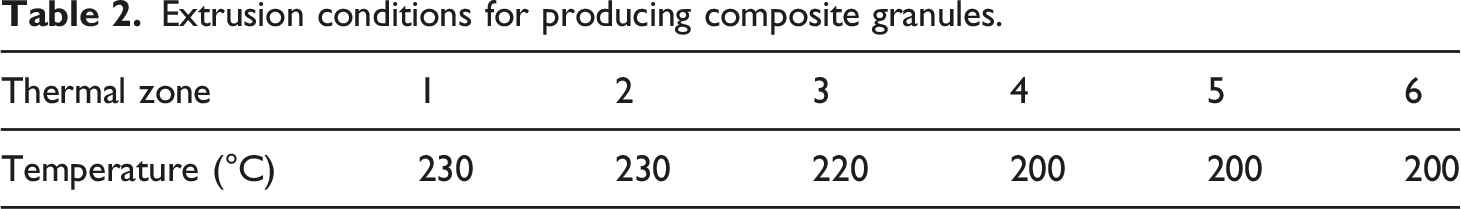
Extrusion conditions for producing composite granules.
Specimen’s composition.

MAH: maleic anhydride.
Rheological analysis
A capillary rheometer, type MLW-400, manufactured by Chang Chun Intelligent Instrument, equipped with the inlet angle = 180° and L/D = 20, was used to examine apparent shear stress as functions of apparent shear rate of neat polymers and reinforced composites. Rheological assessments were conducted in accordance with the procedures in ISO 11443 36 and type A2 in ASTM D-3835. 37 The experiments were performed at the same temperature of 230°C, with a velocity ranging from 5 to 50 mm/s. Herein, measurement performance is explained step by step: first, the temperature was set at 230°C, and the piston velocity was held constant; afterward, the composite was placed into the barrel and maintained there for 7 minutes till the composite reached the melting temperature. All tests were repeated three times.
All the samples exhibit a proportional increase in shear rate as a function of shear stress which declares the shear-thinning behavior. The Bingham model, presented in equation (7), was used to describe the rheological behavior of SFRP


Mechanical properties
The tensile and flexural properties of the specimens were determined via a Hounsfield HSOKS testing machine at a constant cross-speed of 5 mm/min. The dumbbell-shaped specimens for the tensile test were prepared based on ASTM D-638 38 type I, and the tensile properties were measured in accordance with the procedures in ASTM D-638. The specimens for the flexural test were prepared based on ISO 178, 39 and bending tests were performed according to the same standard. Five specimens were tested for each composition, and mean values were reported.
Measurement of fiber length
For detection of the fibers’ length, samples with the same glass fiber content were placed in the oven at a temperature of 600°C for 15 min. After the complete burn of the matrix, fibers were segregated from the sample ash and dispersed in water in a rectangular glass dish. The dish was then placed on the observation stage of an optical microscope. 40× magnified fiber image was transmitted to a large screen and was semi-automatically digitized by computer software. Finally, FLD was determined by the average fiber length, which was calculated from a minimum of 350 length measurements on fibers recovered from the incineration. It should be noted that the images are not unlimitedly large. So, many fibers intersect the edges of the images, as shown in Figure 1. These intersecting fibers cannot be counted as the parts of the fibers outside the image, which cannot be seen.
40
Optical microscopy image of short glass fibers in ×40 magnification.
Fiber length distribution factor was measured from optical microscopy images using MATLAB software in which the whole fiber length should be located inside the image. The length of the fiber in MATLAB is expressed in terms of the number of pixels. The relation between pixels and fiber length is shown in equation (10)
Calculating the numerical mean length (LN)
The numerical mean length is obtained using a MATLAB algorithm based on equation (11)

Measurement of fiber length distribution factor
Based on equation (6), in order to calculate the FLD factor, it was required to obtain the critical length, minimum and maximum length, and most importantly, the best-fitted distribution for the fiber length histogram. In the following, the method for calculating these factors is elucidated. The critical length value is calculated by equation (13)
Results and discussion
Fiber length distribution factor
According to the aforementioned theoretical modeling, the relation between FLD factor with fiber volume fraction and numerical mean length was determined. The results are shown in Figure 2 and Supplemental Table S2. (a) Fiber length distribution factor as a function of fiber volume fraction and (b) fiber length distribution factor as a function of numerical mean length.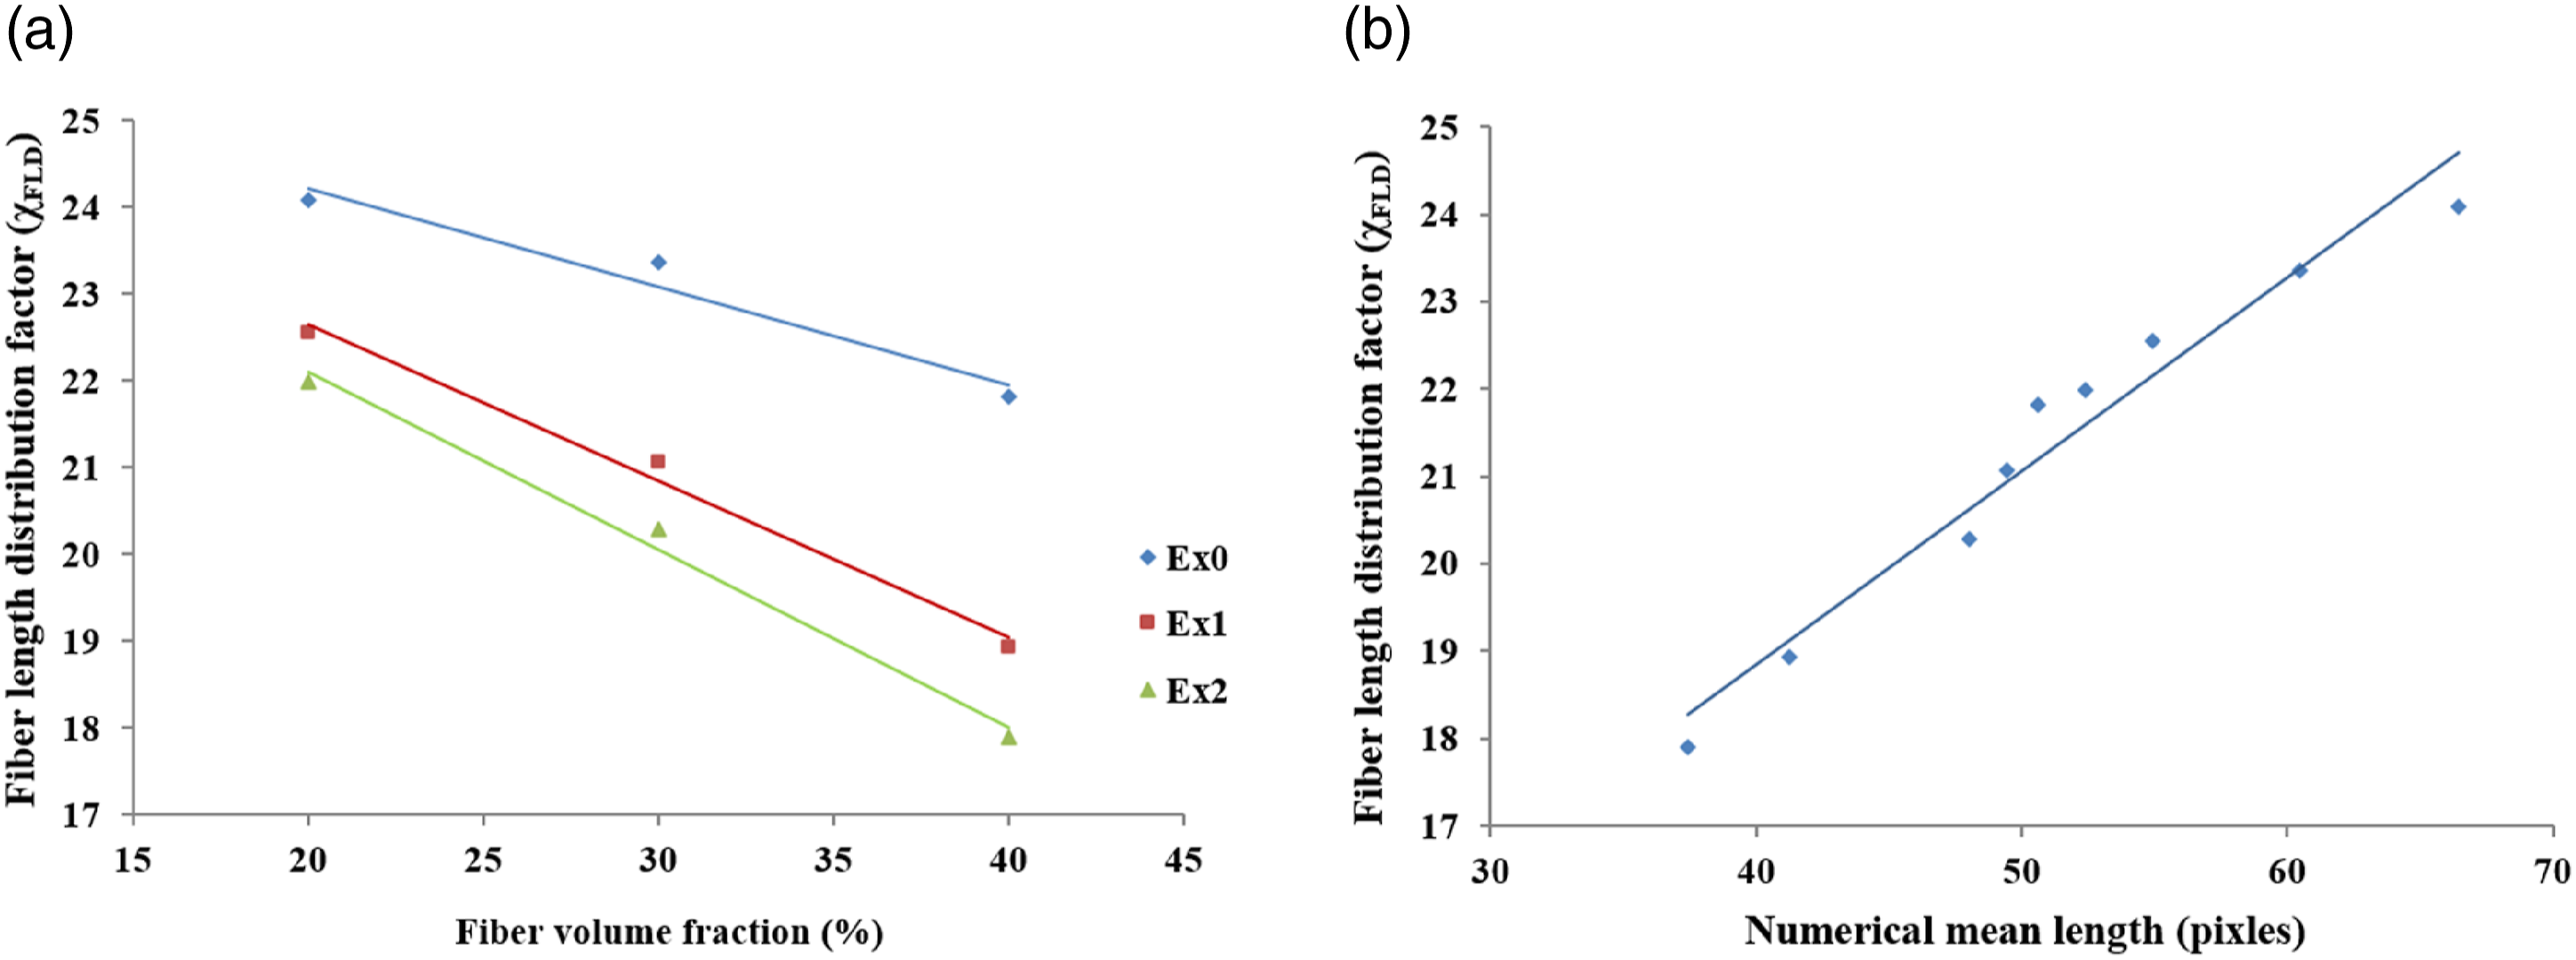
As presented in Figure 2 and Supplemental Table S1, the FLD factor is decreased by increasing fiber volume fraction and fiber length decrement. It is noteworthy to mention that the original fiber length was 3 mm before the processing. This remarkable reduction in the fiber length was attributed to the breakage of glass fibers during the melt processing in the twin-screw extruder. It is required to point out the factors affecting the fiber breakage inside the composite. The fibers could be damaged due to contact and friction with the barrel’s wall, collision with other fibers, and matrix movement during the mixing or molding process, resulting in a FLD in the final composite. During the extrusion mixing of the fiber-reinforced composites, some fibers become entangled and break due to the melt’s pressure and break into shorter sizes. Moreover, as the volume fraction of the fibers increases, the number of fibers that are entangled would be enhanced, and the stress on them also increases. This phenomenon results in shorter fibers. The decrement of samples’ fiber length occurred each time passing the extruder. The result of calculating the mean size showed that extrusion for the first time significantly reduces the length of fibers in composite (between 6.5 to 13%), and the amount of this reduction is more in samples with higher fiber volume fraction. The second extrusion was not very effective in further reducing the fiber length (about 2.5–5%), but its effect is more evident in higher volume fractions of fiber. To clarify the effect of fiber volume fraction on FLD factor, increasing the fiber volume fraction from 20% to 30% caused the FLD factor to decrease between 3 and 7.5%, and increasing the fiber volume fraction from 30% to 40% applies another decrease between 6.5 and 12% on the FLD factor. The FLD factor is generally determined from the area under the distribution curve and is influenced by different variables such as the minimum, maximum, and critical length of the fibers. Therefore, increasing the FLD factor results in the longer fiber length and also wide length distribution curve; on the contrary, reduction in the FLD factor leads to the shorter fiber length and a narrow length distribution curve. The results obtained from Figure 2(a) and (b) are in agreement with reports from Laukes et al. on the mechanical properties of short fiber–reinforced polymers which show that curves shift to lower fiber lengths by increasing the fibers volume fraction. 41
Rheological results
After evaluating the visual investigation on FLD, it was crucially necessary to elucidate rheological properties. Flow diagram of all the samples is plotted as a function of shear rate in Figure 3. As illustrated in the curves, the shear viscosity of composites has unquestionably increased as the fiber concentration increased. For instance, according to Figure 3(b), the shear viscosity of the composite containing 40% fiber is approximately twice that of the neat matrix. As expected, the shear stress also increased as the reinforcing filler was raised. Nevertheless, the impact of the fiber loading was more noticeable at higher shear rates. Moreover, the changes in the shear stress and shear viscosity for samples containing shorter fibers are quite low, revealed that fibers were not large enough to cause substantial deviations. However, the increase in the stress and viscosity was more noticeable for higher volume fractions. (a) Shear stress and (b) shear viscosity versus shear rate for all samples.
Analysis of initial stress (τ0)
One of the most important features of a visco-plastic fluid is its yield stress; if the material is not sufficiently stressed, it behaves like a solid and when the yield stress is exceeded, the material flows like a fluid. Figure 4(a) and (b) demonstrates the relation between τ0 versus fiber volume fraction and FLD factor, respectively. In each group, the number of extruding for the pure polymer is once more than SGF/PP composites to eliminate the effect of polymer chains’ scission during the mixing. Yield stress (τ0) versus (a) fiber volume fraction and (b) fiber length distribution factor. X in Figure 4(a) refers to yield stress for the pure polymer before extruding.
A simple analysis of Figure 4 shows that yield stress increases by adding glass fibers, which confirms the reinforcement effect of short glass fibers in the PP matrix. Based on the diagrams in Figure 4, initial stress is decreased by every extruding process of neat polymers. This is attributed to the long molecular chains of the polymer, in which the molten polymer is very thick and a large force is required for the polymer to flow. While reducing the molecular chain length, facilitate the chains to slide over each other and less force will be needed for the beginning of the flow. As shown in Figure 4(a) and (b), for all the filled polymers, τ0 is bigger than the neat polymer and it has a direct relation with the FLD factor and volume fraction, respectively. Based on the rheological flow behavior shown in Figure 4(a) and (b) and equations presented in Supplemental Table S2, for pure PP and SGF/PP composites, τ0 is reduced by increasing the numbers of the extruding process due to molecular weight reduction and decrease in fiber length inside the composite. Moreover, gradient changes decreased for the second extruding process, which is caused by a reduction in fiber length alternations compared with the first extruding process.
Analysis of non-Newtonian index (n)
Modification of the non-Newtonian index (n) by changing the fiber volume fraction and FLD factor are shown in Figure 5(a) and (b), respectively. The quantity of non-Newtonian index is influenced by the fiber orientation, dispersion, and failure within the polymer chains. Whenever the fiber length inside the composite becomes shorter, the fiber is better dispersed and more fibers are oriented in the flow direction, so it results in an increment of the non-Newtonian index (n). The lowest value of n represents the maximum non-Newtonian behavior, and the sharpest visco-plastic curve would be provided. In other words, whenever n is small, the apparent viscosity is more influenced by the strain rate. From Figure 5(a) and (b), it can be seen that the n values of the composites reinforced by three different fiber volume fractions were all smaller than that of the pure PP, and all of them are shorter than 1. That means both the PP and the fiber-reinforced composites show non-Newtonian behaviors. During the mixing process, the mutual tangled fibers are disentangled and cut short by shear stress; so, the fibers gradually dispersed into the PP and are oriented along the shear direction. Therefore, the visco-plastic behavior of filled polymer samples is much more eminent than that of pure PP. Based on Figure 5(a), the n value decreases with increasing fiber volume fraction and decreasing the fiber length. Non-Newtonian index (n) versus (a) fiber volume fraction and (b) fiber length distribution factor. X in Figure 5(a) refers to non-Newtonian index for the pure polymer before extruding.
Figure 5(b) shows that the non-Newtonian index decreased with increasing the FLD factor. The change in the gradient of the diagram showed that the reduction in fiber length in the first extruding process has an insignificant impact on increasing the non-Newtonian index, while extrusion processing for the second time, as mentioned earlier, did not have much effect on reducing the fiber length but has a great effect on increasing the non-Newtonian index because of the uniformity of the fiber length. This means that a second extrusion, although not having much effect on reducing the fiber length, significantly reduces the non-Newtonian behavior of the molten composite.
Analysis of consistency index (k)
The dependence of consistency index (k) to the fiber volume fraction is shown in Figure 6(a) and (b). It can be seen that the k values of glass fiber–filled samples are all higher than that of the pure polymer. It should be explained as the fibers with a large aspect ratio are easily entangled, resulting in an increased force between fibers when they move relative to other fibers. Moreover, the tangled fibers block the flow of the matrix. Therefore, the addition of the fibers increases the consistency index over that of the pure PP. Figure 6(a) shows that increasing the fiber volume fraction increases the consistency index monotonously. Furthermore, just like the yield stress of the composite (τ0), with decreasing the FLD factor, changes in gradient decreased. As it can be seen in Figure 6(b), the consistency index increases with increasing FLD, which confirms the abovementioned explanations. Consistency index (k) versus (a) fiber volume fraction and (b) fiber length distribution factor. X in Figure 6(a) refers to consistency index for the pure polymer before extruding.
Figure 6(b) also shows that extruding for the first time, despite a more significant reduction in fiber length, has a more negligible effect on changing the rheological behavior of the composite melt. However, the second extrusion, while not having much impact on reducing the size of the fibers, results in a significant reduction in non-Newtonian behavior of the molten composite by equalizing the fiber length inside the matrix.
Mechanical properties
Tensile properties
Glass fibers have the mainstay role in fiber-reinforced composites’ mechanical properties; hence, the tensile stress–strain curves for the SGF/PP composites are tabulated in Figure 7(a). As can be deduced from the curves, SGF/PP composites exhibited a brittle behavior. Also, at lower and higher stresses, linear and nonlinear deformation mechanisms have been observed, respectively. It is clearly seen that the tensile modulus and stress increased monotonically for the composites as the fiber content was raised. However, elongation at break decreased due to fiber–polymer interaction, leading to immobilizing the chains. Consequently, the brittleness and hardness of composites increased with the increment of reinforcement concentration. These changes in mechanical properties could be attributed to the load distribution between the matrix and the fibers. Accordingly, more force was endured by the fibers, which increases the modulus and ultimate strength. For instance, the tensile strength of composites has raised 223% and 305% for the weakest (20% GF, Ex 2) and the strongest sample (40% GF, Ex 0), respectively, comparing to the neat PP. (a) Tensile stress–strain curves of SGF/PP composites, (b) ultimate tensile strength, (c) failure strain, and (d) tensile modulus versus fiber length distribution factor in various fiber contents. Note; SGF: short glass fiber; pp: polypropylene.
The variations of the ultimate tensile strength and failure strain as a function of the FLD factor are shown in Figure 7(b) and (c), respectively. The results obtained from Figure 7(b) show that the tensile strength of composite increases by increasing the FLD factor, and the highest strength belongs to the highest fiber volume fraction. The strength of the 40% GF/PP sample decreased after the first extra extrusion process by about 7% which was almost the same as 30% GF/PP sample without extra extrusion. Figure 7(c) shows that the elongation at break was positively influenced by the FLD factor and decreased as the fiber loading enhanced. Reducing the final fiber length inside the composite resulted in the enhancement of the number of fibers that were shorter than the critical length. These short fibers do not affect the composite’s strength; hence, the ultimate strength of the composite decreased. Furthermore, fibers are going to disperse more efficiently as the fiber length in the composite is reduced, and fibers’ accumulation within the polymer decreased. As a result, space indwelled by the pure polymer decreases, and the ability to deformation is minimized.
The variations of the elastic modulus of SFRP composites as a function of FLD factor are shown in Figure 7(d). It can be seen that the modulus increased as both fiber’s length and content increased. Linear correlation between modulus and fiber concentration was also fitted by Fu and Lauke. 33 Modulus is a mechanical property that is achieved from low strains of the stress–strain curves and is most affected by fiber content than the fibers’ length. Therefore, the gradient of modulus versus fiber volume fraction is greater than the gradient of the modulus versus FLD factor. In composites with constant fiber’s concentration, increasing the aspect ratio of fibers leads to enhancement of interfacial surface area; thus, the fiber–matrix interaction increases and ameliorates composite’s modulus. These noteworthy results are in the same direction with other researches.42–44
Flexural properties
Figure 8(a) shows the flexural stress–strain curves of SGF/PP composites. Results show that the flexural strength of samples has been improved. It should be noted that the flexural strength of the composites containing 30% and 40% glass fiber is almost the same. To be more specific, the flexural strength of 40% GF-reinforced composite was about 3% higher than 30% GF-reinforced samples, while the flexural strength of samples reinforced by 20% GF is about 25% lower than them. This phenomenon can be attributed to saturation with fiber content. Based on Figure 8(b), fiber length had a limited effect on the composite’s flexural strength. Therefore, it could be concluded that the fiber length had an insignificant impact on flexural properties. Moreover, increasing the fiber content increased the effect of fiber size on the composite deformation. This is due to the fact that at the high amount of fiber volume fraction, fiber length becomes shorter and fibers act as the particle fillers with fine dispersing in the matrix; so, the brittleness of composite is increased. The relation between tensile and flexural strength with fiber volume fraction is similar and it has been confirmed by other studies as well.45,46 Figure 8(c) shows that variations in the failure strain based on the FLD factor are insignificant, while enhancement of the fiber volume fraction significantly increases the flexural strain. So, elongation to failure of the composite is independent of fiber length, especially in the low volume fraction of reinforcement. The relationship between flexural modulus and FLD factor is shown in Figure 8(d). It shows that the flexural modulus raised on average by 278% for 20% GF, 432% for 30% GF, and 475% for 40% GF reinforced composite compared to the raw polymer. As same as the tensile modulus (Figure 7(d)), the flexural modulus of reinforced samples considerably increases with fiber volume fraction increment. The results indicate that the reduction of glass fiber volume fraction from 40% to 30% reduced the flexural modulus by about 10%, while the flexural modulus reduced about 35% for the samples reinforced with 20% GF compared to 30% GF-reinforced samples. Moreover, direct relation is observed between the flexural modulus and FLD factor and the reduction of fiber length in the composite reduces the modulus of the composite due to the reduction of the contact surface between the fiber and the matrix. As aforementioned, when the reinforcement volume fraction is constant, increasing the aspect ratio of the fibers results in higher fiber surface area and the interaction between the matrix and the fibers, concluding in composite modulus enhancement. (a) Flexural stress–strain curves of SGF/PP composites, (b) ultimate flexural strength, (c) failure strain, and (d) flexural modulus versus fiber length distribution factor in various fiber contents. Note; SGF: short glass fiber; pp: polypropylene.
Microstructural investigation
SEM micrographs of the fractured surfaces of SGF/PP composites are shown in Figure 9. These micrographs are selected arbitrarily to show the effect of glass fiber content and length. It should be mentioned that the glass fiber ratios are increased from a to c, while in Figure 9(c) and (d), the fiber content remained constant and the fiber length is decreased. The brittle fracture of the matrix is observed in SGF/PP composites, consistent with the brittle nature of the tensile stress–strain curves for the composites, shown in Figure 7. SEM images in Figure 9 show that many fibers are pulled out from the matrix. It is due to the shorter length of the glass fibers than their critical length. In this situation, most fibers would be pulled out instead of fractured during the loading of the composite. Comparing Figure 9(d) to Figure 9(c) shows that decreasing the fiber length inside the composite leads to pulling out more fibers during the fracture. The same results were reported by Fu and Lauke.
33
SEM images of tensile fracture surface for the SGF/PP composites with different glass fiber contents. (a) 20% GF Ex0, (b) 30% GF Ex0, (c) 40% GF Ex0 and (d) 40% GF Ex2. Note; SGF: short glass fiber; pp: polypropylene.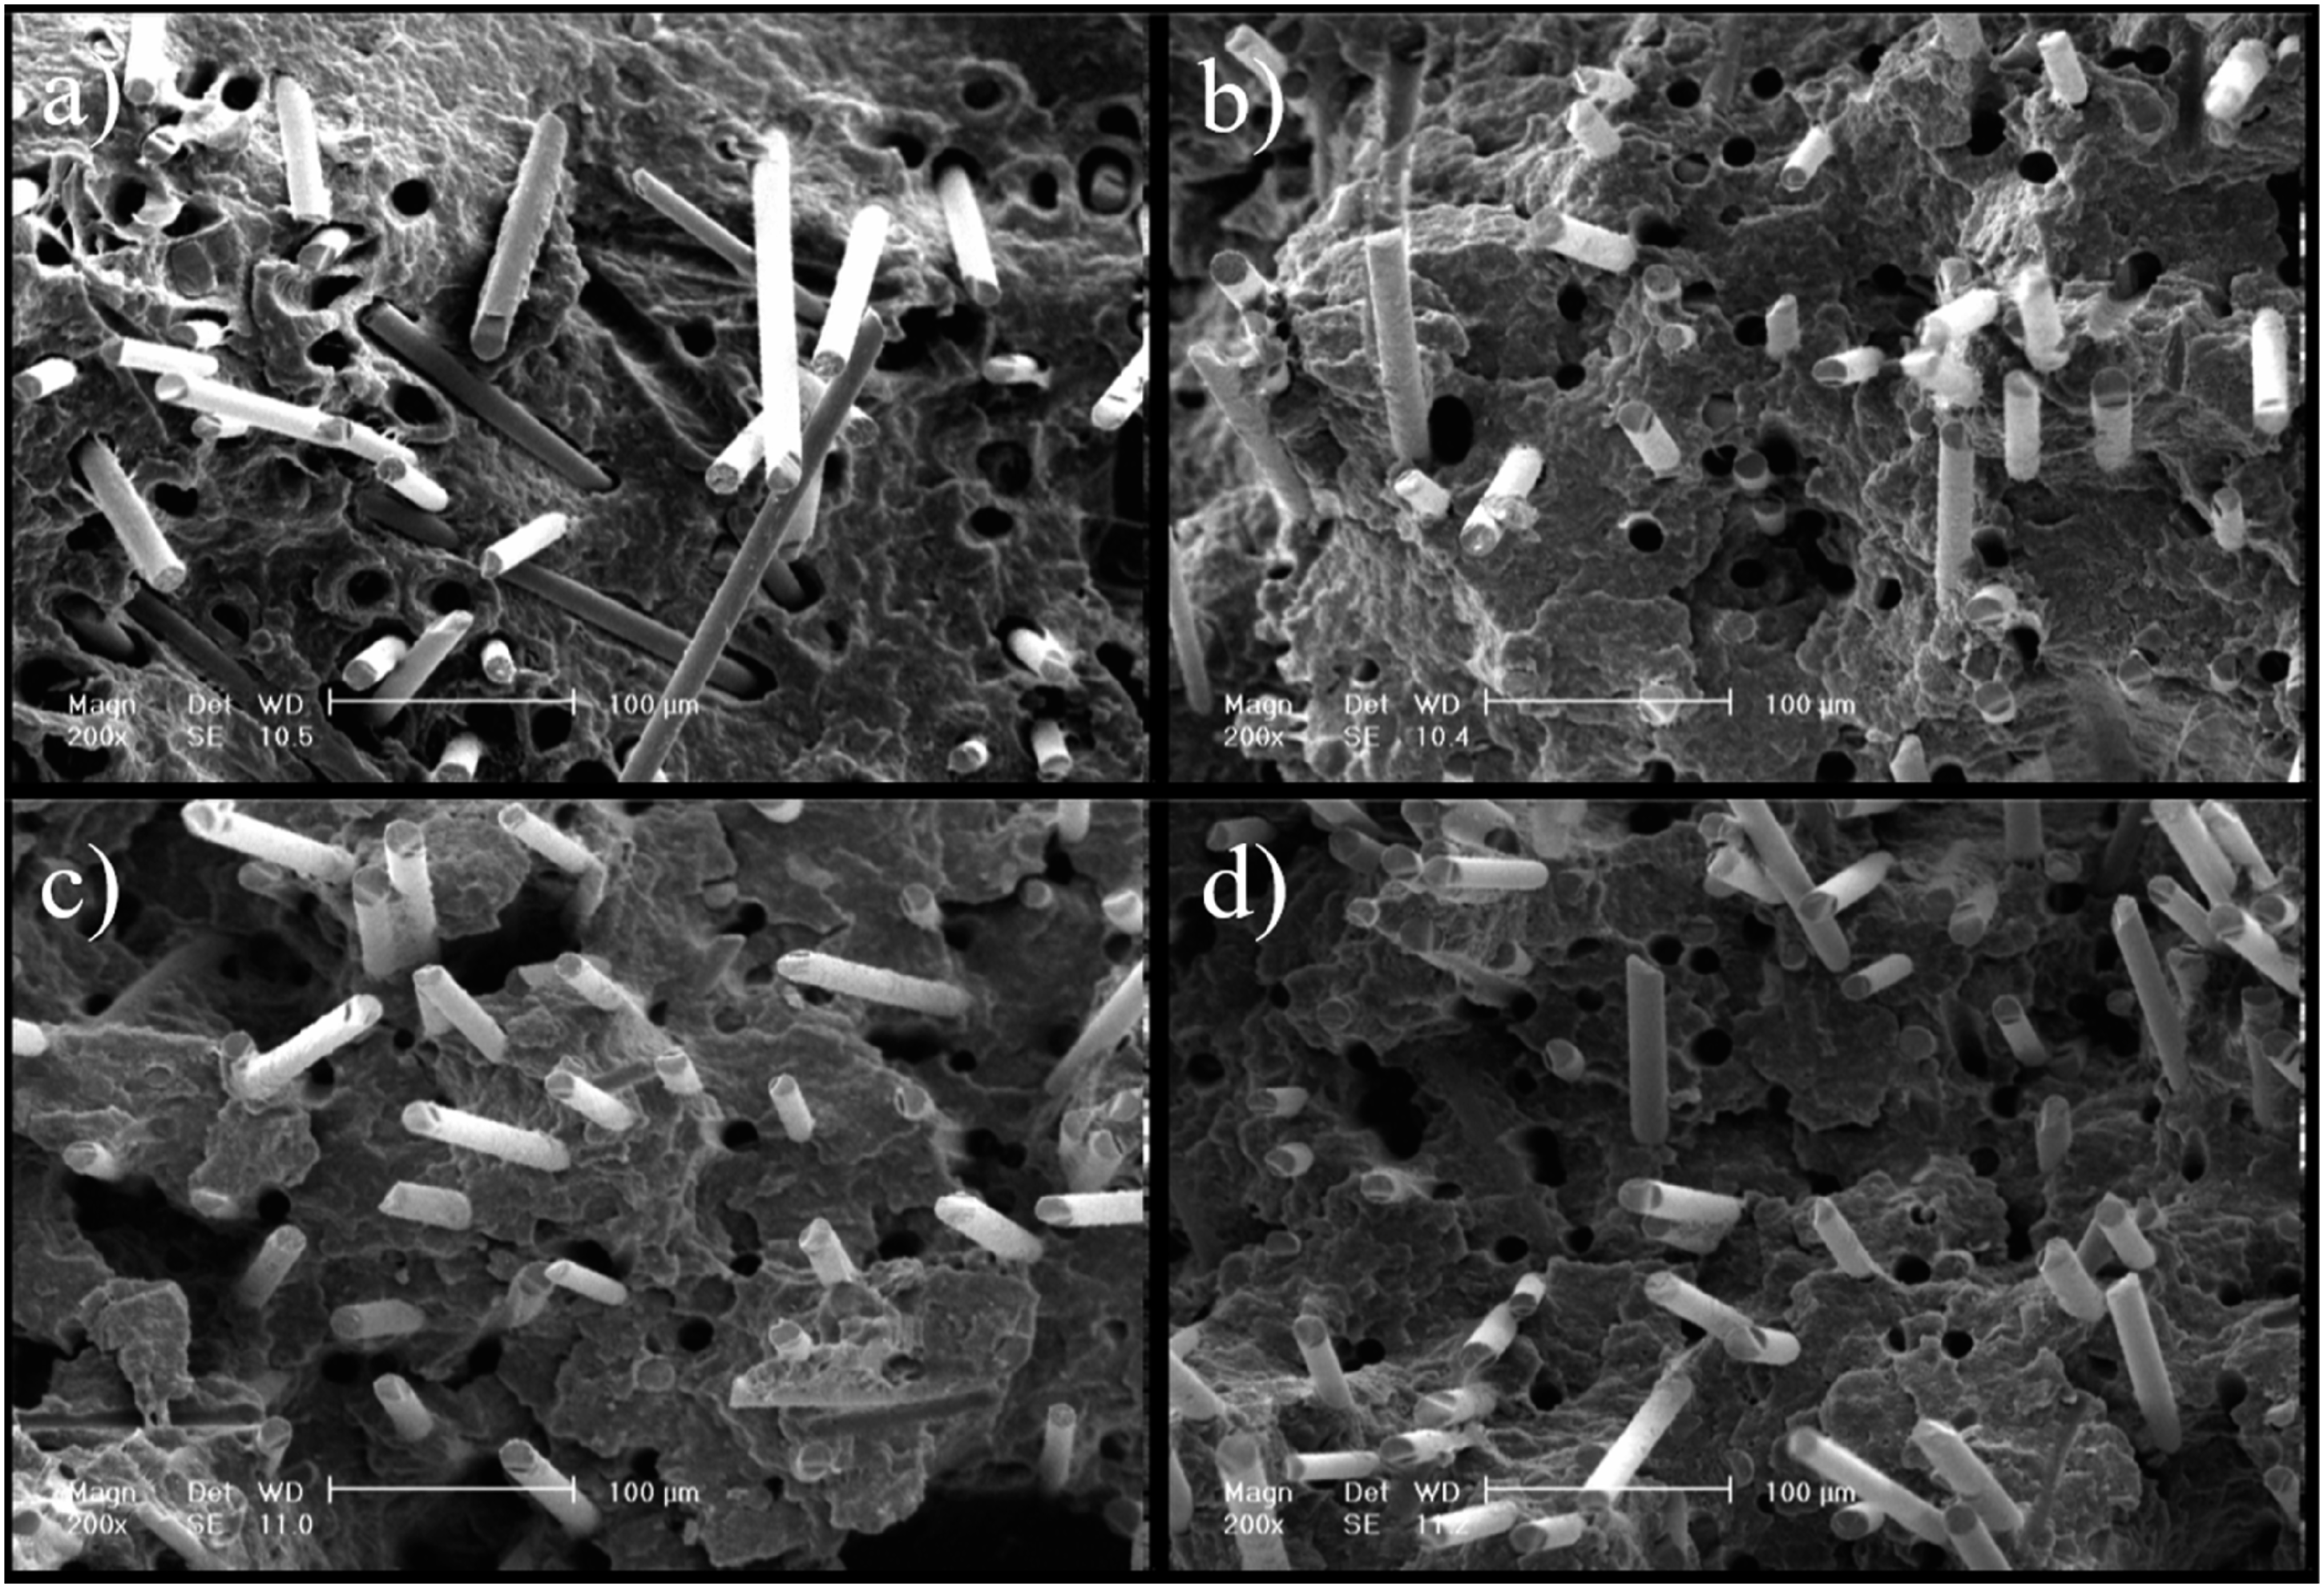
Conclusion
Glass fiber–reinforced polypropylene (GFRP) composites were prepared via melt mixing at three different fiber contents as well as various extrusion processes, and their rheological, mechanical, and microstructural properties were studied. Multiple extrusions were used to obtain various FLDs and were assessed via optical microscopy. In addition, the samples’ tensile and flexural properties were evaluated to examine the effect of multiple processing and FLD factor on the mechanical properties of the final product. FLD histograms indicated that fiber volume fraction increment and extrusion numbers reduced the fiber length inside the composite, which narrowed the FLD curves and shifted them to smaller sizes. Also, it was shown that increasing the fibers’ content increased the number of agglomerated fibers, which enhanced the induced stress on them, and consequently, fibers’ length is shortened. Rheological assessment represented that stress and melt viscosity directly correlate with fiber volume fraction and FLD factor. Surprisingly, the fiber length was a more effective parameter on the rheological properties than fiber volume fraction. Theoretical studies showed that the Herschel–Bulkley model was the best model for the prediction of the samples’ rheological behavior. Consistency index (k) and yield stress (τ0) are directly related to the FLD factor, while the non-Newtonian index (n) shows the inverse relationship. Rheological diagrams showed that the non-Newtonian behavior of the molten composite significantly reduced after the second extrusion processing. Furthermore, the tensile properties of the composites showed that although the elongation at break and composites’ toughness reduced, the addition of fibers increased the tensile modulus and strength. The tensile stress–strain curves of composites showed linear and nonlinear deformation at lower and higher stresses, respectively. Increasing the FLD factor increased the tensile strength and failure strain. The flexural strength had less dependence on fiber length than tensile strength. Also, by increasing the fiber concentration, the effect of fiber length on the composite’s deformation was enhanced. The flexural strength of composites containing 30 vol% and 40 vol% fiber was almost the same (just 3% difference), while the flexural strength of 20 vol% GF/PP is about 25% lower.
Supplemental Material
sj-pdf-1-jit-10.1177_15280837211043254 – Supplemental Material for The Effect of Fibers’ Length Distribution and Concentration on Rheological and Mechanical Properties of Glass Fiber–Reinforced Polypropylene Composite
Supplemental Material, sj-pdf-1-jit-10.1177_15280837211043254 for The Effect of Fibers’ Length Distribution and Concentration on Rheological and Mechanical Properties of Glass Fiber–Reinforced Polypropylene Composite by Fatemeh Asoodeh, Mohammad Aghvami-Panah, Saeed Salimian, Mohammadreza Naeimirad, Hamed khoshnevis and Ali Zadhoush in Journal of Industrial Textiles
Footnotes
Declaration of conflicting interests
The author(s) declared no potential conflicts of interest with respect to the research, authorship, and/or publication of this article.
Funding
The author(s) received no financial support for the research, authorship, and/or publication of this article.
Supplemental material
Supplemental material for this article is available online.
References
Supplementary Material
Please find the following supplemental material available below.
For Open Access articles published under a Creative Commons License, all supplemental material carries the same license as the article it is associated with.
For non-Open Access articles published, all supplemental material carries a non-exclusive license, and permission requests for re-use of supplemental material or any part of supplemental material shall be sent directly to the copyright owner as specified in the copyright notice associated with the article.