
Abstract
Three-dimensional (3D) woven composites have been widely used in structural components due to their excellent mechanical and near-net-shape properties. However, for some special applications, it is expected that 3D woven composites can be damaged at designated locations under a specific load. In this research work, a new kind of defect-prefabricated 3D woven composites (DP3DWCs) are designed, where defects are prefabricated by cutting weft or warp yarns in defect-free 3D woven composites (DF3DWCs). The tensile mechanical properties of the DF3DWCs and the DP3DWCs are investigated experimentally and numerically. The mesoscopic geometry models of the DF3DWCs and the DP3DWCs were established by multi-objective searching algorithm. The progressive damage models were established using the 3D Hashin criteria and the von Mises failure criterion. Numerical results agree well with the experimental data. The influence of the number of defect layers on the mechanical properties was also discussed. The obtained results indicate that the defects have little effect on the elastic modulus, while tensile strengths decrease linearly with the increase of the number of defect layers. Failure mechanisms of yarns and matrix in the non-defective and defective materials were studied, and the volume fraction of elements of each failure mode was computed and analysed.
Keywords
Introduction
Three-dimensional (3D) woven composites exhibit many advantages, such as the improved transverse strength, reduced notch sensitivity, enhanced fracture toughness and impact resistance. 1 Attributing to the above-mentioned benefits, more and more structural components in the aerospace industry are manufactured with 3D woven composites, such as fan blades of airplane engines and landing gear braces. 2 In light of these industrial applications, various experimental and numerical investigations on mechanical behaviour of 3D woven composites were conducted and reported.
Compared with laminated composites, the reinforcement phase of 3D woven composites has a complex geometric structure, which is one of the decisive factors for the mechanical properties. Tan et al. 3 found that the tensile properties of 3D orthogonal woven carbon fibre reinforced plastics (CFRP) composites in the weft and warp directions are related to the fibre volume fraction in the respective directions, the higher the volume fraction, the stronger the tensile performance. Quinn et al. 4 reported that the tensile modulus and strength of the orthogonal interlock (ORT) woven composites increased with the increase of the binder density in the warp/weft directions. Brandt et al. 5 compared the stress and modulus of various 3D woven composites (monolithic and sandwich) in the warp/weft direction. Dai et al. 6 found that mechanical performance, including the tensile, compressive and flexural performance of 3D woven composites, was affected by the distribution of resin-rich regions and the waviness of the load-carrying fibres. Saleh et al. 7 studied the effect of z-binder architecture on the loading direction sensitivity of orthogonal, layer-to-layer and angle interlock woven composites. Compared to the other architectures, 3D orthogonal woven composites exhibited better performance, such as higher strain to failure and higher translaminar energy absorption especially under off-axis tensile loadings. Hu et al. 8 investigated the effect of Z-binder tension and internal micro-structure on the damage behaviour of 3D orthogonal woven composites. The interlacing process of tows was simulated by the Z-binder tension, and an element recognition algorithm to generate voxel models was proposed. Jiao et al. 9 conducted tension and compression tests of 3D layer-to-layer interlock woven composites with four weaving structures. Results show that both tension and compression properties are closely related to the weaving structures. Gerlach et al. 10 studied the in-plane and out-of-plane properties of 3D woven composites having different binder volume fractions of 3% and 6% under impact loading. Results showed that the effect on the in-plane stiffness was small, but the one on the delamination resistance was considerable.
In addition to the above-mentioned meso-geometric structure of the fabric, the state of the fibres also affects the mechanical properties of composites. For example, strong interfacial bonding between fibres and matrix can take substantial improvements in mechanical properties.11–15 However, 3D woven composites often produce initial defects during the manufacturing process, such as fibre wear, fracture and air bubbles in matrix. These initial defects would have a negative impact on the mechanical properties. Lee et al. 16 observed the fibre wear and break during weaving and studied the effect on the strength of glass tows. The experimental results showed that the tensile strength gradually decreased in each stage of the weaving process. Rudov-Clark et al. 17 detected the fibre damage at different stages in weaving progress of warp and binder yarns forming 3D woven composites. It was found that yarn strength reduced between 30% and 50% due to abrasion damage and removal of sizing agent, and fibres’ damage caused a large loss in yarn strength while had a small effect on yarn stiffness. Abtew et al. 18 reported that both weaving process parameters and the type of fabric architecture had an effect on the properties degradation of yarn inside the 3D woven structure. And, the degradation ultimately brought a great influence on the mechanical behaviours of 3D woven products. Ai et al. 19 found that void defects in 3D orthogonal woven C/C composites have great influence on the mechanical performance, and its 0.51% volume fraction can cause 13.2% decline on tensile strength.
Defects in the material would lead to a decrease in mechanical properties, which should be avoided as much as possible for most structural components, but would have important application value for some special components such as emergency disconnect joints and missile-launch canister covers that needed to be damaged at designated locations. In some special applications, the component should not only break in a predetermined pattern in the weak area but also have sufficient in-plane and out-of-plane mechanical properties in its non-weak area to withstand specific pressure and impact load. Because of their excellent overall performance and designability, 3D woven composites have become one of the ideal choices for design structural parts with emergency disconnection functions. Therefore, prefabricated defective 3D woven composites were designed and manufactured by cutting some warp/weft yarns in preform in this research. The influence of defects on tensile mechanics is investigated experimentally and numerically. Results reveal that this method of prefabricating defects can adjust the mechanical properties by controlling the number of cut yarns, providing a new way for designing the components which can be damaged in designated areas under a specific load. This may have a practical importance for the designers.
Experiment
Materials and specimens
The 3D woven composite preforms, which consisted of five layers of weft yarns, four layers of warp yarns and four layers of binder yarns, were produced by Nanjing Fiberglass Research & Design Institute, China. Each layer of wefts, warps and binder yarns contained four yarns. Each warp and binder yarn contained one bundle T700SC-12000 (produced by Toray) carbon fibres, while a weft yarn contained two bundles. In this study, prefabricated defects of two-, three- and four-layer wefts, one- and two-layer warp and binder yarns were introduced by cutting yarns. All defects are located in the middle of the preforms.
All specimens were manufactured by resin transfer molding (RTM) in the State Key Laboratory of Mechanics and Control of Mechanical Structures at Nanjing University of Aeronautics and Astronautics (China). The epoxy resin used in composite molding was Epikote E51-618, while m-phenylenediamine (MPD) was used as a hardener. Each specimen has the following dimensions: the length of about 230 mm, the width of 25 mm and the thickness of 5.5 mm, as shown in Figure 1. One strain rosette was bonded at the centre of one surface of the defect-free specimen (Figure 1(a)), and one strain rosette was bonded on the defect position located in the middle of the surface of the defective specimens (Figure 1(b)). To reinforce the specimen, the tabs with 2 mm thickness and 50 mm length were attached on both surfaces of the specimen’s ends by AB glue. Figure 1(d) and (e) show the defect-free and defective specimens. Specimens. (a) The size of defect-free specimen; (b) the size of defective specimen; (c) side view of specimen; (d) defect-free specimens; (e) defective specimens.
The fibre volume fraction of the defective composite and the defect-free composite was obtained by weighting the preform and the panel. It was shown that the manufacturing defects had little effects on the fibre volume fraction, which was 51.71% for both the defective and the defect-free composites. The weft and the warp (warp and binder) densities of the 3D woven composite preforms were 3.1/cm and 8.0/cm, respectively. The fibre volume ratio of warp and binder yarns to wefts was 1.133. Therefore, the fibre volume fraction of wefts was 24.24%, while the one of the warp and binder yarns was 27.47%.
Tensile test and results
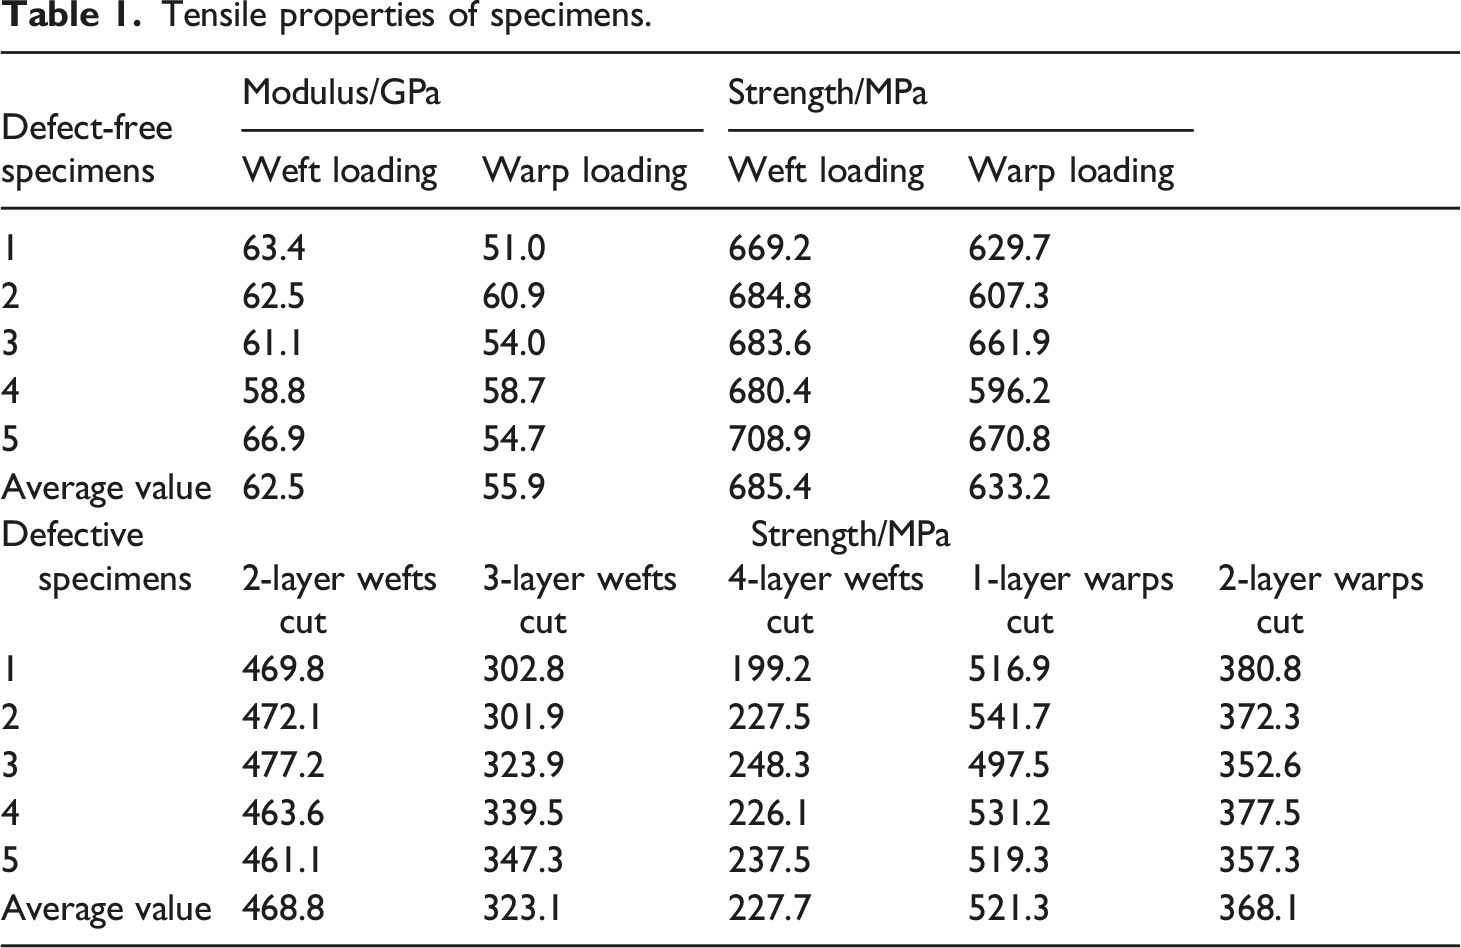
Tensile properties of specimens.
The failure morphologies of the defect-free specimens subjected to the weft and warp loading are shown in Figure 2(a) and (b), respectively. It is seen that the failure modes of the defect-free specimens mainly manifest as yarns tensile failure, yarns transverse cracking and matrix fracture. The failure morphologies of the prefabricated defect specimens are shown in Figure 2(c)–(g). It can be seen that the main failure modes of all types of prefabricated defects specimens are the tensile fracture of uncut yarns and matrix fracture. In addition, yarns transverse cracking which almost all close to the uncut yarns exists. The numbers of cracks reduced with the increase of layers of yarn cut. Fracture morphologies of specimens. (a) Defect-free specimens with weft loading; (b) defect-free specimens with warp loading; (c) the specimens with two-layer weft yarns cut; (d) the specimens with three-layer weft yarns cut; (e) the specimens with four-layer weft yarns cut; (f) the specimens with one-layer warp and binder yarns cut; (g) the specimens with two-layer warp and binder yarns cut.
Finite element analysis
Geometric modeling
Geometry characterization
The dip angle of binder yarns is 20.1°, derived from the electron microscope images shown in Figure 3(a). Based on the actual yarn configuration of the defect-free specimens, some assumptions are employed for the convenience of modeling. (1) A rectangle is selected to describe the cross-section of the warp and binder yarn, and a hexagon is adopted to depict the cross-sectional configuration of weft yarn, as shown in Figure 3(a) and (b). (2) The outline of the weft and warp yarns is assumed to be straight, and the axis of the binder yarns is composed of the polylines. (3) The shape and size of the cross-section of each yarn do not change, and cross-section twisting does not occur. (4) The yarn is regarded as a unidirectional composite composed of fibre and matrix where the interface between fibre and matrix is perfect. The equivalent cross-sections and their parameters of yarns. (a) The equivalent cross-section of weft yarns; (b) the equivalent cross-section of warp and binder yarns; (c) the parameters of the cross-section of wefts and the axis of binder yarns; (d) the parameters of the cross-section of warp and binder yarns.
The cross-sectional parameters of yarns and the length parameters of the axes of binder yarns are shown in Figure 3(c) and (d), where
The cross-sectional area of weft yarns can be described as
The cross-sectional area of warp and binder yarns, denoted by 
The weft density

The length of the warp and weft yarns, also the length and the width of the representative volume element (RVE) model, can be obtained by 


The fibre volume fraction of weft yarns 


Geometric modeling by multi-objective searching
Based on the above simplification and the relationship of geometric parameters, a multi-object traversal search is performed to establish a geometric model of the 3D woven composite. The dip angle is set to 20.1°, the weft density, the warp density and the thickness of weft and warp yarns are used as search variables, and the search targets are
During the modeling process, the initial values of the thicknesses of the weft and warp yarns are 0.5 mm, and the initial values of the weft and warp density are 3.0 tows/cm and 8.1 tows/cm, respectively. In addition, the precision control variable q is introduced, and its initial value is set to 0.1. The searching regions for the weft density, warp density, weft and warp thicknesses are
During the scanning of all values of the above-mentioned variables in the search interval, stop searching and output the relevant parameters if values which can let The flowchart of geometric modelling.
The geometric model of the 3D woven composites established according to the method shown in Figure 4 is demonstrated in Figure 5(a). The parameters of the geometric model and the preforms are summarized in Table 2. From Table 2, it is seen that errors exist for the yarn density and thickness of the RVE model as compared with the corresponding parameters of the preforms but within an acceptable range. Errors are inevitable due to the accuracy of the RTM forming process and the simplified assumptions used in establishing the geometric model. Geometric models. (a) The RVE model; (b) different sizes local microstructure geometric models of the weft defect materials. RVE: representative volume element. Parameters of the preform and geometric model.

Since the defects of the defect-prefabricated 3D woven composites (DP3DWCs) are manufactured by cutting the corresponding layers wefts, warp and binder tows, unlike the defect-free 3D woven composites (DF3DWCs), the defective materials do not have periodicity. Based on the RVE model of DF3DWCs, the local microstructure geometric models of the defective materials with different sizes were established. In establishing a local microstructure model of the weft defective materials, its dimension in the weft direction was changed, while the dimension in the warp direction remained the same as the one of the RVE model of DF3DWCs. In establishing a local microstructure model of the warp defective materials, the dimension in the weft direction remained the same as the one of the RVE model of DF3DWCs, and only the dimension in the warp direction changed. Figure 5(b) shows local microstructure geometric models of the weft defective materials which with the length in the weft direction varying from 1L to 2L, where L is the weft length of the defect-free RVE model.
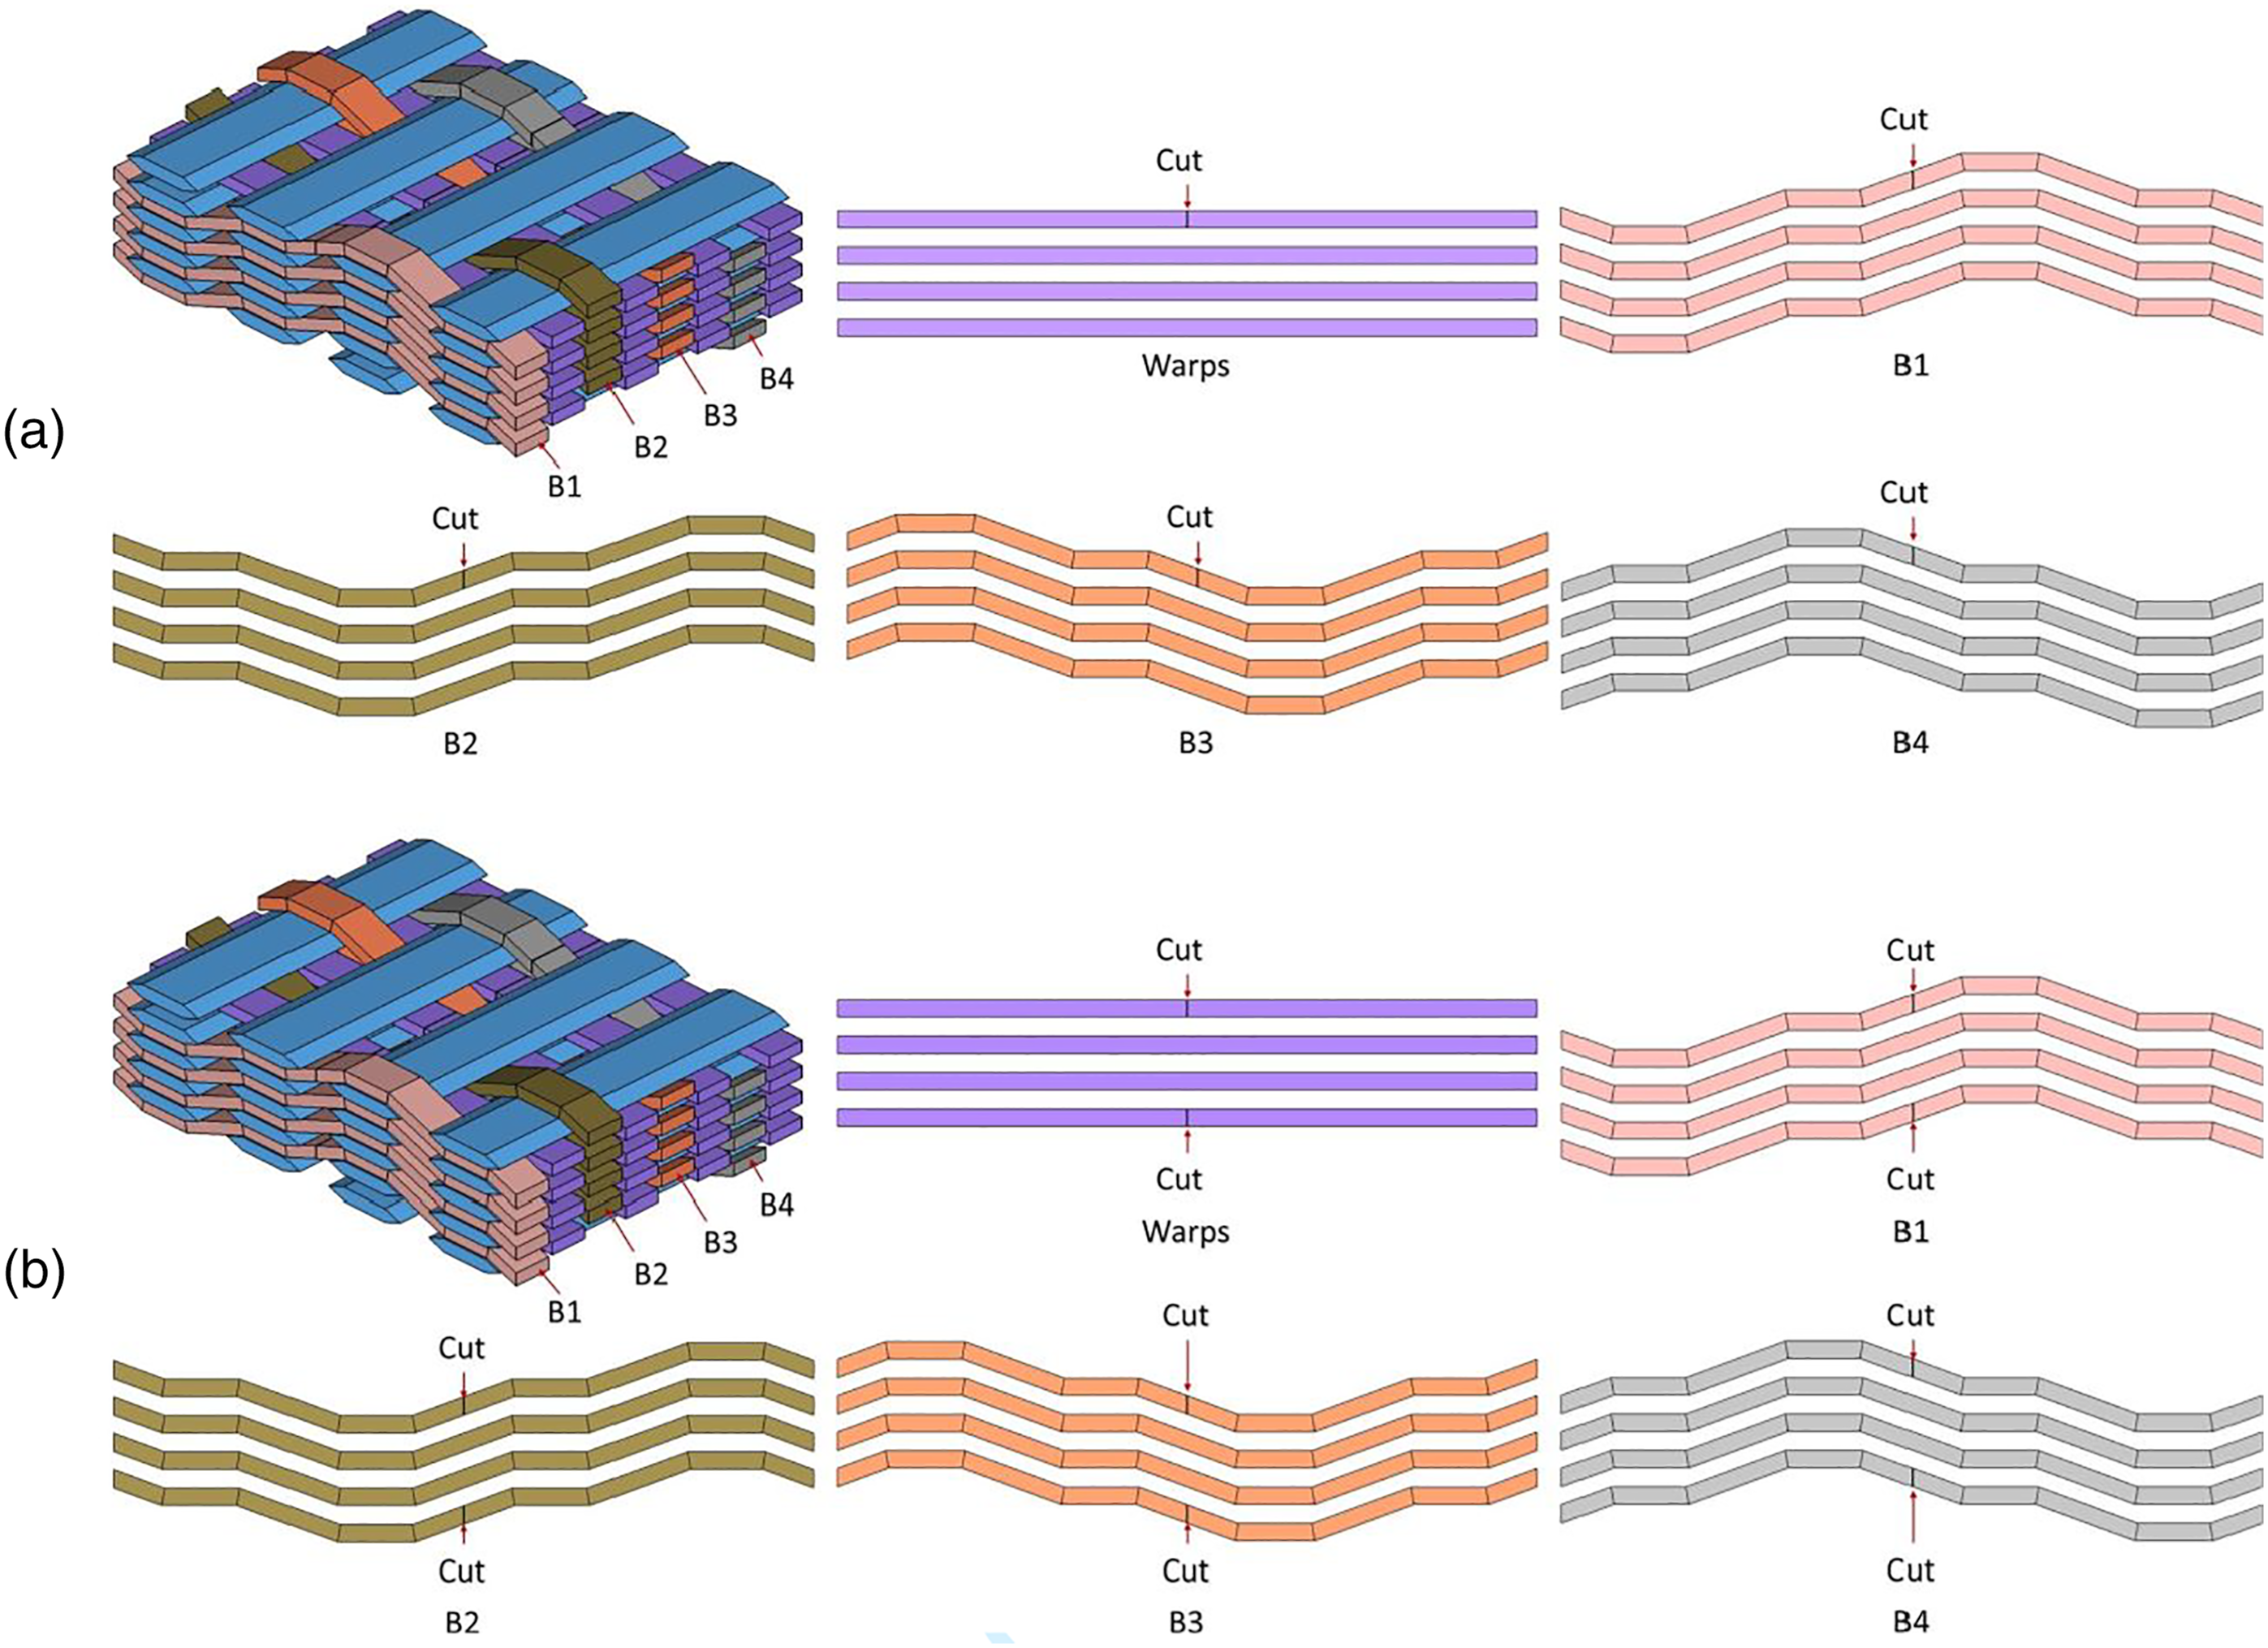
The cutting methods of weft defects are shown in Figure 6. It is seen that two- and four-layer defects are made by one- and two-layer weft yarns cut on each side of the RVE, while three-layer defects are made by one-layer weft yarns cut on one side and two-layer weft yarns cut on the other side. The cutting method of warp defects is similar to the one of weft defects, as shown in Figure 7. One-layer defects are made by cutting one-layer warp and binder yarns on one side, and two-layer defects are made by cutting one-layer warp and binder yarns on each side. The positions of wefts cut. (a) Two-layer wefts cut; (b) three-layer wefts cut; (c) four-layer wefts cut. The positions of warp and binder yarns cut. (a) One-layer warp and binder yarns cut; (b) two-layer warp and binder yarns cut.
Boundary conditions
Due to the periodicity of the defect-free 3D woven composites, periodicity conditions should be ensured during finite element analysis based on RVE. In order to ensure the continuity of the stresses and displacements on the boundary surfaces of RVE, the periodic boundary conditions are applied. The unified periodical boundary conditions for a parallelepiped RVE proposed by Suquet
20
are adopted, namely
Since 
Since the model of the defect-free 3D woven composites is a full-cell model, the upper and lower boundaries are the actual boundaries of the cell. Due to the defects of the defective materials destroyed the periodicity of the structure, the periodic boundary conditions do not apply to their finite element model. Therefore, mixed boundary conditions widely used in simulation of composites and expressed by equations (20) and (21) are adopted herein for the cases of the model under the x (weft) and y (warp) loadings, respectively

Materials and properties
Mechanical parameters of carbon fibre and matrix.

Progressive damage model
Effectively simulating the initiation and development of damage of yarns used as the reinforcements of 3D woven composites is essential to get the non-linear mechanical behaviour reasonably and predict the strength of the studied defect-free and defective composites effectively. Hashin criterion in, 24 widely used in the failure analysis of unidirectional fibre composites by many researchers, is adopted to describe the damage of unidirectional fibre composites (yarns) to effectively simulate various typical failure modes of unidirectional fibre composites. The 3D Hashin criteria in 25 can be employed as damage initiation criteria of yarns. Hashin criteria are summarized as follows:
Fibre tensile failure (SDV1), for 


The resin matrix is generally considered as an isotropic material, and the von Mises failure criterion is used as damage initiation criterion. The von Mises failure criterion is formed as follows
Coefficients of material performance degradation.

Results and discussions
The yarns and matrix are modelled with 4-node linear tetrahedron elements (C3D4), and the perfect interfaces are modelled with sharing common nodes. In this study, the shear non-linear factor of yarns is
Determination of local model size
In order to determine the size of the local microstructure model of DP3DWCs, the lengths in weft direction of the finite element models with three-layer weft yarns cut are taken as L, 1.25L, 1.5L, 1.75L and 2L, where L is the length in weft direction of the defect-free unit cell model. The obtained elastic modulus and strengths are obtained by numerical simulations. Figure 8 shows a bar graph of the obtained elastic modulus and strengths using the model with aforementioned five lengths in weft direction. Elastic modulus and strengths of different sizes models with three-layer weft yarns cut.
From Figure 8, it can be seen that elastic modulus in weft direction shows an increasing trend with the increase of the length in weft direction of the local microstructure model, but the absolute growth value is very small. The change of the weft tensile strengths does not have an obvious trend. The coefficient of variation of the elastic modulus and strengths calculated from the above five size models are small and only 0.60% and 2.53%, respectively. This observation indicates that the change of model size has little effect on the elastic modulus and tensile strength. The possible reason may be that the width of the defects in models is very small, where the change of the local model size has little effect on its fibre volume fraction. Considering the calculation accuracy and convenience, the size of the local microstructure model of defective materials is the same as the one of the unit cell model of the non-defective materials.
Comparison with experimental results
Experimental and predicted elastic modulus and strengths of the defect-free 3D woven composites.

Experimental and predicted strengths of the defect-prefabricated 3D woven composites with different defects.

Analysis of the numbers of defect layers
To study the effect of the number of defect layers on the elastic modulus and tensile strength, the simulations based on models with one-layer weft yarns and three-layer warp and binder yarns cut were also performed. Stress–strain curves of defect-free model as well as defective models containing one-, two-, three- and four-layer weft yarns cut under the tensile loading in weft direction were obtained and shown in Figure 9(a). Stress–strain curves of defect-free models as well as defective models having one-, two- and three-layer warp and binder yarns cut under the tensile loading in warp direction were obtained and shown in Figure 9(b). Tensile stress–strain curves of models. (a) Weft loading; (b) warp loading.
From Figure 9(a), it can be seen that the stress–strain curve of the defect-free model is basically linear when the strain is less than 0.9%. However, stress–strain curves of defective models exhibit obviously non-linear change while strains reach about 0.17%. A sudden drop exists in stress–strain curves of models containing three- and four-layer weft yarns cut indicating that the resin filled in defects is damaged. As the strain increased, the stiffness of the defective materials is redistributed, and thus stress–strain curves become linear again, but their slopes decrease with the increase of the number of defective layers. With the accumulation of damage, the stress–strain curve of the defect-free model reaches a peak value at a strain of 1.12%, and the stress–strain curves of models containing one-, two-, three- and four-layer weft yarns cut reach a peak value at strains of 1.08%, 1.04%, 1.06% and 0.92%, respectively. After that, all stress–strain curves drop sharply indicating that the damage is rapidly expanded and the materials loss their load-bearing capacity.
From Figure 9(b), it is observed that the stress–strain curve of the defect-free model under warp loading is basically linear when the strain is less than 0.78%, while the curves of all defective models under warp tensile loading become non-linear when the strain only reaches about 0.20%. Compared to the cases under the weft tensile loading shown in Figure 9(a), difference exists that linear segment does not appear again with the increase of the strain. The stress–strain curves of the defect-free model and defective models having one-, two- and three-layer warp and binder yarns cut reach peak values at strains of 1.62%, 1.44%, 1.38% and 1.15%, respectively. Similar to the cases under weft tensile loading, the damage of all models expands quickly after reaching their ultimate load, and then the materials loss their load-bearing capacity quickly. The linear region in stress–strain curves of models with weft and warp defects basically coincides with each other indicating that defects have little effect on the elastic modulus. While the peak value of the curves decreases with the increase of the number of defect layers indicating that the load-bearing capacity decreases with the increase of the defect layers.
The changes of the modulus and strength under the weft and warp tensile loading with the number of defect layers are shown in Figure 10. It is seen that the weft tensile elastic modulus decreases linearly with the increase of the numbers of defective layers, but the decrease is small. The elastic modulus of the four-layer defective model is only 4.4% lower than that of the defective-free model. The warp tensile modulus also shows a decreasing trend, but the variation is no longer linear. The reduction of the elastic modulus of the defective model with one-layer warp and binder yarn cut is relatively larger than the ones with more layers’ warp and binder yarn cut. Overall speaking, however, the reduction in elastic modulus is still small, and the elastic modulus of the three-layer warp and binder yarns defective model is only 6.1% lower than the one of the non-defective model. Curves of elastic modulus and strengths with the numbers of defective layers. (a) Elastic modulus; (b) strengths.
From Figure 10(b), it is observed that both warp and weft tensile strengths decrease linearly as the number of defect layers increases, and that strengths of models with four-layer weft yarns cut, three-layer warp and binder yarns cut are 65.0% and 54.2% less than the ones of non-defective models, respectively. This indicates that the yarns cutting defects have a great influence on the tensile strength of the studied 3D woven composites.
Failure mechanisms
The microstructures of 3D woven composites, existed interweave and extrusion between the yarns, are complex. Even under unidirectional tensile load, the constituent materials of 3D woven composites exhibit a complex state of stress, and thus eventually fail in the coupling and mutual promotion of various damage forms. Figure 11(a)–(d) and (f) are SEM photomicrographs of fracture surface of the specimens subjected to weft and warp tensile loading, respectively. Figure 11(b) and (c) are the enlarged photographs of the red circled area in Figure 11(a) magnified by 100 times and 500 times, respectively. Figure 11(e) and (f) are the enlarged photographs of the red circled area in Figure 11(d) magnified by 100 times and 500 times, respectively. Fracture morphologies of yarns. (a)–(c) Weft loading; (d)–(f) warp loading.
From Figure 11(a) and (d), it is seen that damages of yarns in the materials are mainly fibre failure and transverse cracking. When the materials are under weft tensile loading, the failure modes of yarns in the weft and warp direction are fibre failure and transverse cracking, as shown in Figure 11(b). While the materials are subjected to warp tensile loading, the failure modes of the weft and warp yarns are transverse cracking and fibre failure, as shown in Figure 11(e). It can be seen from Figure 11(c) and (f) that transverse cracks caused by the failure of the resin in the yarns and the fibre tensile failure exist. Therefore, the failure criteria of fibre tensile failure and fibre compressive failure of the 3D Hashin criteria are used to simulate the fibre breakage of yarns, and the remaining five failure criteria are used to simulate the transverse cracking damage of yarns in numerical calculations.
Based on the above analysis, this study focuses on the progressive damage processes of fibre tensile failure in the studied defect-free and defective composites. The progressive damage processes of fibre tensile failure of the composites with defect-free, three-layer wefts cut, two-layers warp and binder yarns cut are shown in Figure 12, where the red colour denotes the damaged areas, and the blue colour represents the undamaged ones. Progressive damage processes of fibre tensile failure. (a) The defect-free model under weft tensile; (b) the defect-free model under warp tensile; (c) the model with 3-layer wefts cut under weft tensile; (d) the model with 2-layer warp and binder yarns cut under warp loading.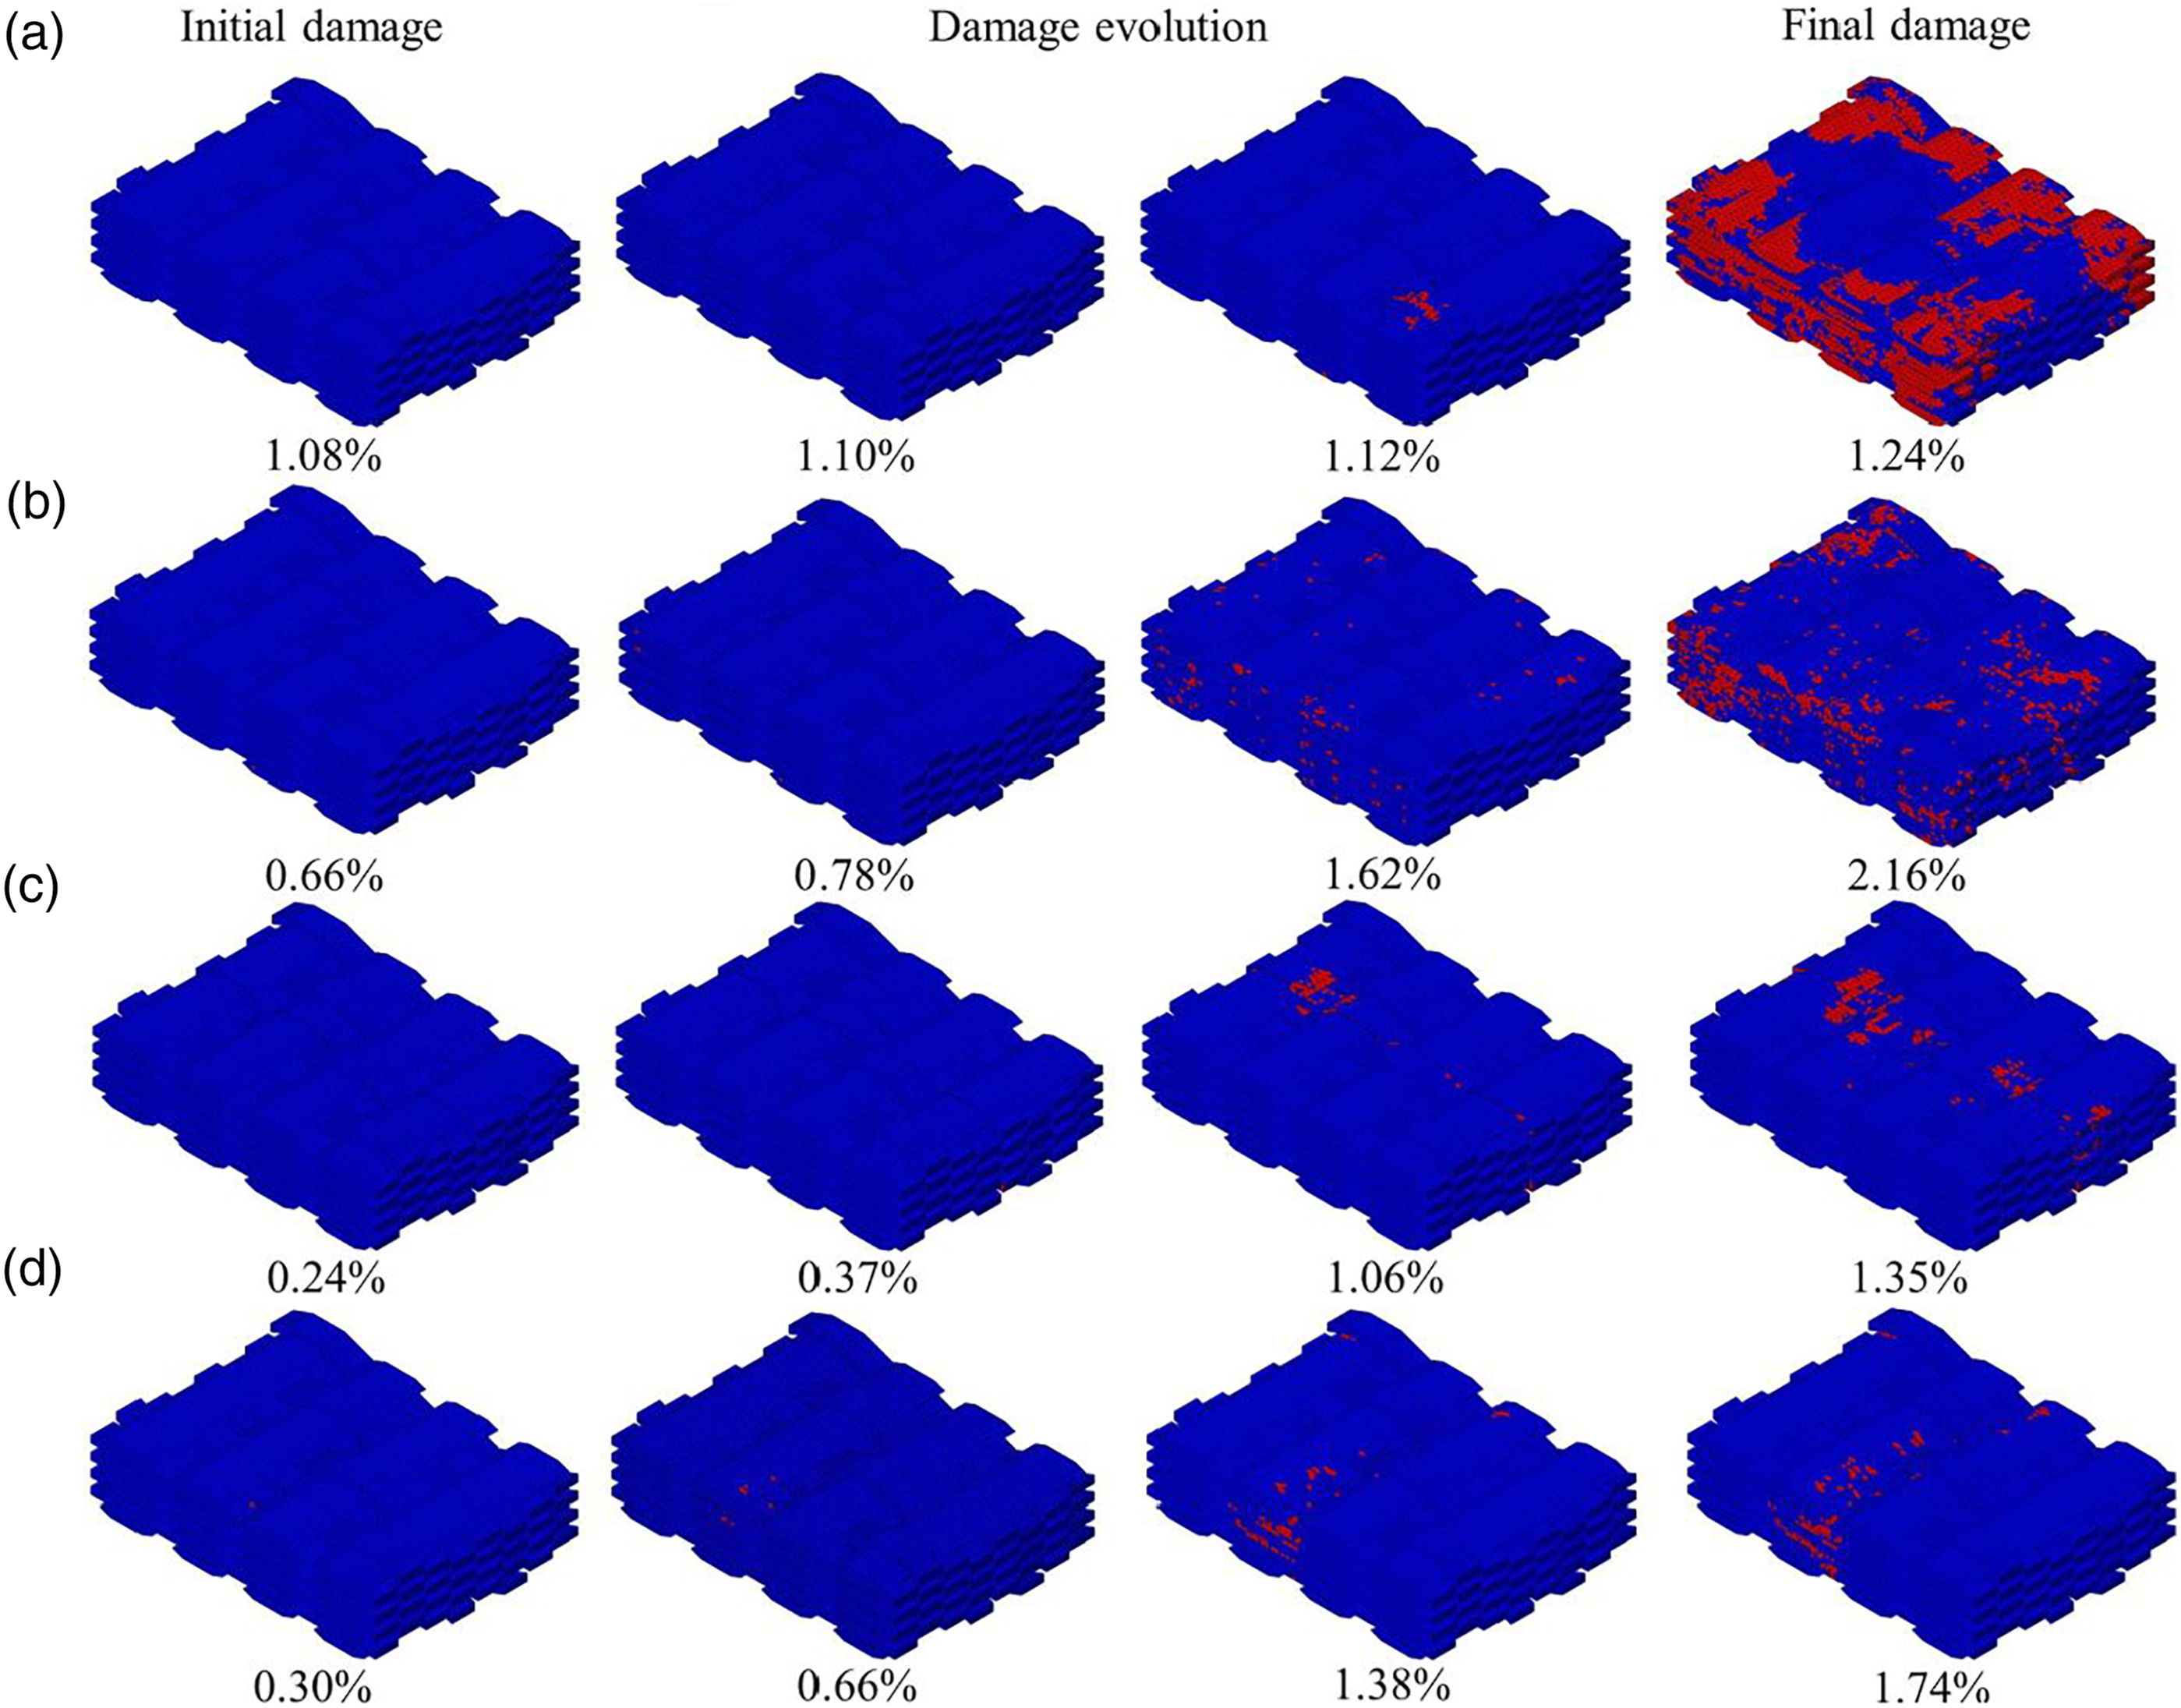
From Figure 12(a), it can be seen that the defect-free model under weft tensile loading exhibits fibre tensile failure in binder yarns when the strain reaches 1.08%, then the damage expands to the wefts at the strain of 1.10%. With the damage accumulation, the material reaches its ultimate load at the strain of 1.12%. Then, the damage expands rapidly at the strains of 1.12%–1.24% and eventually losses its load-bearing capacity at the strain of 1.24%. Finally, most damaged elements are in weft yarns.
It can be seen from Figure 12(b) that the defect-free model under warp loading exhibits fibre tensile failure in wefts when the strain reaches 0.66% and then the damage expands to binder yarns at the strain of 0.78%. With the damage accumulation, the material reaches its ultimate load at the strain of 1.62%. The damage expands rapidly in warp and weft yarns but slowly in binder yarns at strains between 1.62% and 2.16%. Finally, the material reaches the final damage state and losses its load-bearing capacity at the strain of 2.16%. The number of damaged elements is significantly less than the one of the model under weft tensile loading.
Figure 12(c) shows that the model with three-layer wefts cut subjected to the weft tensile loading exhibits fibre tensile failure in binder yarns at the strain of 0.24%. Damage occurs in the weft yarns at the strain of 0.37%. In the damage accumulation stage at strains varying from 0.37% to 1.06%, the damaged elements are distributed close to the defect area located in the middle of the model, and the number of damaged elements increases slowly. In the strains of 1.06%–1.35%, the damage expands rapidly in the uncut weft yarns until almost all elements in the middle area of the model failed, then the model losses its load-bearing capacity at the strain of 1.35%.
Figure 12(d) shows that the model with two-layer warp and binder yarns cut subjected to the warp tensile loading has fibre tensile failure in warp yarns when the strain reaches 0.30%. Damage in the weft yarns occurs at the strain of 0.66%. With the damage accumulation, the ultimate load occurs at the strain of 1.38%. When the strains vary from 1.38% to 1.74%, the damage expands rapidly in the uncut warp yarns. The damaged elements are distributed near the defect area located in the middle of the model, then the material losses its load-bearing capacity at the strain of 1.74%.
Figure 13 shows the final damage distributions of the matrix in the models with defect-free, three-layer wefts cut, two-layer warp and binder yarns cut. From Figure 13(a) and (b), it can be seen that when the defect-free model is subjected to the weft tensile loading, the damage elements of the matrix are concentrated at the two ends of the model in the weft direction and throughout in the warp direction, which are consistent with the damage positions of the weft yarns. However, when the defect-free model is under the warp tensile loading, the distribution of the damage elements of the matrix is relatively discrete but throughout in the weft direction. Final damage of matrix. (a) The defect-free model under weft loading; (b) the defect-free model under warp loading; (c) the model with three-layer wefts cut under weft loading; (d) the model with two-layer warp and binder yarns cut under warp loading.
Figure 13(c) shows that the damaged elements of the matrix in the weft defect model under weft tensile loading are distributed in the middle in the weft direction and throughout the warp direction. On the contrary, the damaged elements of the matrix in the warp defect model under warp tensile loading are mostly appeared in the middle in the warp direction and throughout the weft direction, as shown in Figure 13(d). The distributions of damaged elements in Figure 13(c) and (d) are consistent with the fracture morphology shown in Figure 2(d) and (g), respectively. It further indicates that the uncut yarns are the main components to bear the load in the DP3DWCs.
The volume fraction of failure elements
The various failure volume fractions of the defect-free model, the model with three-layer wefts cut and the model with two-layer warp and binder yarns cut caused by different failure modes are calculated. The relationships between the failure volume fraction and strain are given in Figure 14. Evolution of failure volume fraction with strain. (a) Various failure modes of the defect-free model under weft loading; (b) various failure modes of the defect-free model under warp loading; (c) various failure modes of the model with three-layer wefts cut under weft loading; (d) various failure modes of the model with two-layer warp and binder yarns cut under warp loading.
Figure 14(a) and (b) show that for the defect-free model under both the weft and warp tensile loadings, the first failure mode is the matrix tensile cracking in direction 2 (SDV3), and the corresponding strains are 0.83% and 0.54%, respectively. It is seen from Figure 14(c) and (d) that the first failure modes in the model with three-layer wefts cut and the model with two-layer warp and binder yarns cut are the matrix failure in the defects at the strains of 0.15% and 0.18%, respectively. Then, the failure of matrix tensile cracking in direction 2 (SDV3) occurs in the above-mentioned two models at strains of 0.18% and 0.36%, respectively. With the increase of the strain, other failure modes occur successively in all above-mentioned models, coupling and promotion to each other. With the damage accumulation and expansion, the number of failure elements of the above-mentioned four models tends to be stable at the strains of 1.24%, 2.16%, 1.35% and 1.74%, respectively.
The main failure modes in yarns of models under weft tensile loading are matrix tensile cracking in direction 2 (SDV3), matrix tensile cracking in direction 3 (SDV5) and fibre tensile failure (SDV1), as shown in Figure 14(a) and (c). The volume fractions of damaged elements with the above-mentioned three failure modes in defect-free models are 30.63%, 18.43% and 17.12%, respectively, while the ones with the above-mentioned three failure modes in the model with three-layer wefts cut are 16.90%, 9.56% and 6.49%, respectively.
Figure 14(b) and (d) show that the main failure modes of yarns in models under warp tensile loading are matrix tensile cracking in direction 2 (SDV3), matrix tensile cracking in direction 3 (SDV5) and matrix compressive cracking in direction 3 (SDV6). The volume fractions of damaged elements with the above-mentioned three failure modes in the defect-free models are 28.48%, 22.85% and 13.77%, respectively and the ones with two-layer warp and binder yarns cut are 13.87%, 9.22% and 5.88%, respectively. In addition, the volume fractions of damaged elements of the matrix at the final damage stage in the above-mentioned four models are 12.58%, 17.76%, 4.47% and 9.87%, respectively.
Conclusion
In this study, DP3DWCs whose defects are introduced by cutting weft or warp yarns in several layers are proposed and manufactured. Experimental and numerical study on their tensile mechanical properties is performed. Modulus and strength of DF3DWCs in weft and warp direction were obtained as well as the tensile strength in weft of DP3DWCs with two, three and four layers of defects and the tensile strength in warp of DP3DWCs with one and two layers of defects, respectively.
Progressive damage models of DF3DWCs and DP3DWCs are established by employing the 3D Hashin criteria and von Mises failure criterion. Numerical results agree well with the experimental data indicating that the finite element models are reasonable and effective. The effect of the number of defect layers on elastic modulus and tensile strength is discussed. The results show that the defects have relatively limited effects on the elastic modulus, but the strengths decrease linearly as the number of defective layers increases. When the specimens have four-layer weft defects and three-layer warp defects, the modulus only decreases by 4.4% and 6.1%, while the strength decreases by 65.0% and 54.2%, respectively.
Finally, failure mechanisms of yarns and matrix in the non-defective and defective materials are analysed as well as the volume fraction of elements of each failure mode. Compared with DF3DWCs, the damaged area of DP3DWCs is more concentrated where all fractures occur around the zone of prefabricated defects. The main failure modes of both DF3DWCs and DP3DWCs are yarns tensile failure, yarns transverse cracking and matrix fracture. The yarns along the stretching direction are the main load-bearing components.
Different locations of the prefabricated defects definitely affect the mechanical behaviour of the 3D woven composite with defects and should be investigated for practical applications. However, this is beyond the scope of this study. This research laid the foundation for designing the prefabricated defect woven composite structural components.
Footnotes
Declaration of conflicting interests
The author(s) declared no potential conflicts of interest with respect to the research, authorship, and/or publication of this article.
Funding
The author(s) disclosed receipt of the following financial support for the research, authorship, and/or publication of this article: This work was supported by the National Natural Science Foundation of China (Grant No. 52005256), the Natural Science Foundation of Jiangsu Province (Grant No. BK20190394), the Fundamental Research Funds for the Central Universities (Grant No. NS2019001), the Jiangsu Post-doctoral Research Funding Program (Grant No. 2020Z437), the Shanghai Aerospace Science and Technology Innovation Fund (Grant Nos. SAST2019-063, SAST2020-001), the Research Fund of State Key Laboratory of Mechanics and Control of Mechanical Structures (NUAA) (Grant No. MCMS-E-0220Y02), the Nanjing Science and Technology Innovation Project for overseas scholars of 2019 and the Priority Academic Program Development of Jiangsu Higher Education Institutions.