
Abstract
Geometric reconstruction is an important precondition for the computational micromechanics analysis of chopped fiber reinforced composites. When fiber aspect ratio increases, the maximum fiber volume fraction in reconstruction model reduces rapidly because of jamming limit, which greatly limits the application of reconstruction methods. A novel algorithm is proposed to significantly increase the fiber volume fraction in the reconstruction model of the chopped fiber reinforced composites with large fiber aspect ratio. The algorithm is made up of two stages. At the first stage, fibers are packed into the sublayers of initial filling space to preliminarily design fiber orientation distribution. The unidirectional arrangement of fibers is adopted to achieve high fiber volume fraction. At the second stage, a new multi-step fiber shaking strategy is used to introduce randomness into reconstruction model. The high fiber volume fraction over 30% is achieved within the wide range of fiber aspect ratio from 50 to 200 while the results of the existing methods are not more than 10%, showing the remarkable increase of the fiber volume fraction under large fiber aspect ratio. The proposed algorithm is verified by the statistical results of the four representative microstructural characteristics from reconstruction model and realistic material.
Keywords
Introduction
Computational micromechanics based finite element method is regarded as the most promising method for research on composite material [1]. The first step of finite element method is to reconstruct the microstructures of composites, which is called geometric reconstruction. For reliable analysis result, the fibers in reconstruction model should distribute similarly as in realistic material, which depends on reconstruction algorithms.
Injection molded chopped fiber reinforced composites are widely used industrial materials [2–4] which show the significant advantages in cost, productivity and fabricability over conventional continuous fiber reinforced composites. For chopped fiber reinforced composites, there are two classes of strategies for geometric reconstruction. The first one is random sequential absorption (RSA) based packing algorithm. Fibers are randomly and sequentially filled into a space and penetrated fibers will be abandoned. This process will iteratively continue until target fiber volume fraction or maximum iteration number has been reached [5]. Pan [1] adopts curved fibers and divides RVE space into fiber-rich sublayers and matrix-rich sublayers, achieving 35.1% volume fraction with the fiber aspect ratio of 20 as a result. Kari et al. [6] reduces fiber aspect ratio in condition that volume fraction can hardly be increased to improve filling efficiency. Tian [7] proposes a fiber growth method and realizes 22.5% volume fraction within the range of fiber aspect ratio from 5 to 15. Besides, an improved RSA algorithm has been proposed by Tian [8] to efficiently generate RVE with specified particle orientation. Li [9] adds statistical orientation information in reconstruction and analyzes the relationship between the number and the orientation error of filled fibers. The fiber volume fraction of RSA based algorithm is mainly limited by fiber aspect ratio. The present fiber volume fraction of reconstruction model can not satisfy the analysis requirement of realistic composite material.
The second one is Monte Carlo based packing algorithm. Fibers are randomly put into a large box and shaken to avoid penetration. Then the box is squashed so that fiber volume fraction could be increased. Shaking and squashing processes are alternately conducted until an expected fiber volume fraction is reached [10,11]. Dirrenberger et al. [12] introduce Poisson law into Monte Carlo process to build the model of random fiber microstructure. Schneider [13] achieves a high fiber volume fraction by the local close arrangement of fibers using Sequential addition and migration (SAM) algorithm and gradient descent method, but the microstructure of the reconstruction model is obviously different from realistic material. Altendorf and Jeulin [14] reconstruct Monto Carlo simulation scheme based densely-packed fiber system. Fibers are bent too much so that systematic errors could be introduced in finite element analysis for cylindrical fibers such as chopped glass fiber. Monte Carlo based packing algorithm utilizes close arrangement or bending fibers to improve fiber volume fraction, reducing reconstruction accuracy and increasing application limitations. Due to Monte Carlo based random shaking process, fiber orientation distribution can not be controlled according to the microstructure of realistic material.
In the existing studies of reconstruction algorithm, the phenomenon that fibers can hardly be filled into a model when fiber volume fraction reaches a certain value is called “jamming”. The maximum fiber volume fraction currently achievable is the jamming limit. The theoretical and experimental curves of the jamming limit with respect to fiber aspect ratio are proposed by Evans and Gibson [15] and are confirmed by many studies [1,6,7,16–18]. For instance, the jamming limit of the composites with fiber aspect ratio equaling to 70 is not more than 10% according to Evans’ curve. However, the fiber volume fraction in realistic composite products with the same fiber aspect ratio could approach to 20% or higher values. Therefore, the jamming limit makes a great challenge on the application of geometric reconstruction algorithm to the computational micromechanics analysis of the chopped fiber reinforced composites with high fiber volume fraction and large fiber aspect ratio.
In this article, a novel algorithm is proposed to significantly increase the fiber volume fraction of geometric reconstruction model. The injection molding process of chopped fiber reinforced composites gives an inspiration. Before injection, fibers are unidirectionally distributed in granule which is the prefabricated material of injection molded composites. During manufacturing process, granules are melted, stirred and injected into injection molding machine. Fibers suffer sophisticated mechanical and fluidic actions which introduce the randomness of fiber distribution in material. Considering aforementioned process, a two-stage algorithm is proposed to build geometric reconstruction model. Firstly, fibers are unidirectionally arranged in filling space to efficiently improve fiber volume fraction. Several sublayers are adopted to preliminarily design fiber orientation distribution. Then, fibers are shaken by a multi-step strategy to introduce randomness into reconstruction model. By the proposed algorithm, one can build the geometric reconstruction model with much higher fiber volume fraction than the existing methods.
The remainder of this paper is organized as follows. Firstly, three basic definitions of fiber distributions are given. Secondly, the detailed algorithm mechanism is illustrated including the method of fiber initial filling and the multi-step shaking strategy. The comparison of the algorithm and the existing methods is conducted and analyzed. Then, the algorithm is verified based on the four microstructural characteristics of chopped fiber reinforced composites. The discussions and conclusions of this study are given in the last part.
Basic definitions
Microstructural characteristics have important influence on material properties [19–21] and some basic definitions of the characteristics of chopped fiber reinforced composite material are given in this section, including fiber orientation distribution, spatial distance of fibers and fiber length distribution.
Fiber orientation tensor
In Advani and Tucker’s research [22], two angles

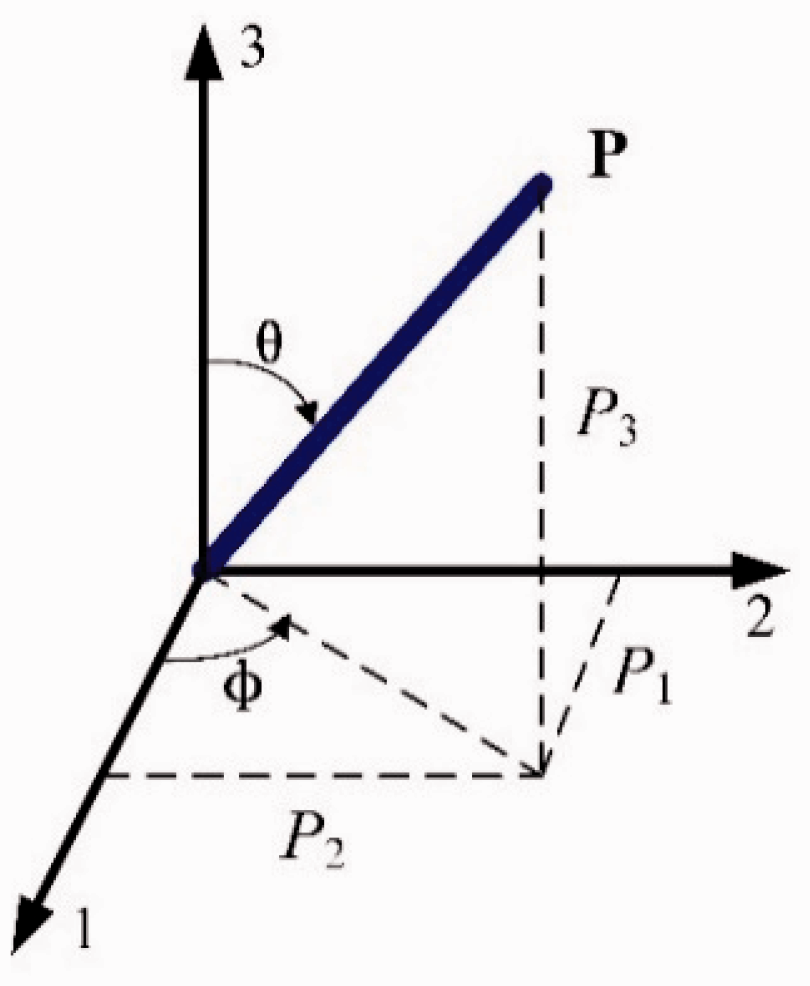
The definition of a single fiber
The fiber orientation distribution at a point in macroscale can be described by a probability distribution function,

Eigen values and eigen vectors are obtained by eigen-decomposition of orientation tensor [23]:


Spatial distance of fibers
The fibers in injection molded composites could be represented by the segments in three-dimensional space. As shown in Figure 2(a), define two segments as

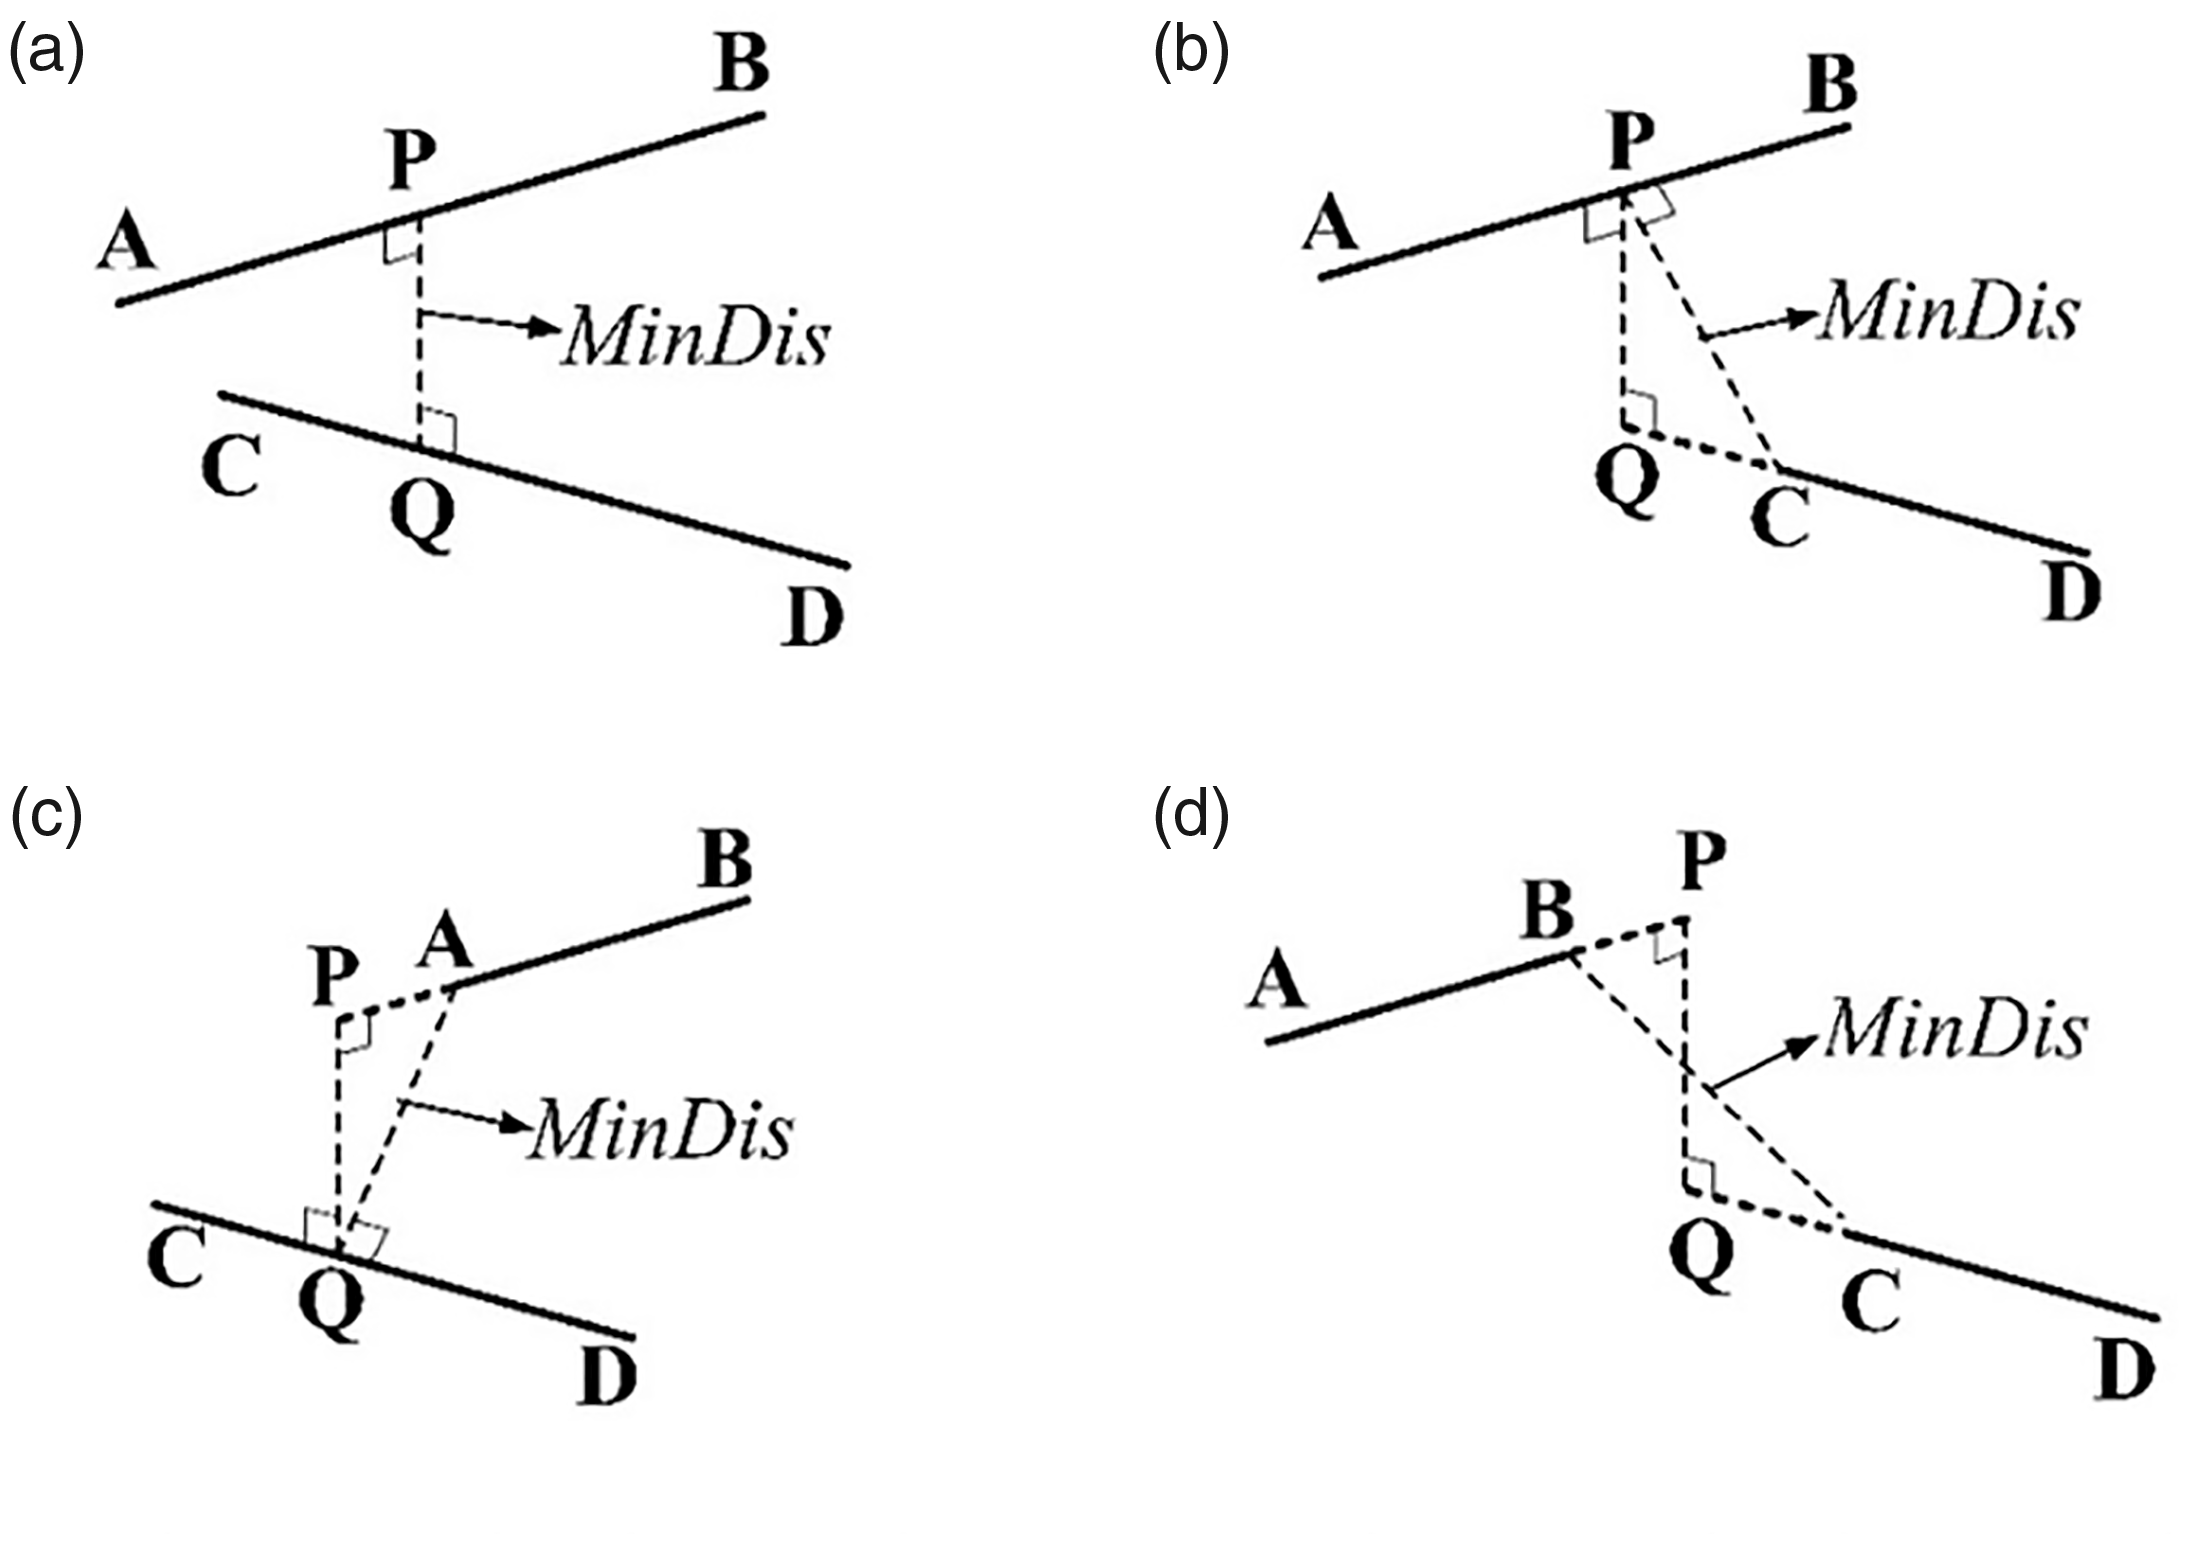
The four situations of the distance between two segments. (a)
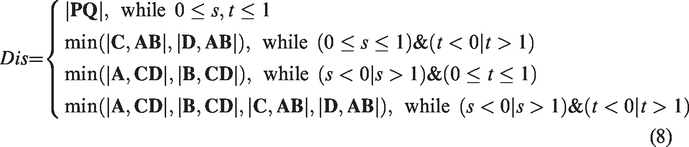
The squared distance between

There are four situations of the distance between two spatial segments according to the range of
Fiber length distribution
During injection molding process, part of fibers will be broken and fiber lengths obey skewed distribution. The fiber length distribution in the material with 20% fiber volume fraction is obtained from burning off the matrix. The burn-off temperature is 400 °C (752 °F) and the duration of burning is 3 hours. Over one thousand fibers are measured and the average length of fibers is around 800 μm. The fiber length histogram is shown in Figure 3. Use the Gamma distribution in equation (9) to fit the fiber length distribution and regenerate fiber lengths:


The fiber length histogram of composites with Vf = 20%.
The scheme of the algorithm
In this section, a novel algorithm is proposed to build the geometric reconstruction model of the chopped fiber composites with high fiber volume fraction and large fiber aspect ratio. The reconstruction process of the algorithm consists of two stages. In the first stage, fibers are unidirectionally arranged in initial filling space. Fiber orientation state is preliminarily designed by making use of sublayers. In the second stage, a multi-step strategy is used to shake fibers and introduce randomness into reconstruction model. In the end, the maximum fiber volume fraction of the proposed algorithm is compared with the performance of the existing methods and the results are analyzed and discussed.
Initial filling
In injection molded composites, fibers mainly lie in the injection flow plane with slight deflection angles out of the plane [24–26]. Thus, the component

In equation (10), the value of
Stapleton et al.’s study [28] indicates that fiber volume fraction can achieve up to 90.7% by unidirectionally filling, which can improve maximum fiber volume fraction significantly and is adopted in the first stage of initial filling. During initial filling process, fibers are arranged in one sublayer in the direction of

The schematic diagram of initial filling process. (a) Two sublayers when a1<0.6. (b) Three sublayers when a1≥0.6.
When

When

Gitman et al. [29] proposes the existence of wall-effect in the process of heterogeneous material reconstruction which refers to the inability of inclusions to penetrate through RVE boundaries. Wall-effect will lead to the change of material properties near RVE boundaries and weaken the representativeness of RVE. To avoid Wall-effect, Harper et al. [30] makes shaking region twice as large as RVE space to let fibers go through RVE boundaries freely. This study adopts Harper’s method to deal with Wall-effect.
In initial filling process, the fiber content near filling boundaries is generally lower than that in central region. This phenomenon is defined as the nonuniformity of fiber content in this study. To avoid the nonuniformity of fiber content, the size of initial filling region is twice as large as the size of shaking region. In this way, the fiber content within shaking region is uniform. Figure 5 shows an initial filling result of the chopped fiber reinforced composites with the fiber average aspect ratio

The initial filling result of the material with
A multi-step shaking strategy
During injection molding process, fibers experience sophisticated fluidic and mechanical effects, which lead to the nonuniform distribution of fibers in composite material. Imitating these effects, a multi-step shaking strategy is proposed in this part.
The shaking process is divided into three steps. The first step is global shaking and the state of fibers in shaking region will be tried to updated in this step. Use midpoint coordinates and two angles


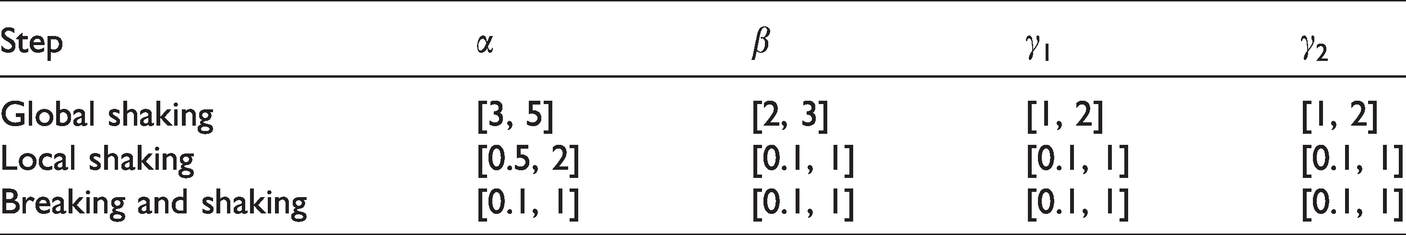
The recommended value ranges of coefficients in equation (14).
Once the state of a fiber is updated, the penetration tests are conducted between this fiber with the other fibers that have finished global shaking. If it passes penetration test, then it will be added into the fiber set of globally shaken fibers. On the contrary, if it fails to pass penetration test, a new shaking step will be generated for next attempt. A maximum attempt number is set for global shaking step and if a fiber fails to update its state within the specified number, it will be recorded in a predefined set to perform the local shaking in the second step.
In the second step called local shaking, the fibers shaken in the first step are fixed and more computing resources will be allocated to the fibers failing to update their state in the first step. For a fiber to be dealt with, a new shaking step is generated and its state is updated according to equations (13) and (14). If the new fiber passes penetration test, it will be added into the fiber set of locally shaken fibers. Otherwise, this process will be attempted continuously until the fiber passes penetration test or the maximum attempting number is reached. If it fails to update fiber state within the specified number, the fiber will be called a stubborn fiber and its length will be broken in the third step.
In the third step, stubborn fibers are broken and shaken. For a stubborn fiber, its aspect ratio and other surrounding fibers limit its shaking and state updating. Changing the state of surrounding fibers may create chain reactions and lead to more penetrated fibers, making the problem even more difficult. Decreasing its aspect ratio, however, is a feasible and practical way. During injection molding process, some of fibers are broken because of mechanical interactions. Inspired by this process, a stubborn fiber is broken so that its aspect ratio is reduced and its state is easier to be updated in this situation. The breakage is supposed to happen at the middle point of the fiber and two new fibers are obtained. Use the scheme in the second step to update the state of these two fibers and those pass penetration test will be added into fiber set of repositioned broken fibers. If a broken fiber still penetrates other fixed fibers, it will be deleted instead of being broken again, for breaking many times will lead to quite short fibers and influences the fiber length distribution in reconstruction model.
Each time before updating the state of a fiber, it is necessary to conduct the penetration tests between the fiber and other fibers. To make a physical sense, all the distances should be larger than fiber diameter. To avoid the distortion of finite element meshes, the minimum distance between surfaces of two fibers is specified to be 5% fiber radius 
As shown in the flowchart of the algorithm in Figure 6, the sets of globally shaken fibers, locally shaken fibers and repositioned broken fibers are recorded and these fibers will participate in the next iteration until the maximum number of iterations is reached and a geometric reconstruction model is obtained as a result.

The flowchart of the proposed algorithm.
Implementation
The implementation of the proposed algorithm is given in this section. The random fiber orientation distribution (

The maximum fiber volume fraction by the proposed algorithm versus the existing methods.
In Figure 7, the results of existing methods are divided into two classes. One includes methods for the reconstruction of 3D random fiber orientation distribution [7,17,18]. The other includes methods for the reconstruction of flow-plane random and slightly out of plane fiber orientation distribution (2.5D random fiber distribution) [1,16]. Results of these two classes of methods are respectively plotted in blue and red color. By the comparison of Evans’ jamming limit curves and the interpolation curve by this study, it is obvious that the maximum fiber volume fraction of methods for 2.5D random fiber distribution is higher than that for the 3D random fiber distribution in a wide range of fiber aspect ratio. The difference results from the low space utilization rate of 3D random fiber distribution. Actually, 2.5D random fiber distribution with higher space utilization rate is much more similar to microstructures of many practical chopped fiber reinforced composites, such as injection molded and compression molded chopped fiber reinforced composites.
For results of 3D random fiber orientation distribution,

The reconstruction models with different fiber aspect ratios. (a)
Verification of the algorithm
To verify the proposed algorithm, a high-resolution 3D micro computed tomography (μCT) system Xradia 520 Versa is applied to observe the microstructure of injection molded chopped fiber reinforced composites. The observed composite material is composed of E-glass fiber and polypropylene. The fiber volume fraction of samples ranges from 10% to 30% and the sample size is 2.5 mm × 2.5 mm × 3.5 mm. The exposure time of 1 s and the photon energy of 50 keV are adopted. The voxel edge size of 2.5 μm is obtained. A 3D image of composites and the μCT system are shown in Figure 9.

A 3D image of material and the μCT equipment. (a) A 3D image of injection molded composites. (b) The μCT system Xradia 520 Versa.
The studies of characterization of fiber reinforced composites [8,9,18,31–34] are referred to and four indexes, including fiber orientation distribution, fiber nearest-neighbor distance distribution, fiber length distribution and fiber volume fraction are chosen to quantitatively describe the microstructural characteristics. The fiber distributions of reconstruction model and realistic material are compared and the quantitative evaluation is given based on the concept of entropy.
Fiber orientation distribution
Fiber orientation distribution has a significant influence on the properties of chopped fiber reinforced composites [21]. Adopt the angles 

The sum of fiber distribution probability in all directions should equal to 1:
For the material with the fiber volume fraction
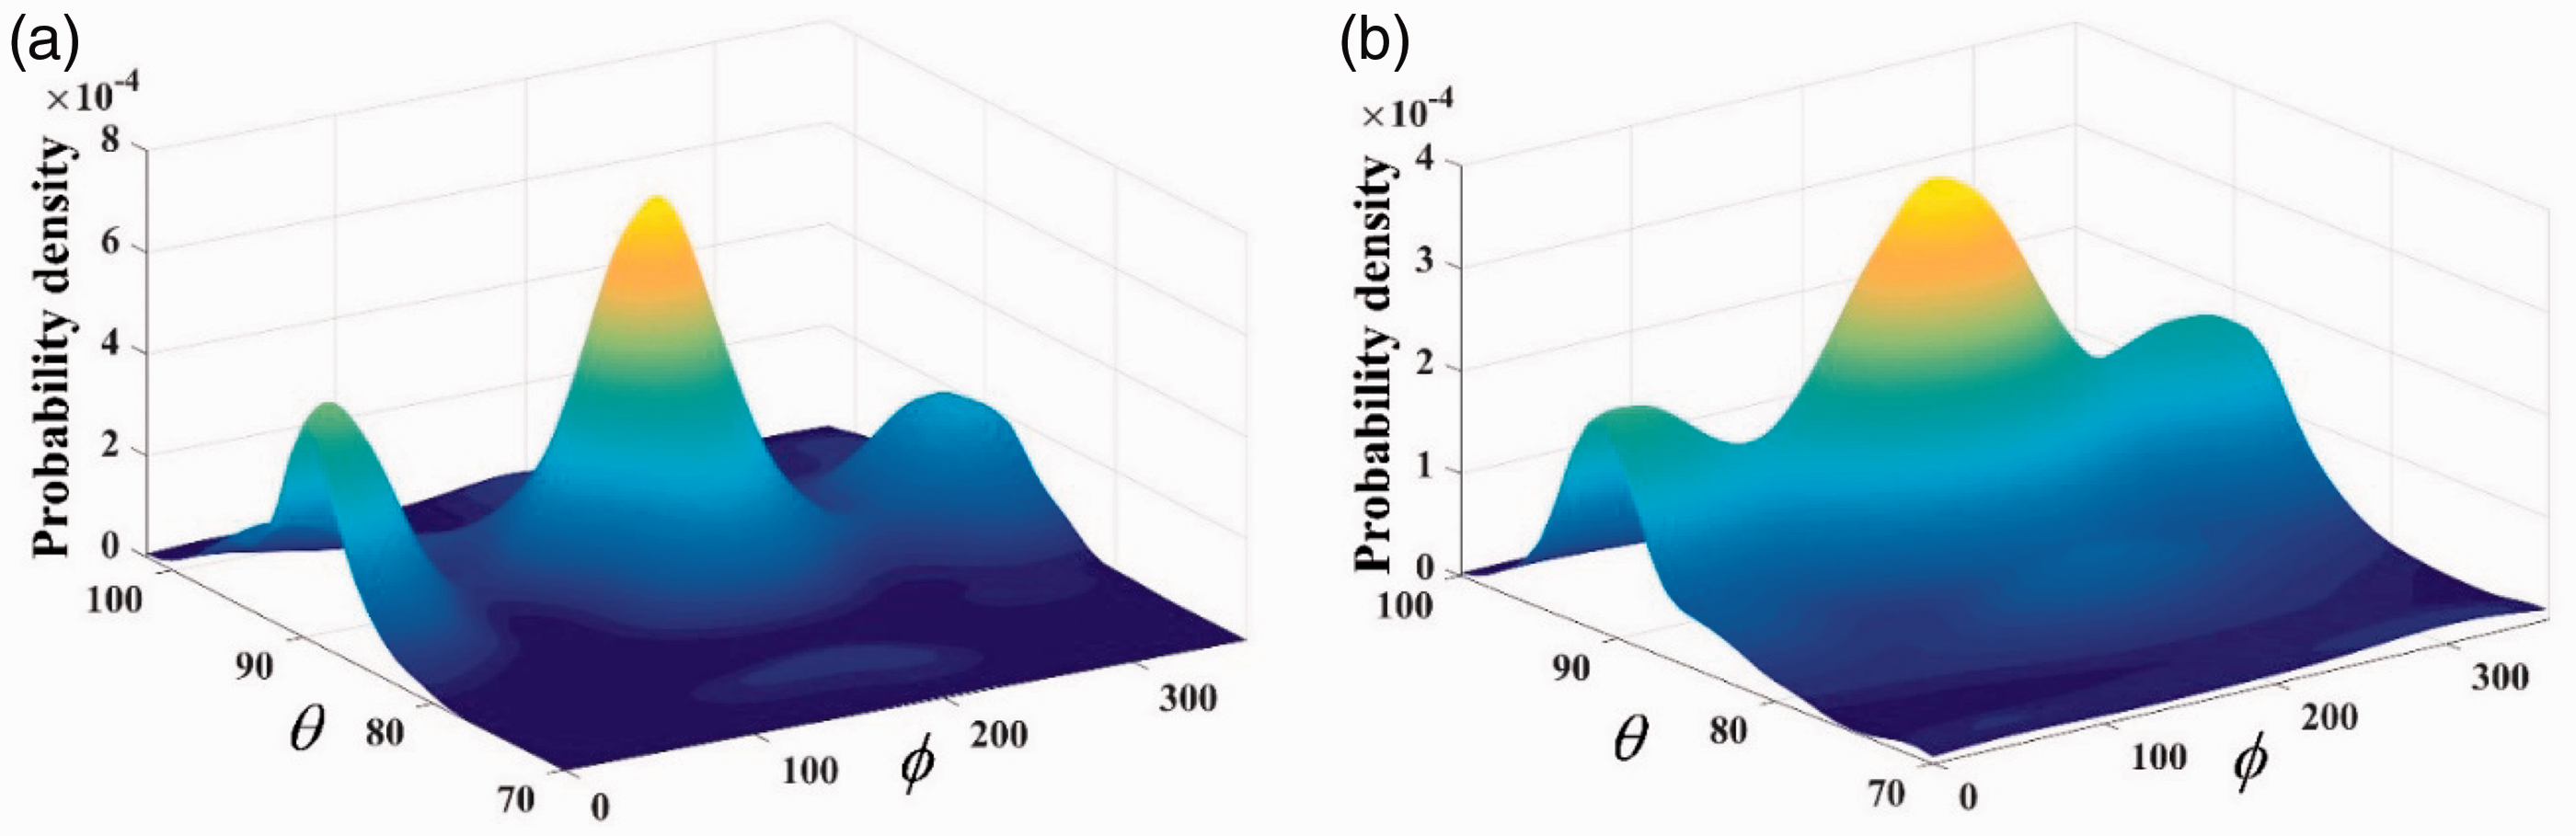
The joint PDF of the fiber angles
The reconstruction target is made to be
KL divergence, also called relative entropy, is an effective measurement index to quantify the mismatch between two PDF curves [35]. Define two PDFs 
Considering that fiber orientation distribution is joint probability density distribution of angles 

IS measures the difference of microstructural characteristics between realistic material and reconstruction model and is adopted in this article.
6 samples with different fiber volume fractions are tested, each containing over 100 fibers. For each sample, reconstruct material microstructure for 5 times and calculate the IS values. The trend of the IS values changing with fiber volume fraction is shown in Figure 11. The IS values show a slow upward trend with the increase of fiber volume fraction. The errors between two PDFs are quite small, indicating that the fiber orientation distribution of reconstruction model is accurate, which is of great importance to further finite element analysis.

The IS of fiber orientation distribution with variable
Fiber nearest-neighbor distance distribution
In material space, define the distance of arbitrary fiber 
For the material with the fiber volume fraction

The fiber nearest-neighbor distance distributions of realistic material and reconstruction model.

The IS of fiber nearest-neighbor distance distribution with variable
Fiber length distribution
It is proved by Thomason’s study [19] that fiber length plays an important part on the strength of chopped fiber reinforced composites. Bowyer and Bader [37] gives the formula of fiber critical length to explain its influence on the failure mode of the composites:
The PDF of fiber lengths in the realistic material with

The fiber length distributions of realistic material and reconstruction model.

The IS of fiber length distribution with variable
Fiber volume fraction
Fiber volume fraction mainly influences the elastic properties of chopped fiber reinforced composites [40]. Two groups of tests are conducted to evaluate the errors of the fiber volume fractions in reconstruction models.
Make the fiber aspect ratios be 50 and 100, respectively. Fix the fiber orientation state
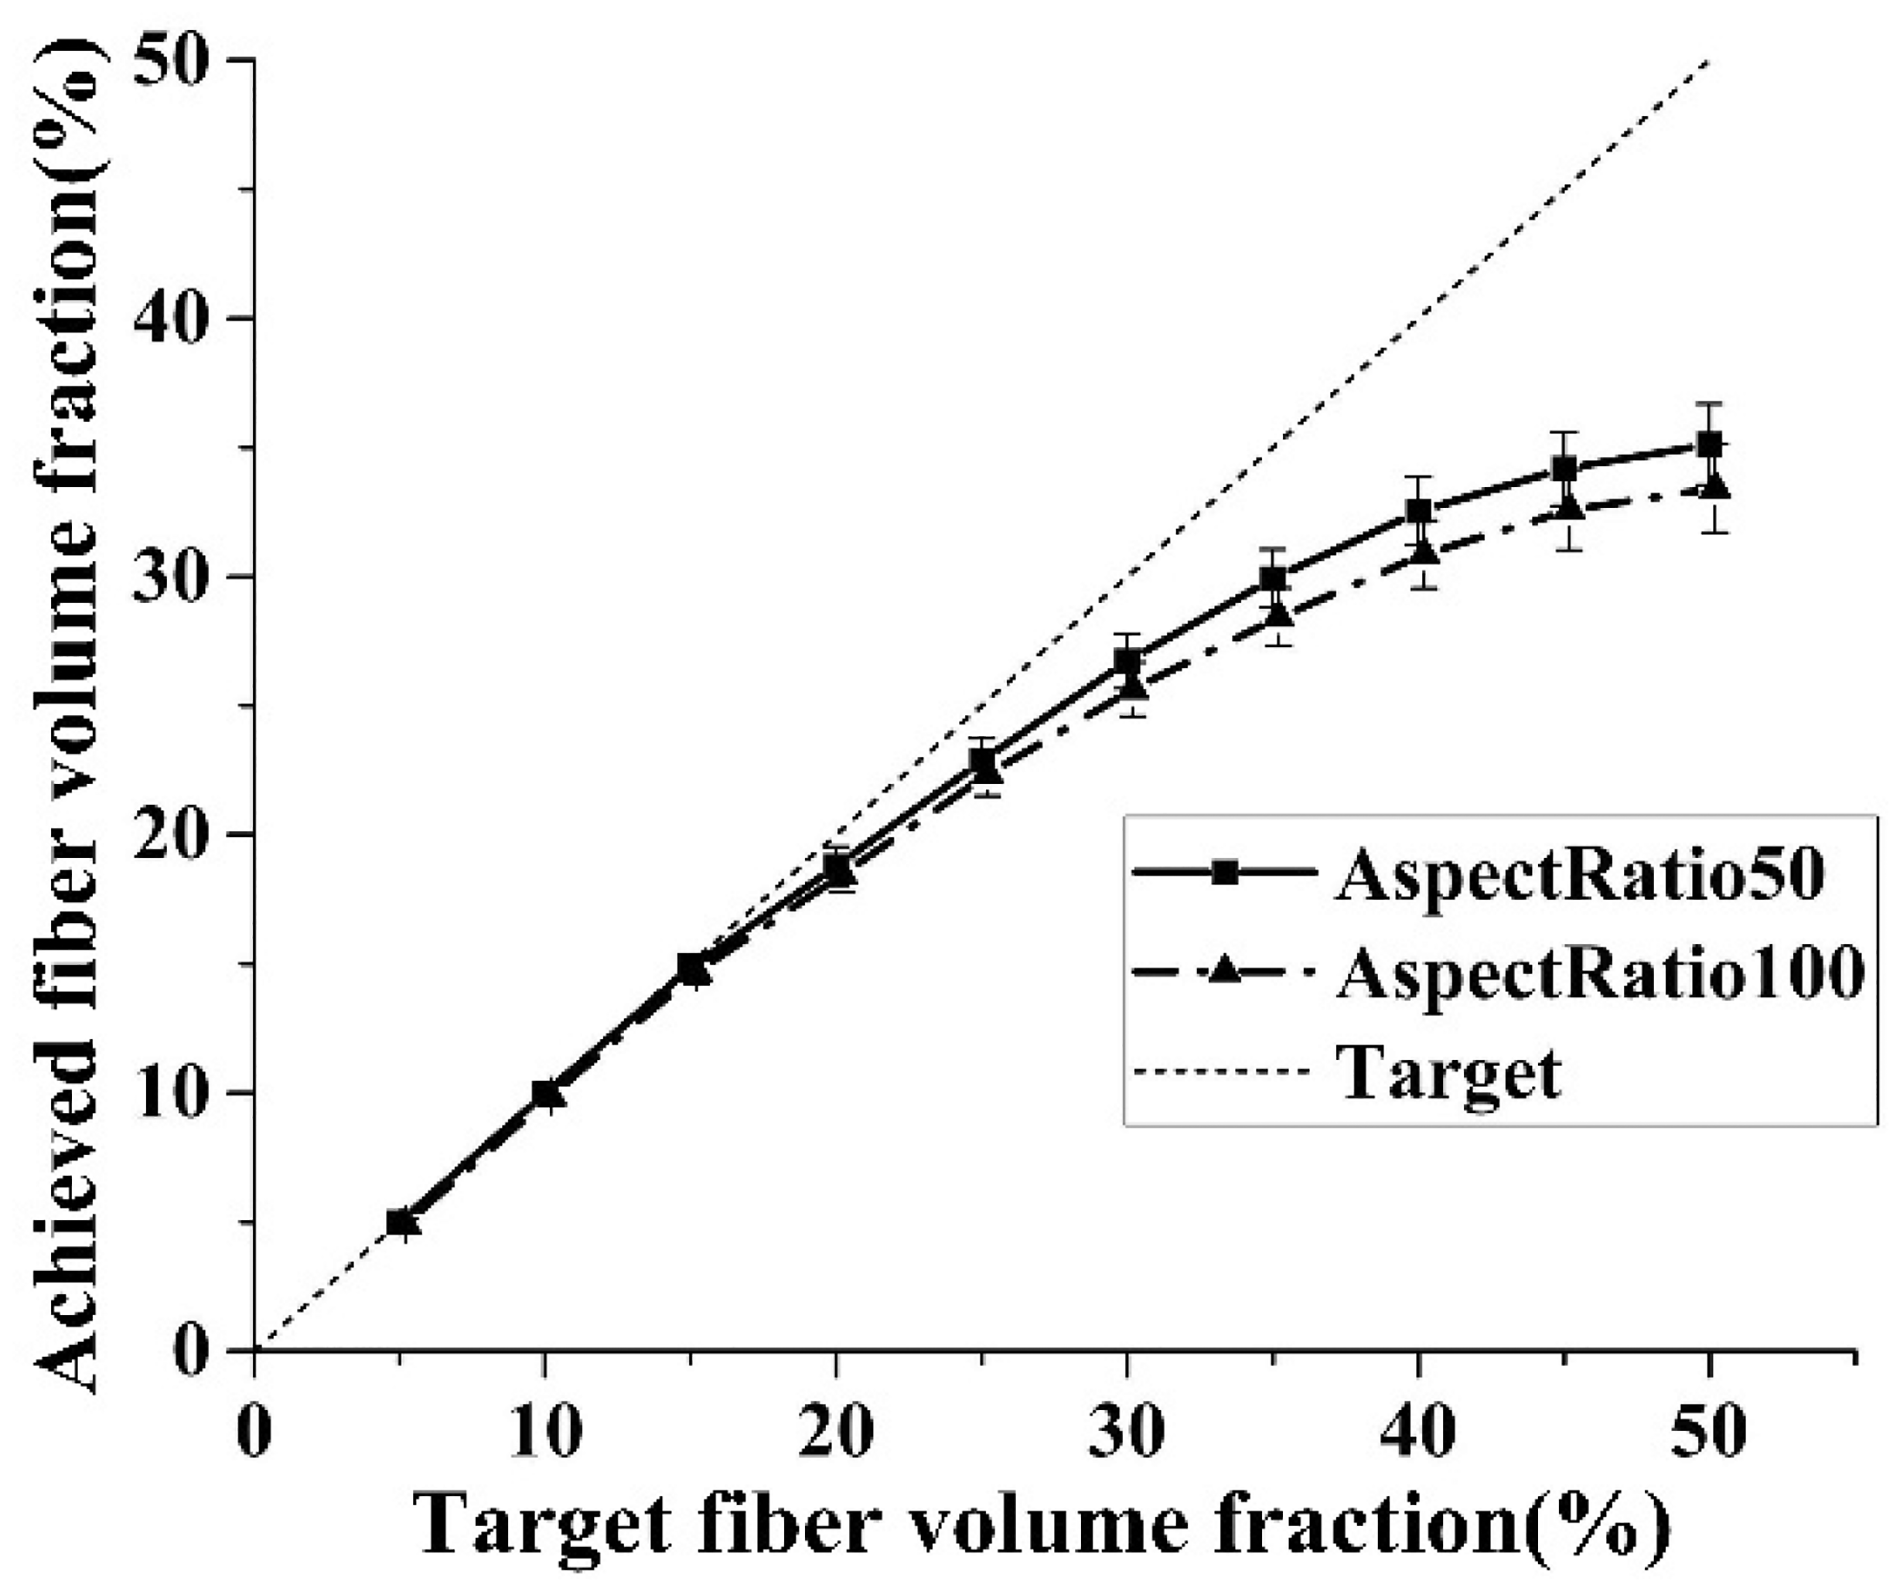
The errors between achieved
Discussion and conclusion
Discussion
A novel algorithm is proposed in this article to significantly increase the maximum fiber volume fraction of the reconstruction model for the chopped fiber reinforced composites with large fiber aspect ratio. The reconstruction process of the algorithm is divided into two stages. In the first stage, fibers are unidirectionally arranged in initial filling space. Fiber orientation state can be preliminarily designed using sublayers. In the second stage, fibers are adequately shaken and partly broken imitating the sophisticated flow and mechanical actions during injection process. In this way, not only the maximum fiber volume fraction is significantly increased but also one can design the microstructural characteristics of reconstruction model. The proposed algorithm breaks through the jamming limit during the geometric reconstruction process of chopped fiber reinforced composites. The comparisons with the existing methods show that the results of the proposed algorithm are better in the wide range of fiber aspect ratio from 10 to 200. The advantage of the algorithm is much more significant when the fiber aspect ratio is larger than 50, in which condition the result of this article is higher than 30% while the results of the existing methods are less than 10%. The high fiber volume fraction and the large fiber aspect ratio of the reconstruction model by the proposed algorithm can satisfy the requirements of majority materials. Four representative characteristics are chosen to quantitatively evaluate the accuracy of the algorithm based on the concept of entropy.
Despite of the aforementioned advantages, some limitations of the proposed algorithm are given for an objective perspective. Firstly, Filling of curved fibers is beyond the capability of the proposed algorithm. Another limitation results from the assumption that the component of orientation tensor
Conclusion
The main contributions of this article are as follows: A novel algorithm is proposed to increase the maximum fiber volume fraction of the reconstruction model of the chopped fiber reinforced composites with large fiber aspect ratio. The proposed algorithm is proved to be better than the existing methods in the wide range of fiber aspect ratio for 10 to 200. When the fiber aspect ratio is larger than 50, the more significant advantage is shown that the maximum fiber volume fraction is higher than 30% compared to 10% by the existing methods. The fiber orientation distribution and the fiber length distribution of reconstruction model can be predesigned and controlled by the proposed algorithm, which provides more practical results for subsequent studies. The statistical descriptions of four representative microstructural characteristics, including fiber orientation distribution, fiber nearest-neighbor distance distribution, fiber length distribution and fiber volume fraction, are used to verify the proposed algorithm by comparing the statistical results of reconstruction models and micro-CT images of realistic material.
The proposed algorithm is quite effective in increasing the fiber volume fraction of the reconstruction model with large fiber aspect ratio, enhancing the applicability of reconstruction model to the computational micromechanics analysis of practical composites products. The composites with thin shell such as injection molded chopped fiber composites and sheet molded compounds chopped fiber composites are recommended to be reconstructed by the proposed algorithm.
Footnotes
Declaration of conflicting interests
The author(s) declared no potential conflicts of interest with respect to the research, authorship, and/or publication of this article.
Funding
The author(s) disclosed receipt of the following financial support for the research, authorship, and/or publication of this article: This research is supported by the Key National Natural Science Foundation of China (Grant No.U1864211) and the National Natural Science Foundation of China (Grant No.11772191).