
Abstract
The bending test is one of the most important tests that demonstrates the advantages of functional gradient (FGM) materials, thanks to the stress gradient across the specimen depth. In this research, the flexural response of functionally graded polymeric composite material (FGM) is investigated both experimentally and numerically. Fabricated by a hand lay-up manufacturing technique, the unidirectional glass fiber reinforced epoxy composite composed of ten layers is used in the present investigation. A 3-D finite element simulation is used to predict the flexural strength based on Hashin’s failure criterion. To produce ten layers of FGM beams with different patterns, the fiber volume fraction (Vf%) ranges from 10% to 50%. A comparison between FGM beams and conventional composite beams having the same average Vf% is made. The experimental results show that the failure of the FGM beams under three points bending loading (3PB) test is initiated from the tensioned layers, and spread to the upper layer. The spreading is followed by delamination accompanied by shear failures. Finally, the FGM beams fail due to crushing in the compression zone. Furthermore, the delamination failure between the layers has a major effect on the rapidity of the final failure of the FGM beams. The present numerical results show that the gradient pattern of FGM beams is a critical parameter for improving their flexural behavior. Otherwise, Vf% of the outer layers of the FGM beams, i.e. Vf% = 30, 40, or 50%, is responsible for improving their flexural strength.
Keywords
Introduction
Functionally graded materials (FGMs) are a new generation of engineered materials. With this type of material, the microstructural details are spatially varied through the non-uniform distribution of the reinforcement phase(s). These variations in the microstructure created by using reinforcement with different properties, sizes, and shapes, as well as by interchanging the roles of reinforcement and matrix phases in a continuous manner [1]. FGMs are ideal candidates for applications involving severe thermal gradients, ranging from computer circuit boards to thermal structures in advanced aircraft and aerospace engines.[2]. In FGM, both the composition and the structure gradually change over the volume, and this transition results in a corresponding change in the properties of the material. FGM can be composed of various ingredients either chemically, physically, or geometrically. In the simplest FGMs, two different material ingredients change gradually from one to another. The FGM concept is applicable to many fields including engineering applications, cutting tools, machine parts, engine components, and other situations where stresses such as heat, wear, and corrosion resistance must be addressed [3].
Various fabrication methods can be used to produce FGMs using conventional manufacturing techniques, including forging and gel-casting[4]. For more complex parts, different techniques can be employed, including laser engineered net shaping and direct light fabrication [5,6], direct metal deposition [7], laser additive manufacturing[8], and laser solid forming [1]. Casting and pressing techniques can be excellent means to manufacturing FGMs. These techniques are scalable and cost effective for efficient production of such composites [9].
Many studies have been conducted of the fabrication of the FGMs, and various materials have been used to manufacture FGMs. Kahlen [10] used the direct metal deposition method to produce an FGM consisting of stainless steel and nickel. Banerjee et al.[11]fabricated graded materials using stainless steel 316 L, incorporating a laser solid forming technique. Al/SiC FGMs were produced using a remelting and sedimentation technique, and they have also been produced using centrifugal casting [12]. Park et al. [13] used a gel casting technique to produce an FGM consisting of Al2O3/ZrO2 materials. Gel-casting is a well-known colloidal processing technique having the advantages of a short forming time, high green capacity, high yields, and low-cost machining.
The stiffness and strength of the face sheet’s of a composite sandwich structure is higher than that its core [14]. The main defect encountered when using the composite sandwich structure is the weak bond between the facings and core materials [14,15], as this can cause delamination damage. The concept of FGM can be used to reduce the effects of delamination damage on the composite sandwich structure [15]. Most of the functionally graded polymeric matrix composites are reinforced with particles or short fibers [16–21]. To the best of authors’ knowledge, there is limited extant research that addresses functionally graded long-fiber composites [22–24]. Therefore, the present work tries to study the flexural behavior of this type of FGMs under static loadings according to ASTM D7264/D7264M-15 [25]. In the present study, epoxy and long glass fibers were used to manufacture FGM using the gel casting and pressing techniques. The main objective of the present work is to improve the flexural strength of conventional polymeric composite materials by using the FGM technique. The FGM technique is used to reduce the effect of the bending strain at the outer surfaces of the beams by increasing the density of the glass fiber in the outer surfaces and in a regular pattern, decreasing the density to reach minimum fiber density at the center of the beams. The present work is mainly devoted to assessing the bending stiffness and toughness of glass fiber/epoxy laminates when the lower and upper face density fiber increases. The underlying idea aims at suggesting a potential alternative to conventional sandwich panels that are widely used in the transport industry. To achieve this objective, in this present investigation, ten layers are used, and the fiber volume fraction is varied from the center of the sample to the skin. The effect of the varying of the fiber volume fraction of the ten layers on the flexural strength under 3PB loading is investigated. To extend the goal, range, and impact of the present study, a 3-D finite element (FE) simulation is used to predict the flexural strength of the long glass fiber-epoxy composites, based on Hashin’s failure criterion. The advantages of 3-D FE simulation serve to take into account the through-thickness effects, delamination effects, and to predict more accurately the failure mode of composite laminates.
Experimental work
In this part of the paper, the hand lay-up manufacturing technique, as well as the characterization of the test specimens, is described.
Material preparation and properties
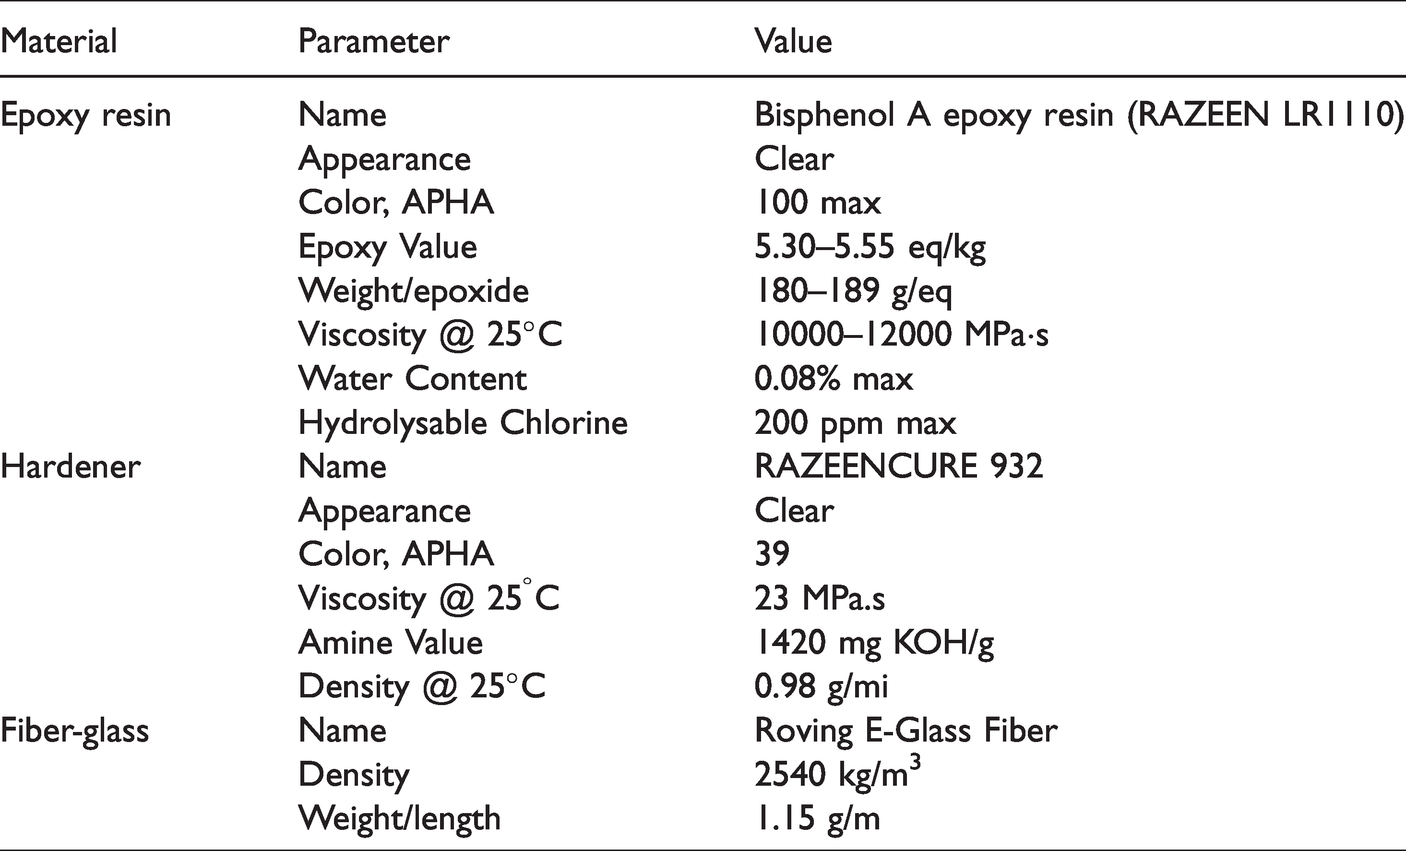
The unidirectional glass fiber reinforced epoxy (GFRE) composite with ten layers is used in the present experimental work. The constituent materials of the FGM are epoxy, a hardener, and glass fiber. The physical and mechanical properties of the used materials are listed in Tables 1 and 2 respectively. The hardener to epoxy-resin ratio is 215.6 g:1kg: (according to the manufacturer’s instructions). The manufacturing procedure for FGM specimens began with the preparation of a set of ten wooden looms, each with nailed spacing. The spacing of the nails, in each loom, is calculated according to the required value of Vf% of each lamina. After equipping the looms with the stretched fiberglass yarn, the manufacturing process of the layers was begun. The first loom of each specimen was placed on a glass base that had been covered with a thin sheet of butter paper (also known as parchment paper) in order to keep the lower surface of the specimens flat and smooth, and to prevent them from sticking to the glass base. Then hardened epoxy was poured, being careful to keep the distribution equal and uniform; a paint roller was used to complete the first layer. After the first layer was complete, the other nine looms, one by one, were placed above the finished layer(s) and epoxy was distributed, thus producing the remaining layers; see Figure 1(a). After constructing all ten layers, a glass covered with a sheet of butter paper was placed on the layers; a weight was then placed on the collection so as to provide uniform pressure. The newly formed FGMs were then left to cure for seven days, after which, the test specimens were cut in the same axial dimensions. The physical and mechanical properties of the used materials are listed in Tables 1 and 2 respectively.
Physical properties of the used materials.
Mechanical properties of E-glass fiber and epoxy resin.


Manufacturing and Vf arrangement for S1, S2 and S20 FGM groups.
The distributions of the fibers vary from one lamina to another; each lamina has a different fiber volume fraction, Vf, in order to obtain the graded composite material, as shown in Figure 1.Two groups of FGM specimens with different values of Vf for the ten layers are selected for the present work. In the case of first group of specimens, the fiber volume fractions of the ten layers are arranged as follows: 50, 50, 20, 20, 15, 15, 20, 20, 50, and 50%; their symbol is S1; see Figure 1(b). In the second one, the Vf of the ten layers is arranged in this way: 30, 30, 17.5, 17.5, 15, 15, 17.5, 17.5, 30, and 30%; and their symbol is S2, For this group, refer to Figure 1(c). For the sake of comparison, a conventional polymeric composite material with a constant distribution of fiber in the ten layers, where Vf = 20%, is manufactured to indicate the effect of FGM on the flexural strength; it is indicated by S20. Refer to Figure 1(d). The average Vf of S1 is 31% and the average Vf of the other two groups (S2 and S20) is ≈ 20%. These different Vf values are found experimentally using the ignition loss testing conducted according to ASTM D 3171-15 [25]. The structure and the fiber volume fraction arrangement of these three groups (S1, S2, and S20) are given in Figure 1(b) to (d).
Specimens geometry and experimental setup
Specimens were prepared for testing according to ASTM D7264M-15[25] (Standard Test Method for Flexural Properties of Polymer Matrix Composite Materials) with respect to each the dimension of each specimen. According to Clause 8.2 of the above mentioned standard, the specimens were fabricated with a span to thickness ratio of 20:1. The thickness of the manufactured specimens was 8 ± 0.5 mm while the span distance was 160 ± 1mm. The width of the specimens was fixed to 18 mm to allow for accurate comparisons between results; see Figure 2. According to section 11.4 of the standard [26], the crosshead speed is 1 mm/min (displacement control). Five specimens were tested for each test condition, and the average value was used for illustration the various relationships.

Experiment assembly for the 3PB test and specimen dimensions; all dimensions are given in mm. (a) Loading pin boundary condition and load direction. (b) Support elements boundary conditions. (c) Loaded specimen boundary conditions.
Finite element model
The finite element (FE) model is used in the present work to give more explanation about the experimental results. One of the main objectives of the present model is to simulate the experimental setup to allow further study of other specimen configurations; thus, the FGM composite specimen was constructed with ten layers using the same geometry. A three-dimensional FE modeling approach is used to simulate the failure of the ten layers E-glass and epoxy composite with varying Vf, when subjected to three points bending (3PB) loading. In the present simulation, the failure of the composite layers is based on Hashin damage criterion by using ABAQUS/Standard codes [27]. The failure of this type of material depends on the mechanical properties of each layer and the type of contact between them. The loading diagram and the standard support span-to-thickness ratio (20:1) are performed according to the Standard D2764M for flexural strength [26], Figure 2.
Mechanical properties of lamina
The mechanical properties of each unidirectional glass fiber reinforced (GFR) composite layer can be calculated analytically by using Equations (1) to (11), which are extracted from [28]. The differences of the mechanical properties between the layers mainly depend on each value of Vf. Table 3 shows the elastic constants of the unidirectional composites according to Vf. It is clear that these constants increased with increasing values of Vf, except (
The elastic constants of lamina with various Vf %.

Fiber direction is given as x direction, and the lamina plane is the X–Y plane.
Km and Kf are defined in equations (3) and (4) respectively as:


G23 is calculated with the solving of the equation (7) (A, B and C are Equations defined in ref. [25]).


The following equations, (12) to (15), based on references [29,30] are used to obtain the other mechanical properties of the GFR specimen that is used in Hashin’s damage model. Table 4 shows the materials’ strength data for Hashin’s damage model that is used in the present model. SL is set to 65 MPa for all the specimens, as the average value for all Vf ratios of unidirectional Fiber Reinforcement Plastic based on experiments [31]. Note that the transverse shear strength (ST) is half of the 


Strength data for Hashin’s damage model.

Hashin damage criterion
The initiation damage mechanisms considered in Hashin’s damage model are tension and compression failure of the fiber and matrix. Yu et al. [32] developed a three-dimensional finite element model using Hashin’s model to predict the failure of fiber composite laminates; they validated the numerical results using the corresponding experiments.
Equations (16) to (21) describe the general forms controlling these mechanisms.
Fiber damage mechanisms;

Matrix damage mechanisms;


The initial values of df, dm, and ds are set to zero (since the effective stresses are equal to the true stresses of the material) and are increased with the loading progress until they reach a value of one. Through the increase of the load, the effective strength of the elements is reduced according to equation (20). The elements that have a damage variable equal to one are excluded, as these elements do not endure this type of stress any longer. Throughout the present work, α is set to zero, because the contribution of the shear stress in the fiber initiation damage is neglected.
Contact surfaces and boundary conditions
In the present FE model as shown in Figure 3, the contact between the ten layers is taken to be tie contact (a perfect bond), but the contact between the specimen and other parts such as the loading pin and two supports is modeled using a master-slave algorithm (a type of surface-to-surface contact) in ABAQUS [27]. Furthermore, penalty friction formulation is used to simulate these contact properties. The coefficient of friction between the specimen and the other parts is assumed to be 0.2, as gathered from references [33,34]. The harder elements (the loading pin and the supporting elements) are denoted as the master surfaces, and the specimen contact surfaces are denoted as the slave surfaces.

The FE model. (a) Composite laminates mesh (ten layers each lamina of 0.8 mm thick). (b) Loading pin mesh (one part). (c) Roller supports mesh (two parts).
The specimen, composed of ten layers, is supported by two support elements as shown in Figure 3(b), wherein the support elements have zero degrees of freedom (DOF) preventing the specimen from moving in the Z-direction. The specimen is loaded using the loading pin at the mid-span of the specimen. Furthermore, the pin has one DOF in the Z-direction. The loading pin is loaded using the displacement control; the boundary condition for this loading pin is shown in Figure 3(a). The boundary conditions for the support elements and the loaded specimens are shown in Figure 3(b) and (c), respectively.
Fe meshing and mesh size sensitivity
In the present work, load pin and support elements are simulated by using 8-node C3D8R (linear brick elements), but the 8-node quadrilateral continuum shell (SC8R) is used to simulate composite layers. The elements’ nodes have degrees of freedom in the three directions of the Cartesian coordinate system (Ux, Uy, and Uz). The element C3D8R has only one integration point, while the SC8R elements have three integration points. The types of elements that were chosen to simulate the composite layers are compatible with Hashin’s damage model. The meshes of the different elements used through the FE model are shown in Figure 4.

The mesh of the different elements used in the FE model. a) Composite laminates mesh (ten layers each lamina of 0.8 mm thick); b) Loading pin mesh (one part); c) Roller supports mesh (two parts).
The effect of the size of the elements is tested to achieve the most suitable size to simulate the present experimental work. This is done with a specimen of ten layers with a fixed volume fraction (Vf) that equals 20%.Five values are selected for the element sizes of the composite layers: 2, 1.5, 1, 0.8 and 0.7 mm. Figure 5 shows the flexural strength against the deflection of the specimen of Vf 20% and the executed models with the size of the chosen element. The more suitable element size is 0.7 mm, because it gives the smallest error in ultimate flexural strength. The absolute errors in the ultimate flexural strength corresponding to elements size 0.7, 0.8, 1, and 1.5 mm are 0.8, −1.2, −3.6, −13.1, and −16.6%, respectively.

The elements’ size effect on the FE model’s results.
Results and discussions
Experimental results
Failure stages of FGM composite under flexural load
An example of the progressive failure of FGM beams, theS1 specimen, under 3PB loading, is described in the present section with the group of photographs presented in Figure 6. It is worth noting that most of the FGM specimens showed the same behavior. The failure of the FGM beam passes through various stages and is initiated from the bottom layer to the upper layer as discussed in the following paragraph.

Photographs showing the progressive failure of FGM S1 specimen under 3PB loading.
It is worth noting that the specimen has ten layers, and the bottom layer of the specimen experiences maximum tension; thus it was fractured under tension stress as shown in Figure 6(a). A complete fracture occurs in the fiber and matrix of the bottom layer. After that, the delamination occurs between the bottom layer and the others as shown in Figure 6(b). A sequence of delaminations follow, ranging from the bottom layer to the layers above; after that the shear failure is observed as shown in Figure 6(c). It is well known that the delamination decreased the integrity of the composite and subsequently decreased its stiffness. Furthermore, delamination and shear failures are considered brittle failure. This argument may explain why failure becomes rapid after this point. It can be seen from Figure 6(d) that the damage observed in the upper layer is due to a crushing load. Finally, the last failure occurs in the still intact layers as shown in Figure 6(e). The shape of the final failure of the present specimen is shown in Figure 6(f). The fractures in the matrix and fiber, as well as the delaminations between the layers are seen.
Flexural stress of FGM specimens
Figure 7 shows a comparison of 3PB results between three standard FGM specimens S1, S2, and S20. According to the previous results, the superiority of FGM over normally distributed bundles was clearly achieved. The results of the 3PB tests show that when the distribution of the bundles was done according to the FGM, i.e. small bilateral spaces on the surface and larger spaces in the core, the results of the flexural stress obviously improved.

Flexural stress vs. deflection of S1, S2 and S20 FGMs beams.
In the traditional 3PB test, specimen S1 shows an improvement of the flexural strength value by nearly 36%, as seen in Figure 7, while specimen S2 improved by only 2%. It is well known that the maximum value of bending stress occurs in the outer layers, and the fiber volume fraction at the outer layers of specimen S1 is much higher than S2 and S20. Otherwise, the average of Vf% for S1 and S2 are about 31% and 21% respectively. From Figure 8, it can be concluded that the Vf% of the outer layers and the average volume fraction of the specimens are major factors in improving their flexural strength. More analysis is needed to clarify these observations. The present results are in agreement with the results obtained by Selmy et al. [24] for flexural fatigue.

Flexural stress vs. deflection of FGMs beams with average Vf = 30%.
Numerical results
Modeling verification
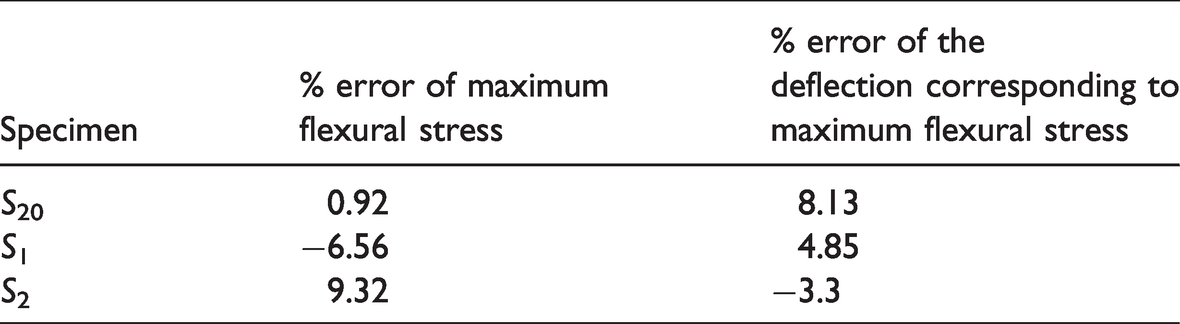
The present simulation intends to obtain the ultimate flexural strength and its corresponding deflection for a FGM. First, to ensure that the present FE model represents the current test well, its results must be verified by comparing them with the experimental results. Figure 7 shows the verification of the FE present model. Table 5 shows the relative error for each specimen, i.e. the error% of maximum flexural stress and the error % of deflection at maximum flexural stress. The table shows that the errors of the three specimens (S1, S2, and S20) in both of the predicted values are less than 10%.
The error % for the specimen used in the verification of the present FE model.
Prediction of the flexural stress of FGM beams
The verification of the used FE model proves that the model simulates the present 3PB test for the required FGM well. Accordingly, different specimens are treated with this model to study the advantages of the FGM over the conventional composite material. To investigate the effects of the fiber volume fraction of outer layers and the average volume fraction of all layers, five extra specimens, labeled S3, S4, S5, S6, and S7 are used; these have a constant average Vf = 30% with varying in Vf of the layers as seen in Table 6.
The Vf values of the layers for the different specimens, with average Vf = 30%.

To make the comparison between the conventional composite configuration and the FGM, a specimen (S3) of Vf 30% is used as conventional unidirectional composite material. Table 6 shows Vf distribution for different FGM layers that obtained an average Vf of 30%.
Figure 8 shows the flexural stress of the loaded specimens, versus its corresponding deflections. The figure shows that the flexural strength of the FGM specimen increases with the increase of the Vf of its outer layers, despite the average Vf % of all specimens being the same, S3 through S7. When the Vf of the outer two layers reached 50% (S4 and S5), the strength is increased by about 6% more than the maximum strength of the conventional specimen, S3. Meanwhile, this ratio decreased to 2.5% when the Vf of these layers was 40%, as in specimen S7. Specimen S6 has about 3% advantage stress while the second layer has a Vf ratio of 40% instead of 50%. The maximum deflection of the specimen is decreased in the opposite manner. S4 and S5 have smaller deflections than S7, and those of S7 are less than S3 (the conventional specimen).
The maximum flexural stress value is located at specimensS4 and S5after which it gradually decreases at S6, as shown in Figure 8(b). After that, the decrease continues at S7 and reaches the lowest value at S3. The distribution of the inner layers has a marginal effect on both the strength and the deflection.
To ensure the advantage of FGM over the conventional specimen, two conventional specimens with average fiber volume fraction (Vf) of 50% and 40%, S8 and S9, respectively, are simulated. All ten layers of S8 and S9 have Vf = 50% and 40%, respectively. It is worth noting that for both FGM specimens of average Vf = 30%, the Vf of the last two outer layers is 40% and 50% for S7 and S4, respectively. Figure 9 shows the comparison between the FGM specimens S4 and S7 with the conventional specimens of S3 (Vf = 30%), S8 (Vf = 50%), and S9 (Vf = 40%). The objectives of this comparison are to clarify the effect of Vf of inner layers of shallow beams, i.e. (S4 vs. S8) and (S7 vs. S9), and to clarify the superiority of FGM beams over the conventional beams of the same Vf, (i.e. S4 vs. S3) and S7 vs. S3.The figure shows that the flexural strength of shallow beams is directly proportional to the average Vf. Furthermore, the maximum flexural stress of the S3 specimen is less than that of specimens S8 and S9 by about 22% and 14.7%, respectively. On the other hand, the maximum flexural stress of the FGM specimen S4 is less than that of specimens S8 and S9 by about 17.2% and 10%, respectively. This means that the FGM specimens with the above-mentioned configuration improve the flexural stress of the specimen that has the same average Vf.

Flexural stress vs. deflection of FGMs beams with average Vf = 30% and conventional composite beams with different Vf % (30, 40 and 50%).
The values of relative flexural stress to weight ratio for the above beams S3, S4, S7, S8, and S9 are shown in Figure 10. By comparing the conventional composite beams S3, S8, and S9, it is clear that increasing the Vf % ratio increases the efficiency of Vf % (compare S3 with S8) up to a certain value (40%). After that, there is only a marginal effect of increasing Vf% ratio on the efficiency of Vf % (compare S8 with S9). On the other hand, the flexural stress to weight ratio for both S8 with S4, and S9 with S7, has nearly identical values, meaning that the recent FGM specimens can save weight with the same dimensions, and achieve the same flexural stress to weight ratio.

Flexural stress/weight ratio of FGMs beams with average Vf = 30% and conventional composite beams of the same and higher Vf% (30, 40, and 50%).
Figure 11 shows the transverse stress (s1-1 along the span of the beam) distributions in the outer and inner layers of the FGM beam (S4), compared with conventional composite beam (S3) having the same Vf% (Vf%=30%). As is already known, both compressive and tensile stresses and strains decreased from the outer layers toward the middle of the beam depth, i.e. toward the neutral axis. At the same applied deflection/strain, s1-1 in the outer layers of the FGM beam is higher than those in conventional composite beam. This is because the Vf % of the outer layers of the FGM beam (Vf %=50%) is higher than that of a conventional composite beam (Vf%=30%). On the other hand, Vf % of the inner layers of FGM beam’s third layer (Vf%=17.5%) is less than that of a conventional composite beam (Vf%=30%). Therefore, s1-1 in the inner layers of the FGM beam is less than those in a conventional composite beam for the same applied deflection and strain. These observations are vividly clear in Figure 11(c).

Stress distributions in the outer and inner layers of FGM beam (S4) compared with a conventional composite beam (S3).
Conclusion
From the experimental and numerical results, it can be concluded that Vf% of the outer layers plays a crucial role in improving the flexural behavior of the FGM beams. For Vf% = 30%, the FGM shallow beams with Vf of the outer two layers equal to 50% (S4 and S5), the strength is increased by about 6% more than that of the conventional beam with the same average Vf%, S3. Furthermore, the flexural behavior of FGM beams is affected by their gradient pattern. For the same Vf%, FGM beams showed a superior flexural behavior over conventional composite beams. The failure of the FGM composite beam under the 3PB passes through various stages, moving from the tensioned layers, where the failure starts, to the upper layers. The delamination failure between the layers has a major effect on the rapidness of the final failure of the composite specimen. A crushing failure occurs in the upper layer due to compression bending stress.
The present functionally graded laminated polymer matrix composites are considered alternative reinforced panels mimicking the behavior of sandwich structures. Further research will be conducted to confirm whether such FGM panels can compete with the standard “glass skin/PVC foam core” sandwiches, widely used in the transport industry. More importantly, the FGM panels (usually employed as inserts), should thanks to their near-continuous mechanical properties across the thickness, strongly reduce stress concentrations induced by the interlaminar stresses; these stresses are the main culprits of crack onset in the vicinity of junctions. It would be very interesting to compare, in future research, the pull-out strength of inserts embedded in standard sandwich structures and FGM panels.
Footnotes
Acknowledgements
The authors gratefully acknowledge the Amiantit Group and Jubail Chemical Industrial Company, KSA, for providing the raw materials used in this research.
Declaration of conflicting interests
The author(s) declared no potential conflicts of interest with respect to the research, authorship, and/or publication of this article.
Funding
The author(s) received no financial support for the research, authorship, and/or publication of this article.