
Abstract
Simulation experiments and in-vivo experiments were widely employed for investigating sock-skin frictional characteristics. The simulation experiments usually was a type of sliding experiment which described the relative slip between fabric and artificial skin. The in-vivo approaches typically involved subjects adopting a variety of postures and friction between their clothing and the skin was estimated. However, simulation and in-vivo experiments were reported only separately. The connection between the two types of experiments was scarcely reported. To reveal the connection, we synchronously carried out two interrelated experiments, a natural walking experiment and sliding experiment, using the same sock fabric. In the natural walking experiment, the subject wearing socks walked on the force platform. Then the soles of these socks were cut out and were used in the soles-artificial skin sliding experiment. The coefficients of friction in the two types of experiments reflected some correlative frictional characteristics. We found the effect of the walking speed or sliding speed on the friction coefficient was not significant. While, water content increased the friction coefficient in the two experiment. Additionally, the friction in the coronal direction was smaller than that in the sagittal direction during walking. Through our efforts, we hope to bridge the simulation and in-vivo experiments and elucidate the frictional characteristics between the sock and insole.
Introduction
The fabric–skin friction in humidity/moisture conditions under the cloth is a decisive physical factor in the development of decubitus, blister, corns, calluses, and talon noir [1–5]. To elucidate the mechanism of textile friction, the frictional characteristics of fabrics have been extensively investigated. These properties have even been related to the fabric structure. The yarn type, weave pattern, warp/weft orientation, and finishing treatments influence the fabric friction characteristics, according to the studies by Thomdike [6], Wilson [7], Zurek [8], and Hosseini [9] carried out several decades ago. In contrast to wool, acrylic fabric exhibited relatively strong friction under the same conditions [10]. The floating length of knitted fabric reduced the coefficient of friction (COF) [6]. To provide deeper insights into the fabric structures and their frictional properties, Jeddi [11–13] introduced the fabric structural asperity index (FSAI). They obtained the FSAIs of fabric structures and explained the relations between the friction and structure of woven and knitted fabrics. In addition to the fabric structure, experimental conditions, including the test velocity [14,15], surrounding conditions [16], pressure [17], and fabric moisture [18], body regions [24], and deformation of both the skin and the fabric [25], strongly affect the test results [18-23].
Despite the various studies on friction characteristics, the fabric friction characteristics were not applied to study the skin–fabric friction. Thus, a simulation experiment based on artificial skin–fabric friction on a large scale was carried out. Ramkumar [26-27] reported a type of polymeric finger used as a skin equivalent in a KES surface and friction tester (KES-FB4). Artificial finger friction experiments were also carried out by Tomlinson [28] and Camillieri [29]. Two additional instruments, textile friction analyzer [30-32] and LPMT tribometer [33–36], have been frequently used in the skin–fabric friction studies. The tensile strength tester was also refitted (e.g., INSTRON tester [37] and MTS tensile testing machine [38] for studies on fabric friction. The principle of these instruments is based on the sliding type of friction between artificial skin and fabric.
To realistically study the contact and friction, some studies performed in-vivo assessments of the human skin frictions against fabrics. In 1986, Gwosdow [16] placed a fabric across the forearm and measured the friction using a forcemeter. Similar studies were carried out by Cottenden [39] and Jayawardana [40]. Additionally, comparison studies between in-vivo and simulation experiments have been carried out. In 2010, Baussan [35] adhered a soft sensor to the pelma to evaluate the friction during walking. The sock friction on the LPMT tribometer was used to verify the in-vivo experiment. However, they did not explain the acquisition of friction signals by utilizing the pressure sensors. To verify the finger friction, Gauvin [38] also designed two instruments to perform in-vivo and simulation experiments.
These experiments well describe the skin–fabric frictional characteristics. However, the relation between simulation and in-vivo experiments has been rarely reported. In this study, the feet were wrapped by socks in walking. The previous experiments did not describe the friction between the fabric-wrapped skin and other subjects, such as the friction between the sock-wrapped foot and insole. To address the above two problems, we carried out a walking experiment on a three-dimensional (3 D) force platform and a novel sliding friction experiment. This study reveals the friction mechanism of the fabric-wrapped skin and friction rule in daily walking.
Experiment and methods
Fabric structure measurement
Four types of short socks (two pairs of each type, showed in Figure 1) with different textile structures and materials were purchased from the same supplier (Kairui Sport Ltd., China). All socks were fully relaxed and placed under standard atmospheric conditions for 24 h to reach equilibrium prior to the measurements. We then cut a 1.5 × 1.5 cm2 sole from each sock and measured its structural parameters, including the course density (CD), wale density (WD), and thickness. The sole thickness was measured using a thickness gauge (YG14N, Hongda Co. Ltd., China), according to the International Organization for Standardization (ISO) 5084. The CD and WD were measured by picking glass (Y115B, Qile Co. Ltd., China) according to the American Society for Testing and Materials (ASTM) D8007-15. Each measurement was performed four times. The average results are listed in Table 1.
Sole structures of the socks.

Controlling sample water content
To mimic the real sweating environment, we prepared samples with different water contents. Before the walking and sliding experiments, each type of sock and sole were placed in an oven (Y802, Changzhou Zhongxian Instrument Co. Ltd., China), set at 105 ± 3 °C. After every 10 min, the samples were taken out of the oven and weighed on an electrical balance (ME-T, Mettler-Toledo, LLC, USA) until their weights were constant. The final mass was regarded as the dry mass of the sample. We then immersed the samples in water and dried them by following the above steps to obtain the required water content ((wet mass - dry mass)/wet mass × 100%). The required water content was 2,04,060 or 80%. Finally, the samples with the required water contents were immediately used in the walking and sliding experiments.
Walking experiment
We recruited three female college students (50 ± 2 kg, 160 ± 2 cm, same foot size) to participate in our experiments. The volunteers did not have any history of injuries of the nerves, muscles, and bones on the lower limbs and were instructed not to apply any chemical/cosmetic substances on the lower limbs one day before testing to retain the natural skin conditions. Additionally, the volunteers should be familiar with controlling their walking speeds.
Once the water content in the socks had the required value, the socks were immediately worn on the volunteer’s feet. The volunteer walked on the force platform (NDI True Impulse, Northern Digital Inc., Canada) at different speeds (0.5, 1, 1.5 m/s). The walking process is shown in Figure 2. The computer exported the force data in the XYZ directions and foot displacement data during each walking, where Z is the vertical direction, X is the sagittal direction, and Y is the coronal direction. After each walking measurement, the socks should be immersed in water and dried again by following the steps in Section ‘Controlling sample water content’ to guarantee the water content of the socks. To ensure the accuracy of the results, the walking was repeated four times.
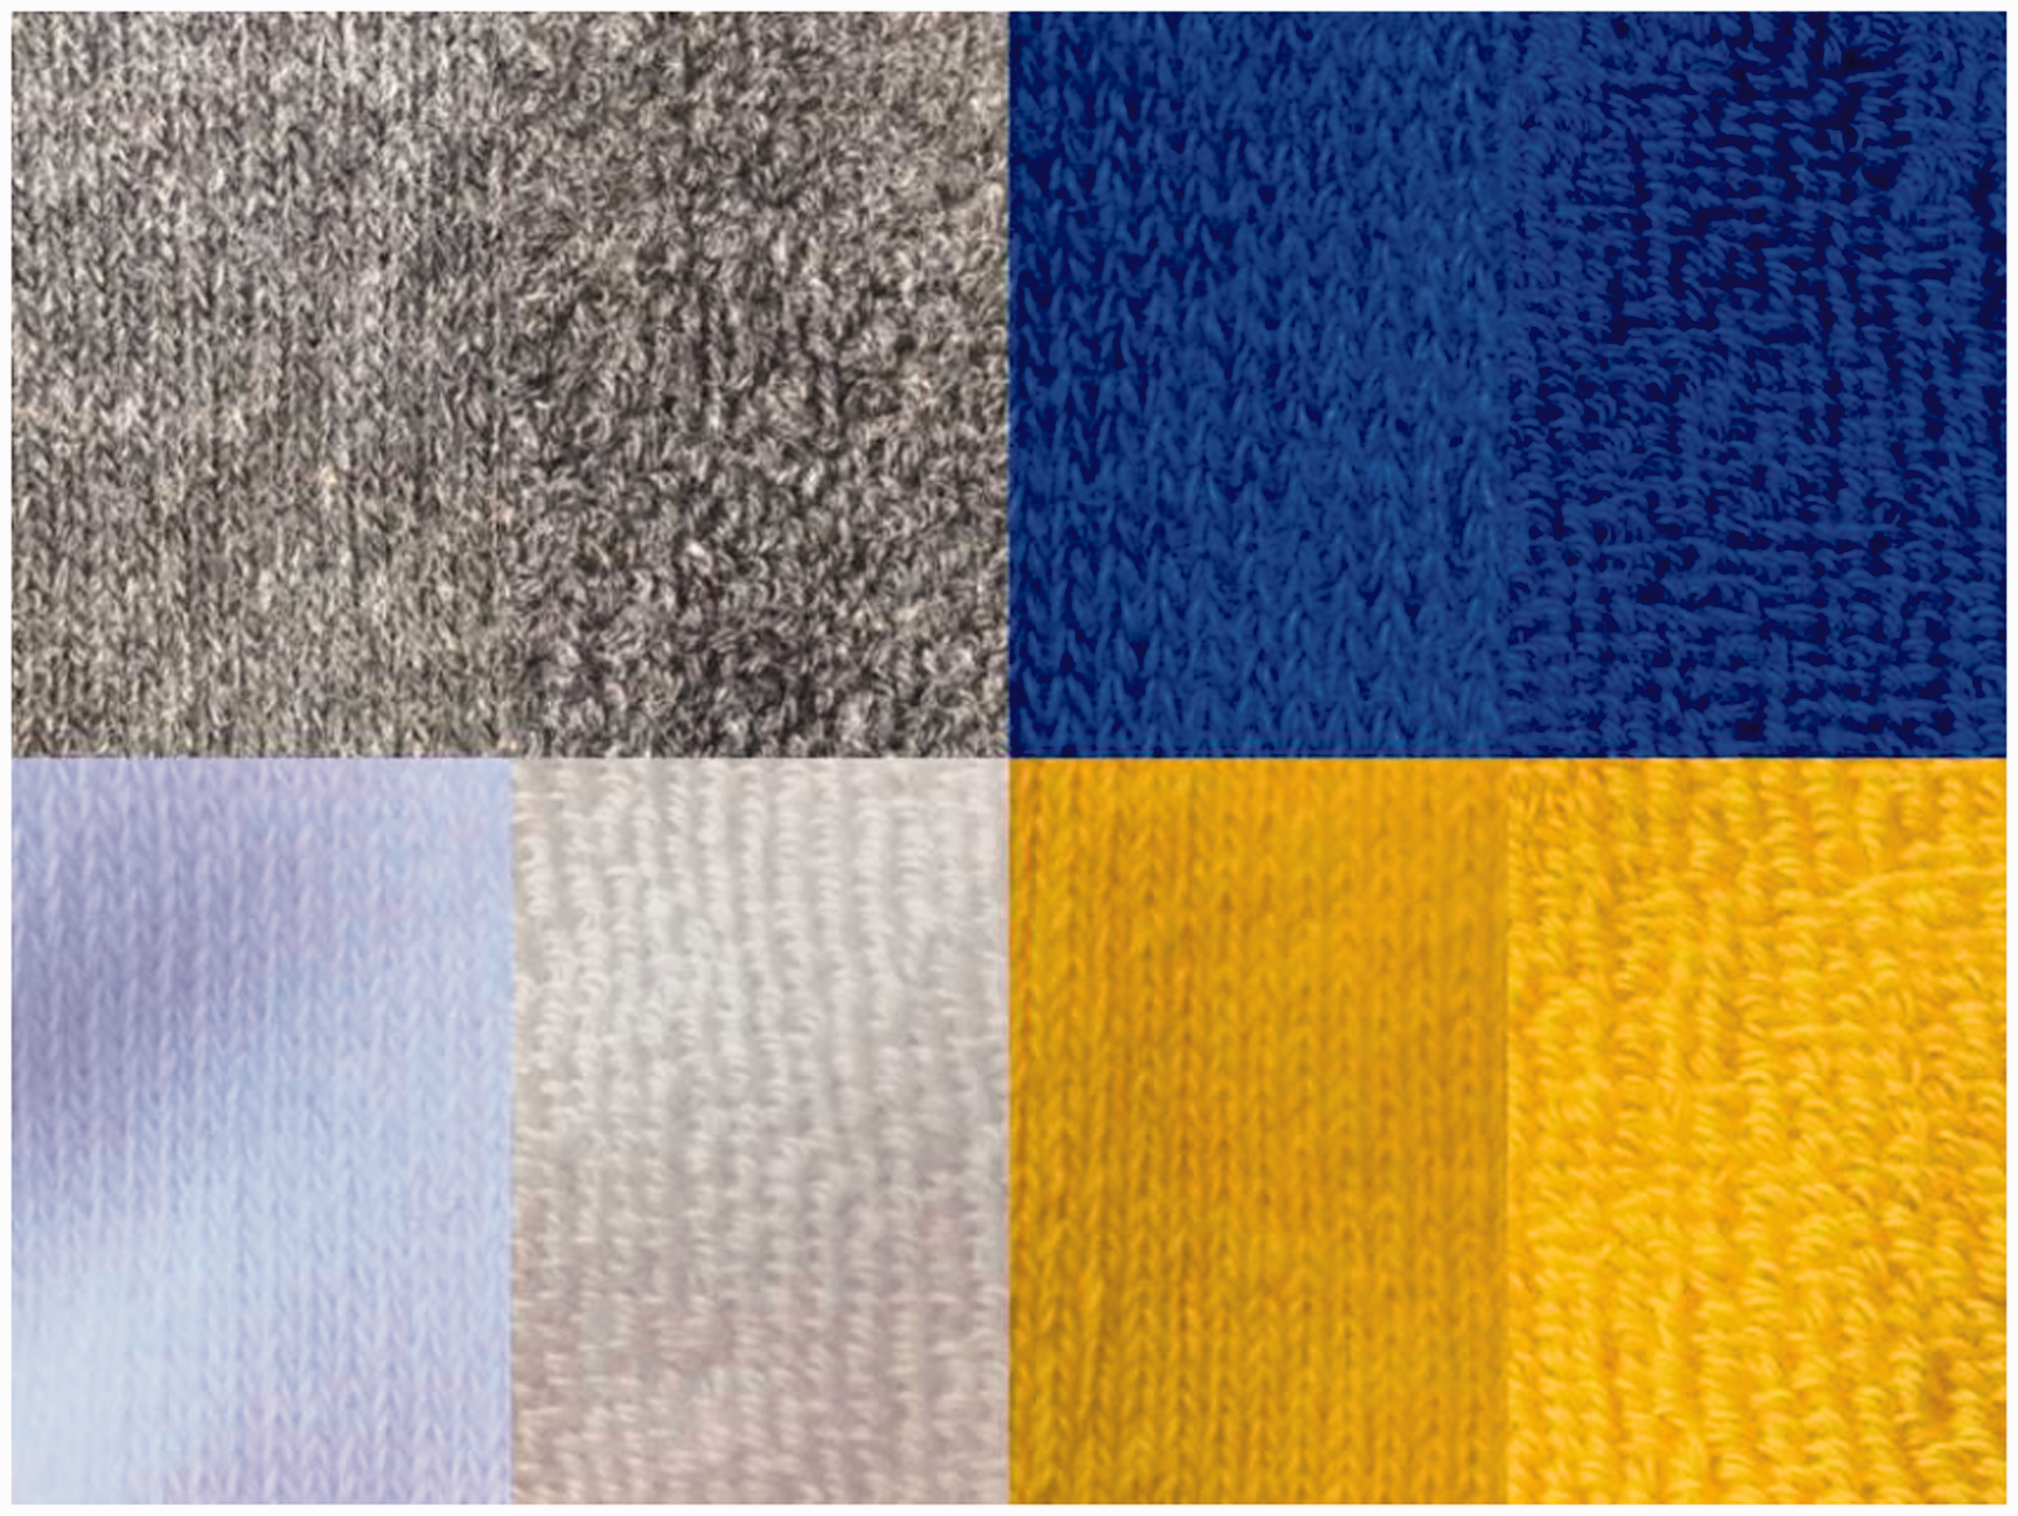
Interior and exterior structures of each sole.

Walking experiment: (a) first, (b) second, and (c) third steps.
The force platform used in the experiment is installed in a 3 D force transducer at the bottom. It is a common instrument to measure the plantar force in three directions during human movement. The force platform is widely employed in sports and rehabilitation sciences to evaluate the lower limb strengths and gait health of athletes and patients [41–43].
Sliding experiment
To mimic daily walking, we designed a sliding experiment, as shown in Figure 3. The artificial skin (C5-1, Sunshine 3DM Co. Ltd., China) was cut in the same dimensions as those of the sock sole. Once the sock sole had the required water content (Section ‘Controlling sample water content’), it was immediately glued onto the slider bottom with the artificial skin to generate a sandwich. The platform moved at different speeds (50, 100, and 150 mm/min) during the test. High speed may cause violent data deviation and uncontrollable results, thus the employed slider speed was slow relative to the walking speed. The tension sensor provided a real-time output of the measured friction. We then removed the sole fabric and changed its direction to measure the friction along another orthometric direction. After the measurement, the sole was slightly torn off, immersed in water, and dried again to guarantee the required water content. The sliding experiment was also performed four times for averaging purposes.

Schematic of the sliding experiment.
The sock-wrapped foot touches the ground during daily walking. The skin, fabric, and ground form a sandwich-like structure. Thus, in the sliding experiment, we glued the artificial skin and sole fabric onto the bottom of the slider to create an emulation sandwich. Additionally, during the test, the glued sole should be moved to measure the friction in two directions (wale X and cross Y directions) because the force platform could simultaneously export
Determination of experimental pressure
In the sliding experiment, the experimental pressure Ps can be determined by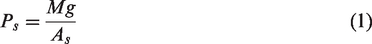
Where, M is the slider mass, g is the gravitational acceleration, As is the sample area. The pressure in the sliding experiment was constant, while in the walking experiment was unstable. To scrupulously investigate the relevance between the two experiments, we employ the following expression to calculate the time-average pressure Pw in the walking experiment.
Herein,
Calculation of COF
The COF was employed to evaluate the frictional characteristics. We used Coulomb’s law of friction to calculate the COF. In the walking experiment, COF could be described by


Herein, x and y respectively represent course and wales direction of fabric. The friction between the foot and ground is static friction because of the absence of relative slip during walking. Therefore, in the sliding experiment, we focused on the static friction measurement. Figure 8 shows the friction force curve obtained by the sliding experiment. The force sharply increased, reached the peak, and then gradually decreased. The slider remained stationary before the friction reached its peak. Thus, the peak was the maximum static friction. To calculate the COF, we extracted the friction force in the range of the origin to the dotted lines and calculated the time-average
Results and discussion
Plantar press analysis
The exported force curves in a single gait cycle are presented in Figure 4. The force curves of the right and left foot are almost symmetrical for a healthy person. Six peak points are shown in Figure 4(a) (indicated by red arrows). At the beginning of the walking,

Force curves in the XYZ directions during walking: (a) Fz, (b) Fy, (c) Fx.
Experimental pressure results
In equation (2),
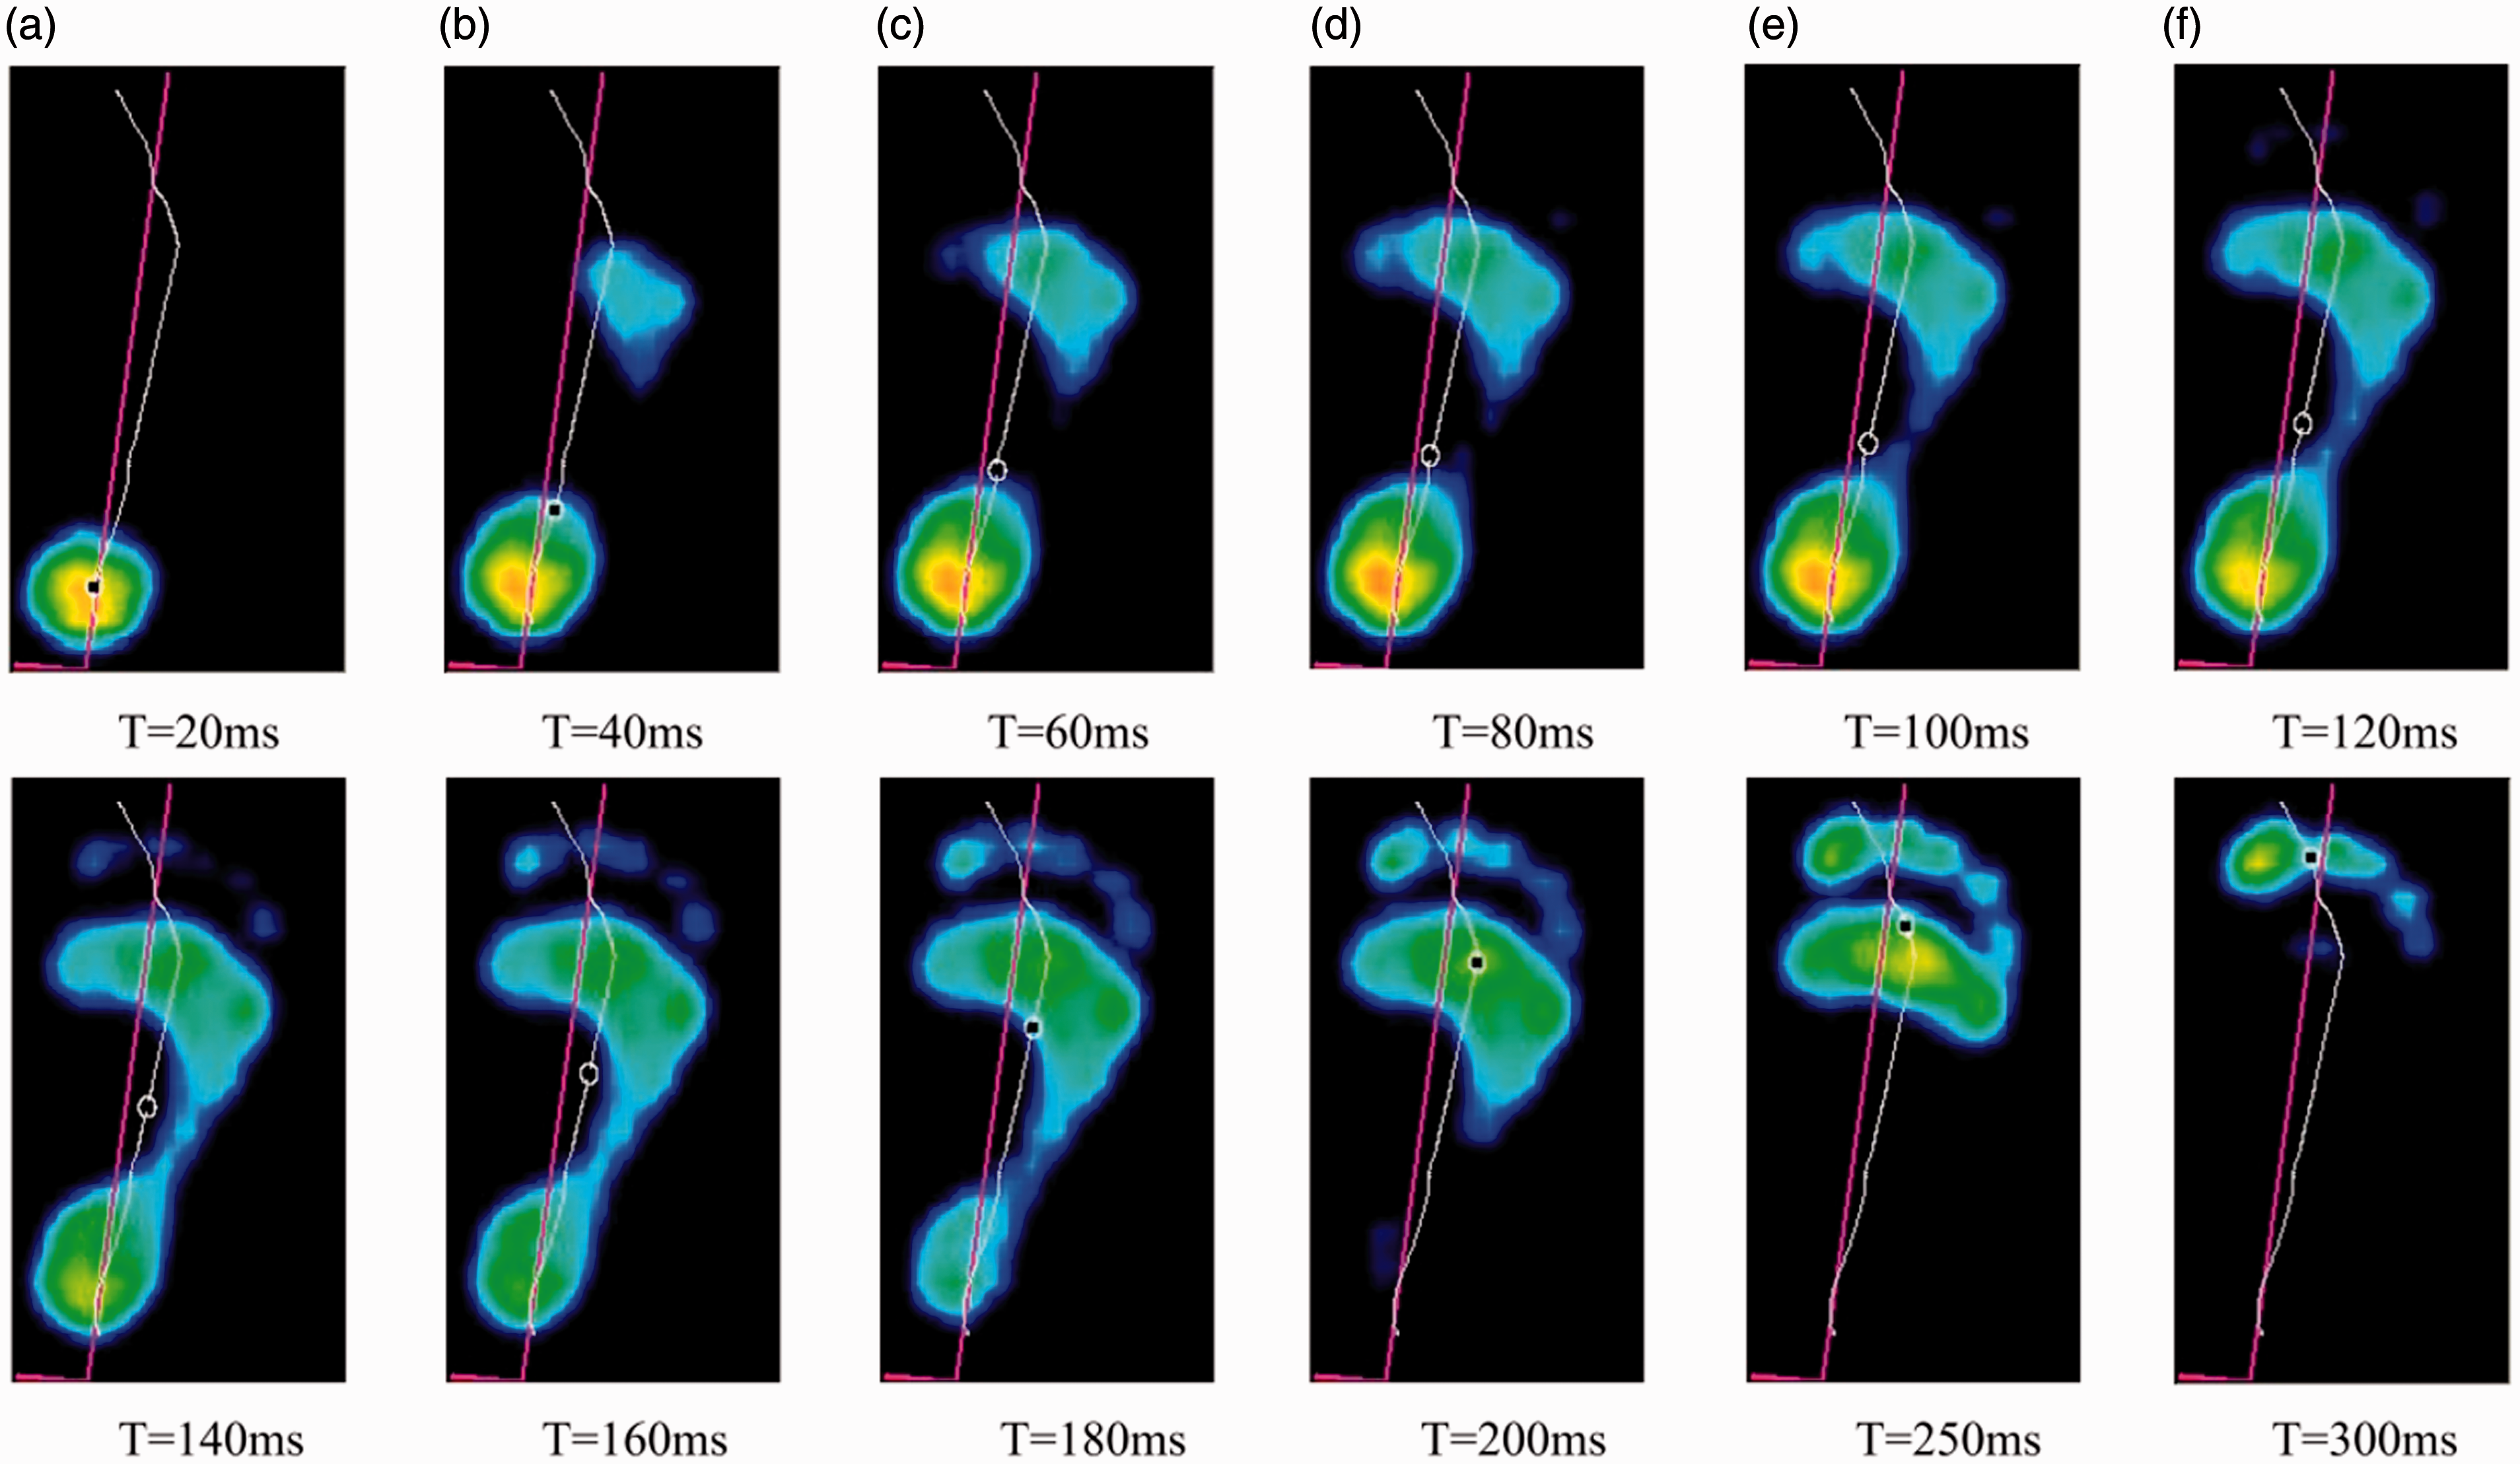
Plantar pressure patterns during walking (walking speed = 1.5 m/s).
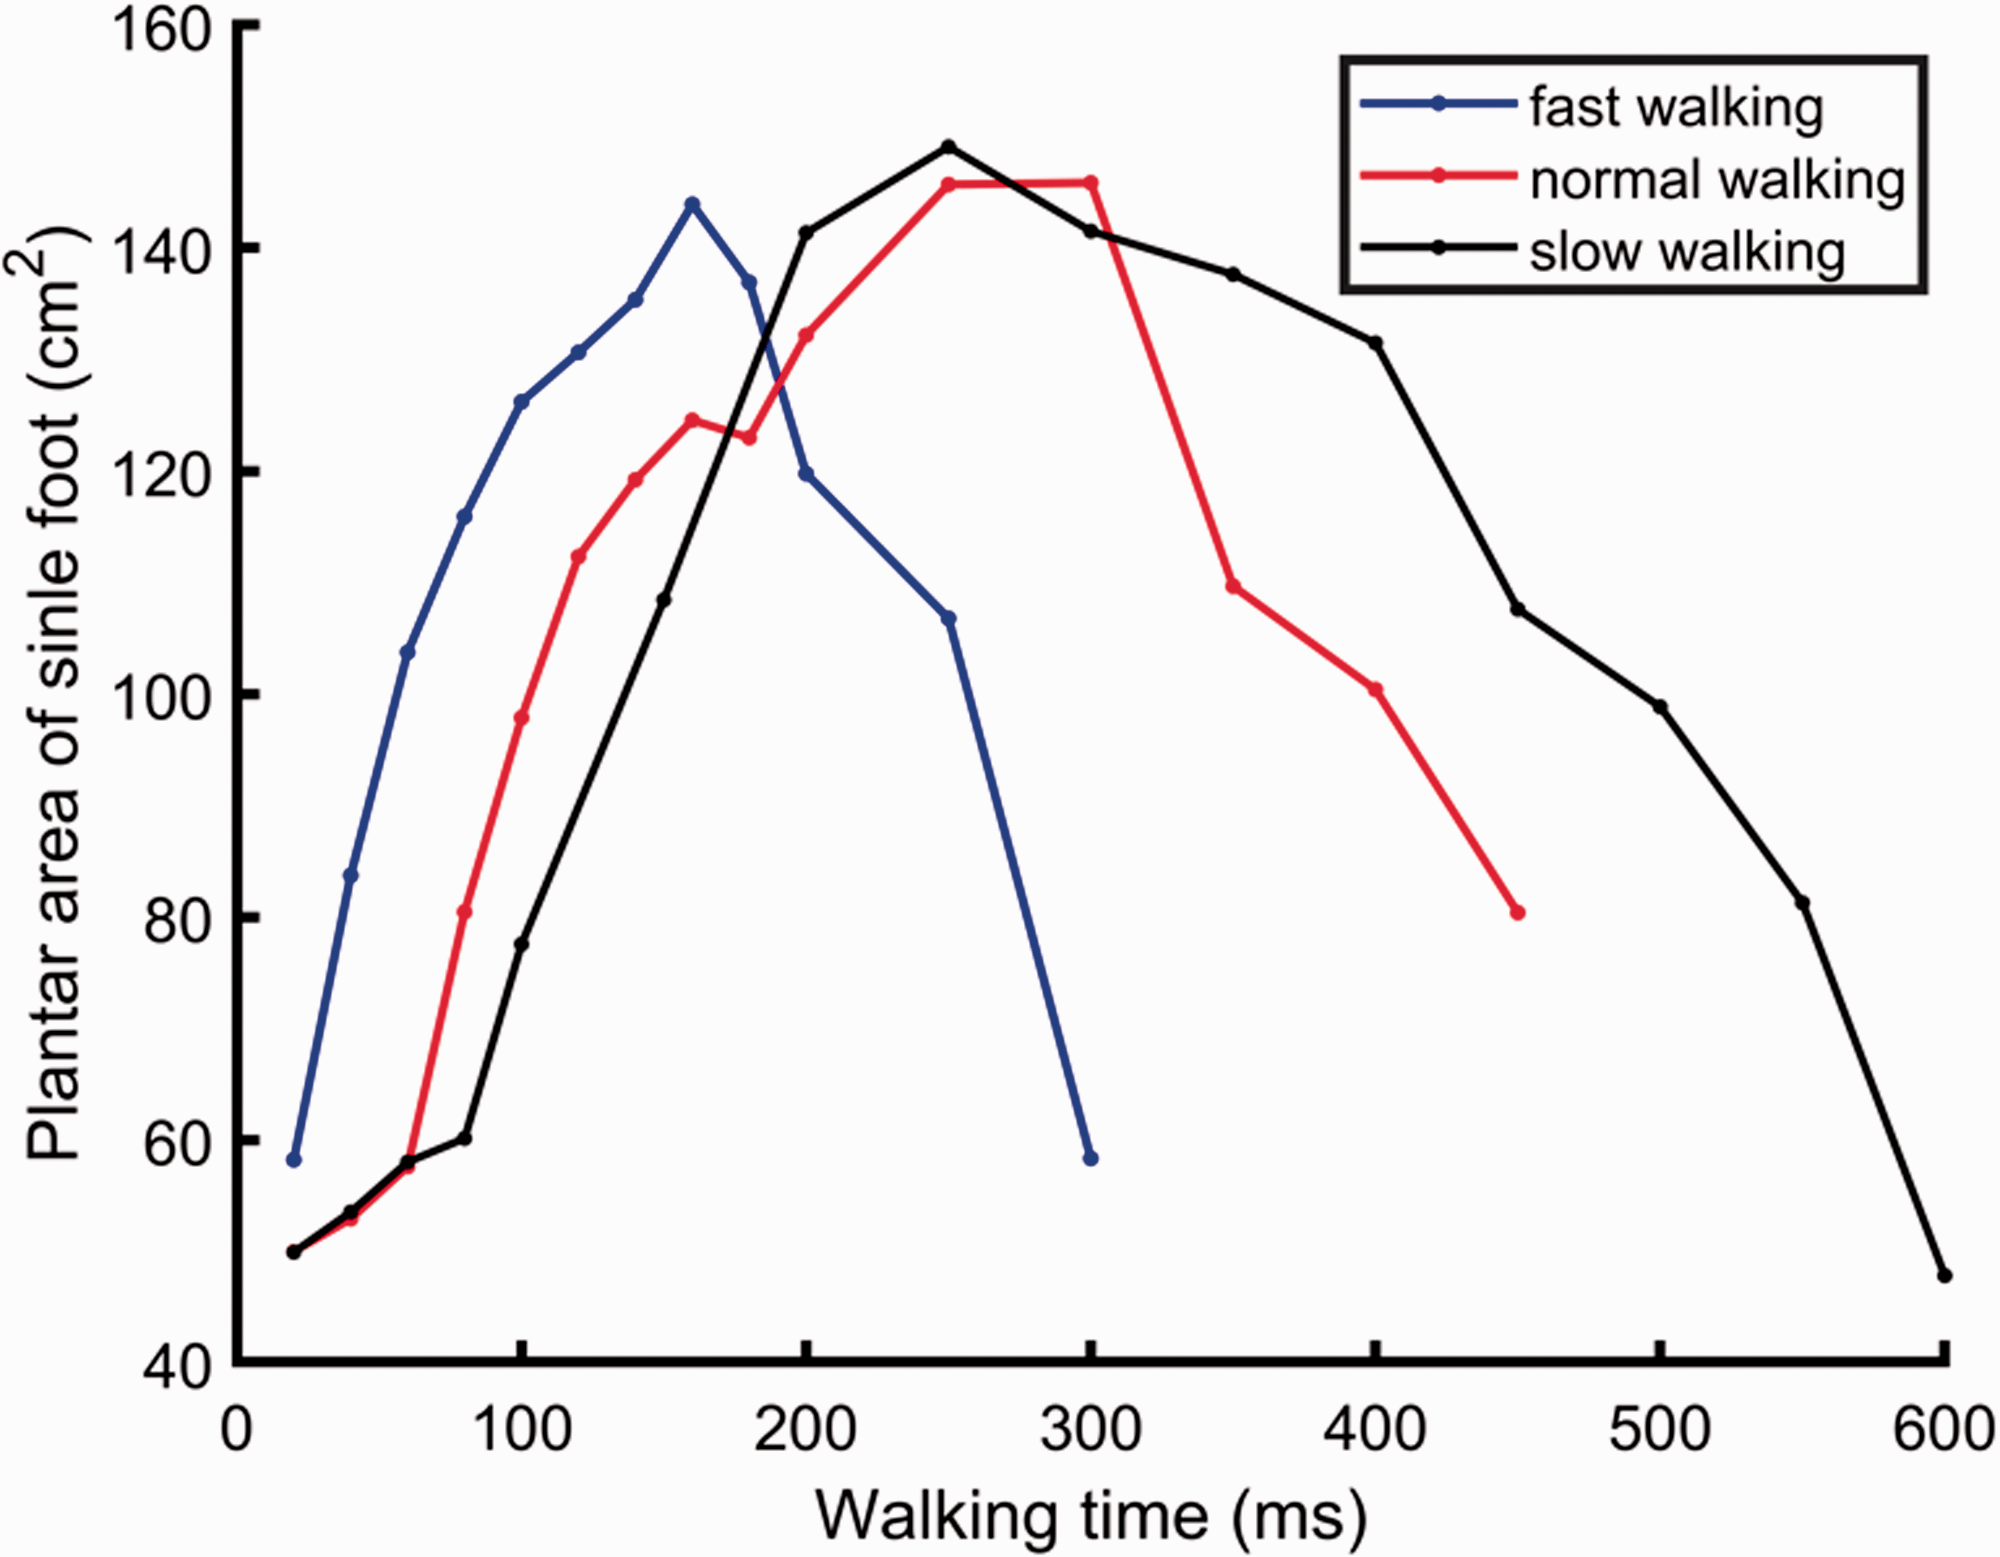
Plantar area variation (walking speed = 1.5 m/s).
COF results in walking experiment
The calculated COF depending on the water content is presented in Figure 7. The original data are presented in Tables S1 to S4 in Supporting Information. The subscripts s, n, and f represent slow walking (0.5 m/s), normal walking (1 m/s), and fast walking (1.5 m/s), respectively. A common regularity in all subfigures in Figure 7 is observed; the COFs increase and then decrease with the increase in the swelling water content because the pores in the fabric contain liquid, which leads to fiber inflation. The fiber size enlargement generates a larger contact area on the platform. Wilhelm [44] reported that friction was produced by intermolecular attraction from the contacted material in the contact area. A larger contact area usually contains more molecules, which leads to higher friction and larger COF. If the water content is further increased (>20%), the liquid is easily squeezed out of the sock during walking. The squeezed liquid forms an interfacial film, which lubricates the interface between the fabric and sole, thus reducing the COF. In summary, the friction mechanism of the hydrous fabric changes from adhesion friction to lubrication with the increase in the water content.
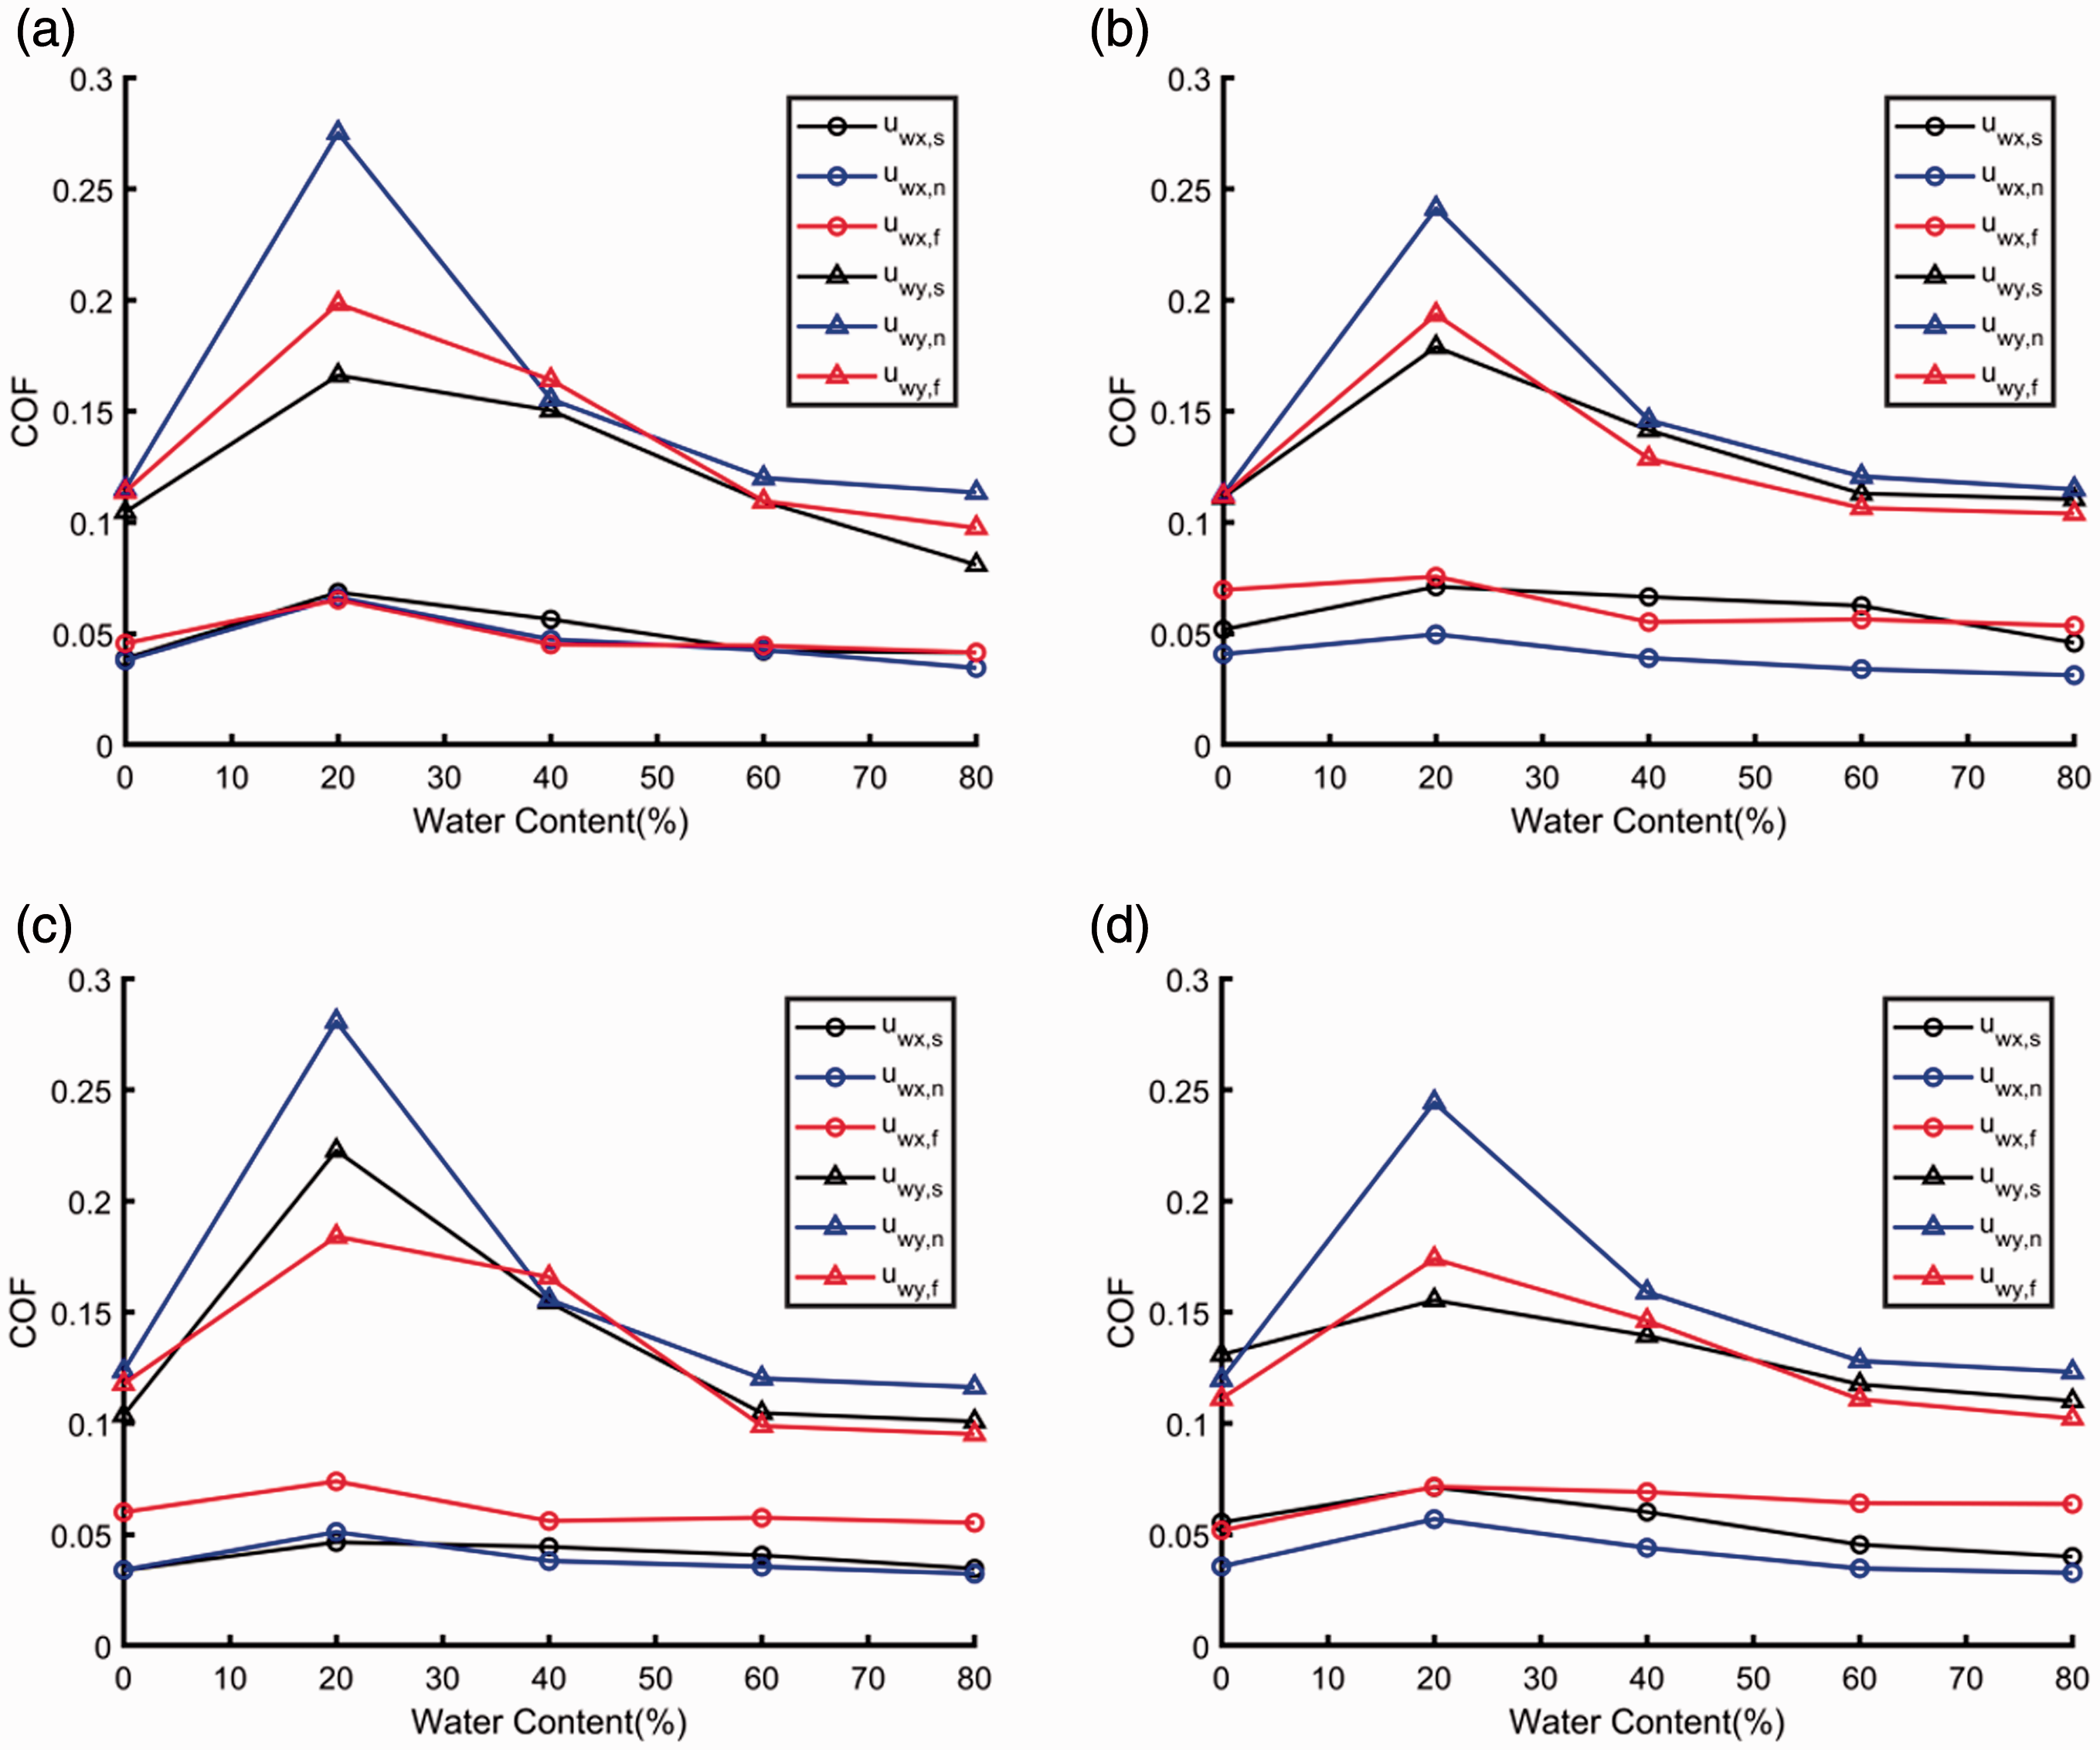
Influence of the water content on the sole friction during walking: (a) gray, (b) blue, (c) white, and (d) yellow samples.
In Figure 7, μwy is larger than μwx, according to the human walking characteristics. The force exerted on the ground is identical to the friction exerted on the foot. However, the force directions are inverse. Thus, in this experiment, the friction in the Y direction is larger than that in the X direction because the volunteer walks along the Y direction. In the opposite case, the human would walk like a crab. This is also verified by Figure 7(b) and (c), which demonstrate a larger Fy and smaller Fx. According to equations (1) and (2), larger friction generates a larger COF.
It is challenging to obtain an obvious rule regarding the influence of walking speed. In all subfigures of Figure 7, μwy,n is usually the largest in all of the μwy. By contrast, μwx,n of normal walking is usually very smallest in all of the μwx. The influences of the other two walking speeds on the COF are irregular. Some studies demonstrated the influence of the speed on the COF of fabric [14,15]. However, this influence does not seem to appear in real walking.
COF results in sliding experiment
Figure 8 shows a typical friction curve in a sliding experiment. The friction initially increased. When it reached its peak, the slider started to move. The friction then decreased. The static COF was calculated using equations (1) and (2). The results are presented in Figure 9. The original data are presented in Tables S5 to S8 in Supporting Information. Water also increases the COF in the sliding friction experiment. A similar conclusion has been multiply published [21-23,45] several decades ago. However, compared to the walking experiment, the COF in Figure 9 continuously increases rather than the initial increase, followed by the decrease in Figure 7. The difference between the walking and sliding experiments is attributed to the extruded water. According to our observations, water was more easily extruded in the walking experiment than in the sliding experiment. This implies that the water is easily extruded by varied press rather than constant press, even though the time-average pressures are similar in the experiments. Extra water on the platform effectively reduced the COF.

Typical curve of sliding friction.
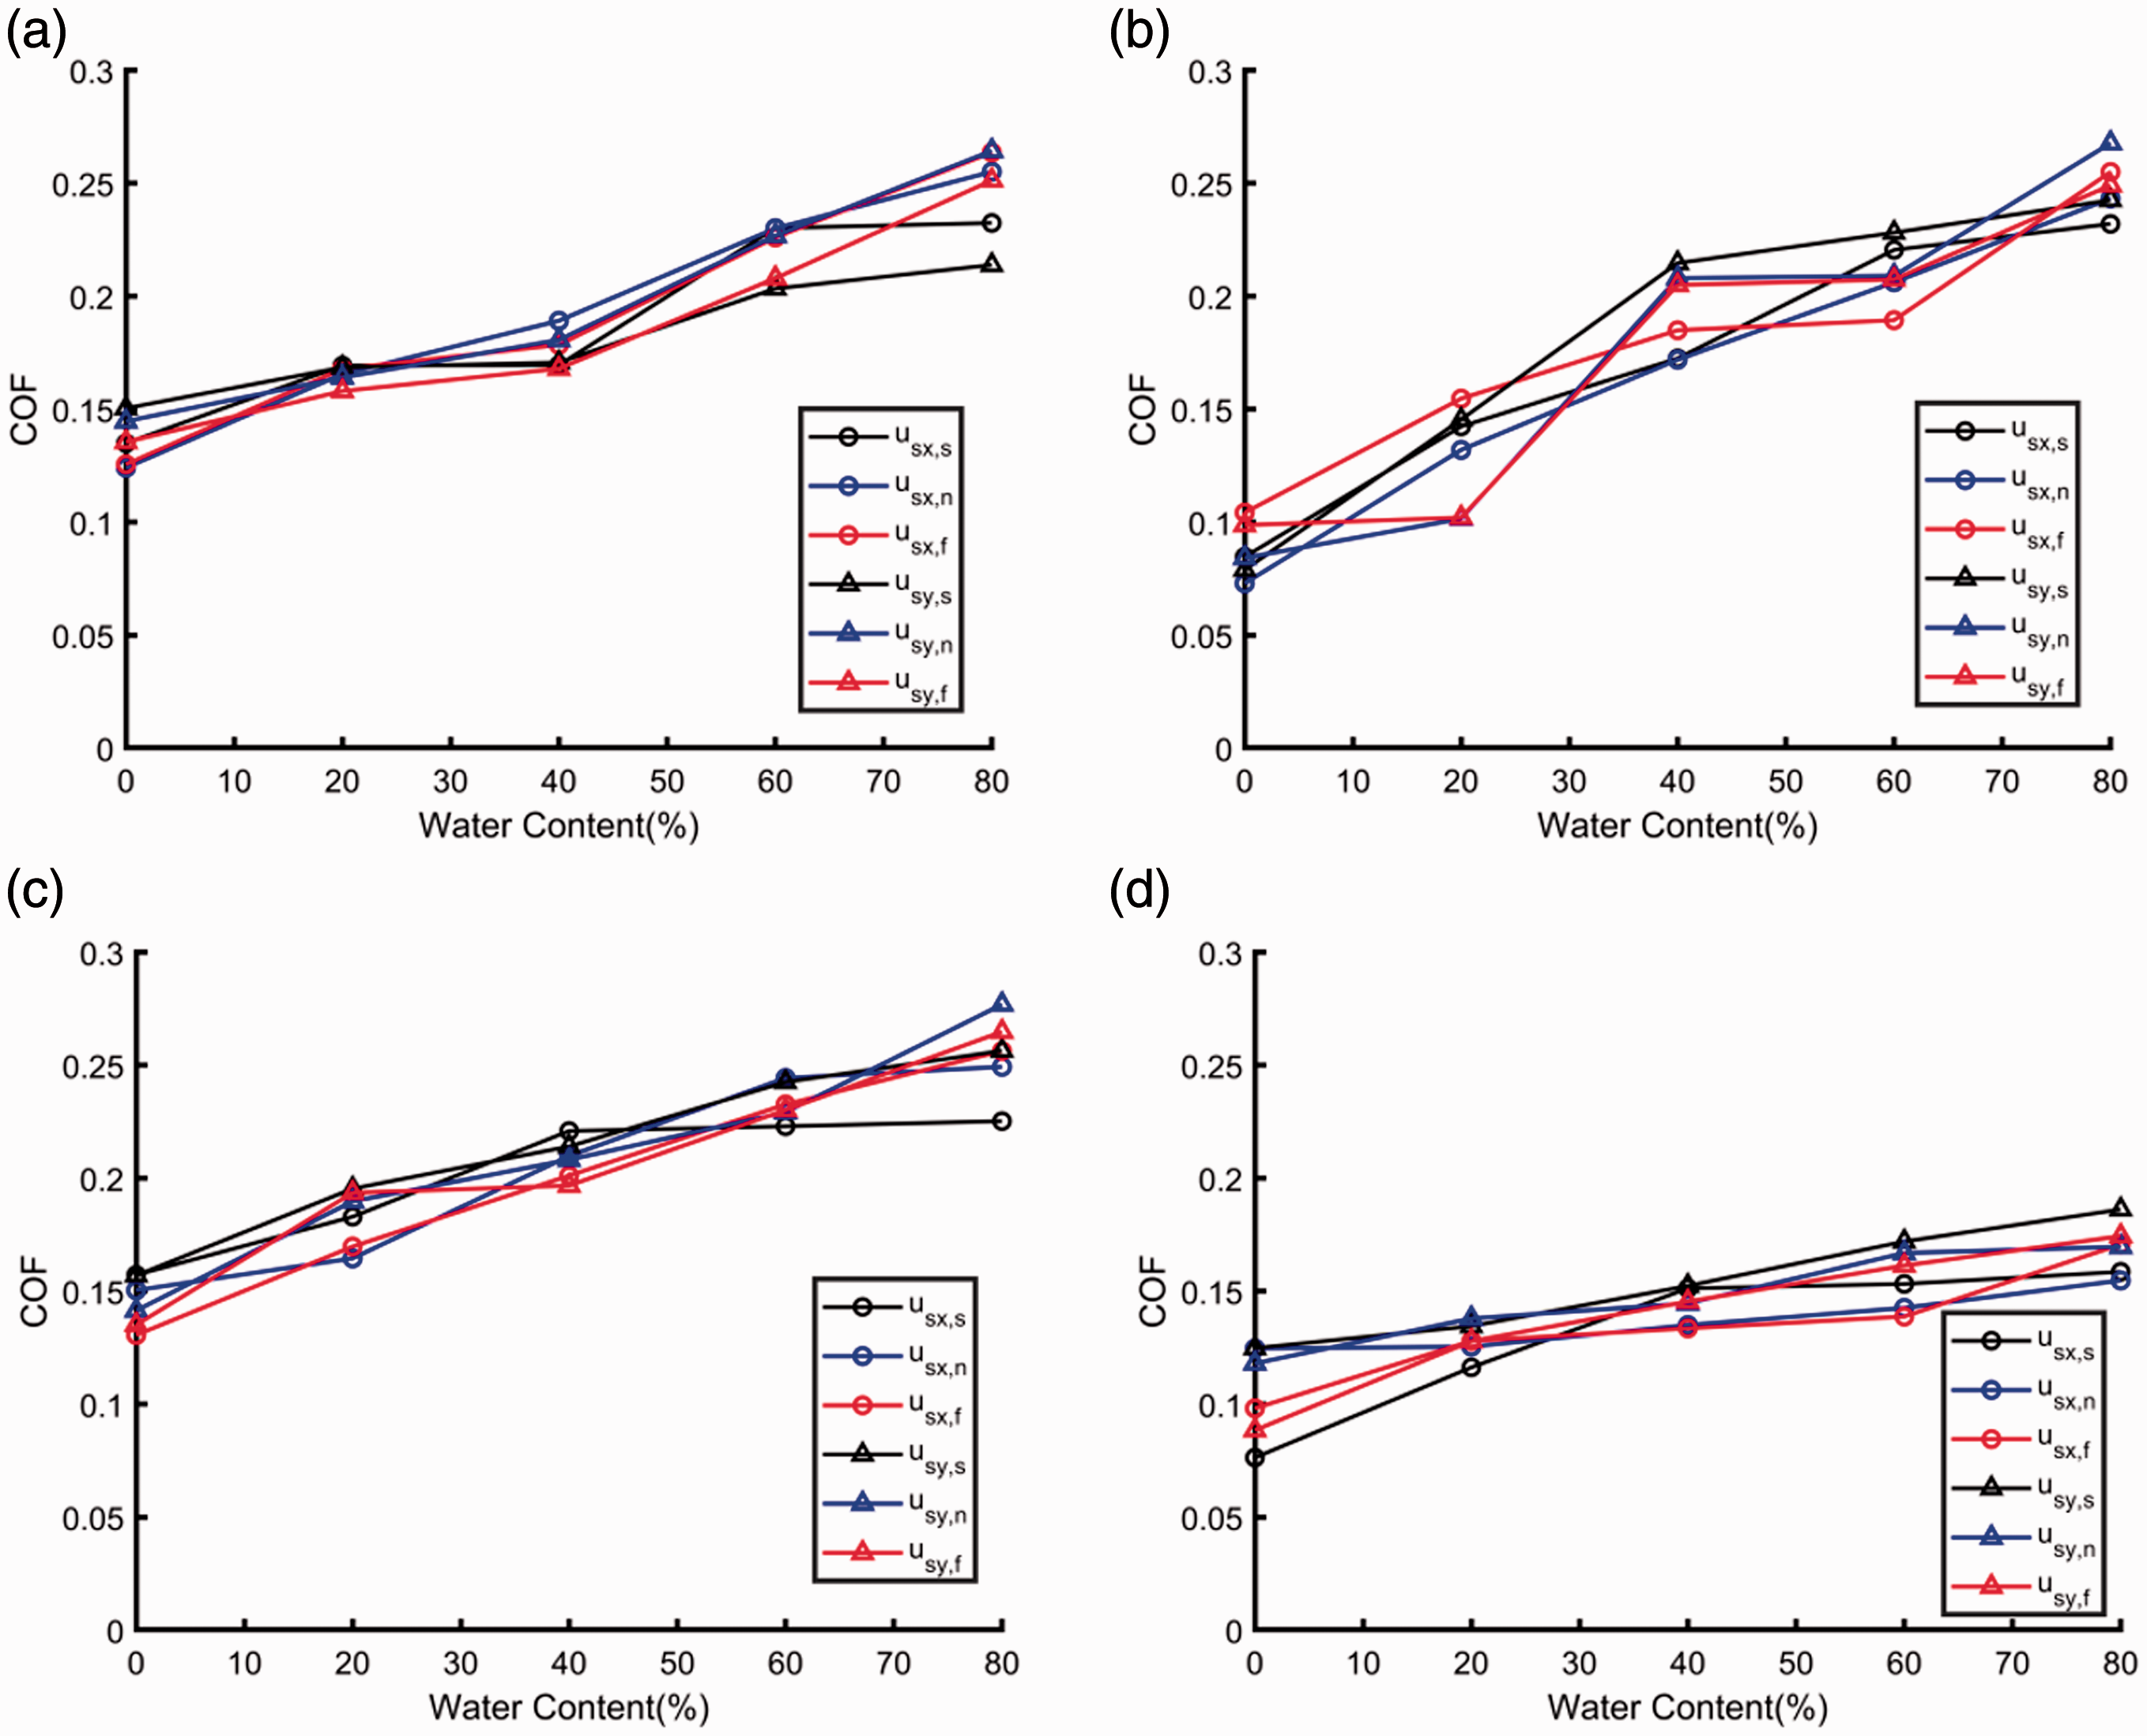
Influence of the water content on the sole friction during sliding: (a) gray, (b) blue, (c) white, and (d) yellow samples.
The sliding velocity influences the COF. Hermann [14] reported that the static COF could be effectively adjusted without considerably influencing the dynamic COF by changing the sliding velocity. However, we did not observe any influence of the sliding velocity on the static COF in this study. The COF calculation was based on the Coulomb friction law in this study rather than on Hermann’s model. The artificial skin used only in our study may also be responsible for the difference.
In Figure 7, μwy is larger than μwx, which represents the obvious influence of the direction. However, we do not observe a similar effect in Figure 9. Fy is larger than Fx owing to the human walk characteristic. However, in the sliding experiment, Fy was similar to Fx. Some studies demonstrated that the anisotropy of the fabric affected the COF, limited only to the dynamic COF [33,46]. The relationship between the static COF and fabric structure is still unknown.
Conclusion
To study the frictional mechanism during natural walking, we designed two correlative experiments. The experimental results indicated that the influences of water on the COF were similar in the two experiments. The COFs of the fabrics increased with the water content. However, once the water was squeezed out of the fabric, the COF in the walking experiments decreased, likely owing to the water generating a lubricating liquid film between the fabric and platform. Additionally, the COF and friction were larger in the walking direction. However, the sliding direction did not effectively affect the static COF in the sliding experiment. The speed was not an effective influencing factor on the COF in the walking and sliding experiments. Fast walking and sliding cannot affect the COF. The association between the anisotropy of the fabric and static COF should be further studied in the future. Our experiments revealed the frictional characteristics between the fabric-wrapped skin and other subjects under different moisture conditions. The results can be applied in studying daily walking.
Supplemental Material
sj-pdf-1-jit-10.1177_1528083720988083 - Supplemental material for Walking–sliding experimental analysis of frictional characteristics socked feet
Supplemental material, sj-pdf-1-jit-10.1177_1528083720988083 for Walking–sliding experimental analysis of frictional characteristics socked feet by Guangwu Sun, Hong Xie, Mark J Lake, Jiecong Li, Xiaona Chen and Yanmei Li in Journal of Industrial Textiles
Footnotes
Declaration of conflicting interests
The author(s) declared no potential conflicts of interest with respect to the research, authorship, and/or publication of this article.
Funding
The author(s) disclosed receipt of the following financial support for the research, authorship, and/or publication of this article: National Key R&D Program of China, Grants No. 2018YFC2000900. Talent Program of Shanghai University of Engineering Science.
Supplemental material
Supplemental material for this article is available online.
References
Supplementary Material
Please find the following supplemental material available below.
For Open Access articles published under a Creative Commons License, all supplemental material carries the same license as the article it is associated with.
For non-Open Access articles published, all supplemental material carries a non-exclusive license, and permission requests for re-use of supplemental material or any part of supplemental material shall be sent directly to the copyright owner as specified in the copyright notice associated with the article.