
Abstract
In this study, nitinol and steel wire core hybrid yarns were produced from wires having two different diameters and used as warp yarns to weave 3D woven fabrics in two different fabric constructions. The steel bars with two different diameters were placed into the gaps between fabric layers to create a hollow form after fabric production. The fabrics produced with cold-worked nitinol wire were exposed to heat treatments at high temperatures to provide them shape memory property according to data obtained from DSC analysis. Conventional textile fibers are not durable to these temperatures; for this reason, carbon fiber was used both as sheath material of hybrid yarns and additionally as warp and weft carbon fiber yarns. All yarn and fabric tests were carried out simultaneously to evaluate the mechanical properties of nitinol and steel wire core hybrid yarns, and wire-reinforced fabrics. Tensile tests were applied to all wire and hybrid yarn samples, DSC and DMA analyses were conducted for only heat-treated nitinol wires. Low-velocity impact, tensile and pull-out tests were applied to fabric samples. Reference fabrics with no wire were produced and evaluated by comparing with wire-reinforced samples to provide a point of comparison to the data from the mechanical properties of wire-reinforced 3D fabrics. The study's results were analyzed with regression analysis using the backward method, and the parameters such as wire type, wire diameter, and fabric gap width for optimum fabric production were determined. Data obtained from all mechanical tests demonstrate that fabric samples with steel wire, thinner wire, and narrow gaps have better results than others. The effect of wire thickness was also found the same for the nitinol wire. DMA analyses show that the thinner nitinol wire is better than, the thicker one. Finally, an innovative technique has been developed in this study to weave carbon fiber on a conventional automatic sample loom without fiber breakage by twisting PVA yarn around the wire core hybrid and twisted carbon fiber yarns.
Keywords
Introduction
Previous studies focus on composites' mechanical properties proved that composites reinforced with 3D woven fabrics have more impact resistance and energy absorption capability due to their structural integrity and fiber continuity [1–5]. Therefore, weaving techniques are more preferred than braiding, knitting, and nonwoven techniques used for the production of 3D fabrics.
3D woven fabrics are produced by using special 3D weaving machines or modified conventional weaving machines. According to the chosen weaving process, the produced 3D fabrics are defined as 3D fabrics produced on 2D weaving machines and 3D fabrics produced on 3D weaving machines. 3D fabrics are also grouped according to their fabric structure. These are solid, hollow, shell, and nodal fabrics [6–9].
Besides the usage form of reinforcement material, the type of raw material used as textile reinforcement is also crucial for a textile composite's mechanical properties. In this sense, it is known that high-performance fibers such as glass and carbon fibers are often preferred as textile reinforcement. Additionally, to gain electromagnetic shielding, heating, antistatic, crease-resistance properties to these composites, metal wire core hybrid yarns can also be added [10–16] to produce hybrid composites. Previous studies related to our study, determine that nitinol wires could absorb more tensile energy than other fibers and high strength metals, due to its low density. Therefore, by integrating a shape memory wire in a composite structure, properties of composite improve, and composite becomes more durable to impact loads. Additionally, according to the studies which compare nitinol and steel wires, the adaptation of nitinol wire into the woven fabric was found better. On the other hand, the contribution of steel wires on the mechanical properties of carbon fiber-reinforced composites is better than nitinol wires [17–23].
In this study, despite its fragile and stiff structure, thanks to its high thermal stability [24,25], carbon fiber was preferred inevitably and used as warp and weft yarns, and also as a sheath material of nitinol and steel wire core hybrid yarns. A conventional automated 2D weaving machine without modification was used to produce double-plied 3D carbon fiber fabrics by wrapping PVA yarn around carbon fiber yarns. Gaps were opened after production by inserting steel bars, and a hollow shape was given, and 3D fabric form was obtained.
Produced 3D hollow fabrics are aimed to use as textile reinforcement in composites, which are durable to low-velocity impacts, and therefore several mechanical tests were exposed to fabrics. Experimental results were also analyzed by regression analysis using the backward method, which is used to select the most appropriate variables by eliminating the insignificant ones.
Materials and methods
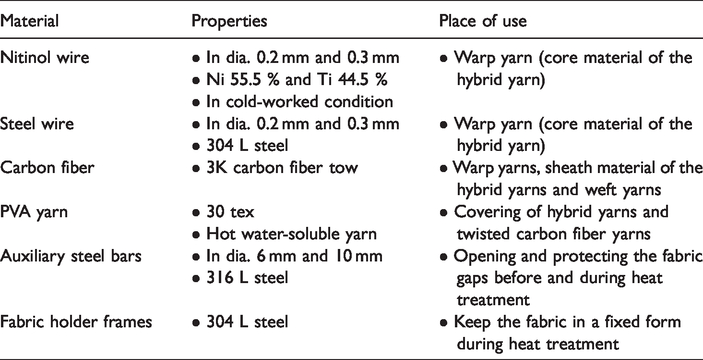
In this study, different raw materials such as nitinol wire (SAES Getters SpA), steel wire (KROMTEL Industry and Trade Inc.), carbon fiber (DowAksa Turkey), PVA-polyvinyl alcohol yarn (COATS Turkey) were used to produce wire core hybrid yarns and twisted carbon fiber yarns. Additionally, steel bars and fabric holder frames have been produced and were used as auxiliary materials. Detailed information about the materials used in the study is given in Table 1.
Raw and auxiliary materials used in the study.
Production of wire core hybrid yarns and twisted carbon fiber yarns
Hybrid yarns and twisted carbon fiber yarns were produced using Agteks DirecTwist C6”/D6” twisting machine. PVA yarn was used to wrap around both hybrid and twisted carbon fiber yarns at the final step to protect the carbon fibers against mechanical effects during weaving and actualize the weaving process without occurring any problem. Production details and definitions for hybrid yarns and twisted carbon fiber yarns are given in Tables 2 and 3, respectively.
Production details of hybrid yarns and twisted carbon fiber yarns.

Definitions for wire and hybrid yarn samples.

Production of 3D woven fabrics
In this study, ten different types of double-plied 3D hollow woven fabrics (wire core hybrid yarns were used in 8) were produced with CCI Tech Automated Sampling Loom- Evergreen (Figure 1). Two separate layers of the fabric are connected with a connecting fabric, which is a plain fabric construction. Total weft density is 12 picks/cm, and total warp density is 12 ends/cm (Six picks/cm and six ends/cm for a fabric layer). The warp ratio of wire core hybrid yarns to all warp yarns is ⅓. The average fabric areal density of double-plied 3D carbon woven fabrics is 1330 g/m2. Detailed information on fabric parameters and definitions for 3D woven fabric samples are given in Tables 4 and 5, respectively. After fabric production, auxiliary steel bars were inserted into the fabric gaps, and the 3D hollow fabric form was obtained. Nitinol and steel wire core hybrid yarns were used only in the warp direction to support the fabric's hollow shape and protect the gap form during mechanical tests. Figure 2 shows 3D cross-sectional views of the 3D hollow fabrics with narrow (a) and wide gaps (b), generated in ScotWeave software. Wire core hybrid yarns are highlighted with yellow color, can be seen from Figure 2.

CCI Tech automated sampling loom.
Detailed information on fabric parameters.

Definitions for 3D woven fabric samples.


3D cross-sectional views of the 3D hollow fabrics with narrow (a) and wide gaps (b).
Removal of PVA from the fabric
PVA on the fabric was needed to be removed after fabric production, especially for nitinol wire-reinforced fabrics exposed to heat treatments. PVA on all fabrics were removed to standardize the study. Experience in pre-trials and literature data [26–28] were used to determine the proper PVA removing process method in which the water temperature was 80°C, and the processing time was 90 seconds. Before the process, auxiliary steel bars were placed into the fabric gaps to protect the fabric's hollow shape. The process was carried out by dip up the fabric in still water by using a perforated bathtub to prevent the potential damage of heavy auxiliary steel bars to the wet fabric. Process conditions were held standard for all samples, and it was observed that small quantities of PVA residual on fabrics treated with hot water have an adhesive effect on yarns, which ensures to cut carbon fabric easily. Fabric appearance before and after PVA removal is given in Figure 3.
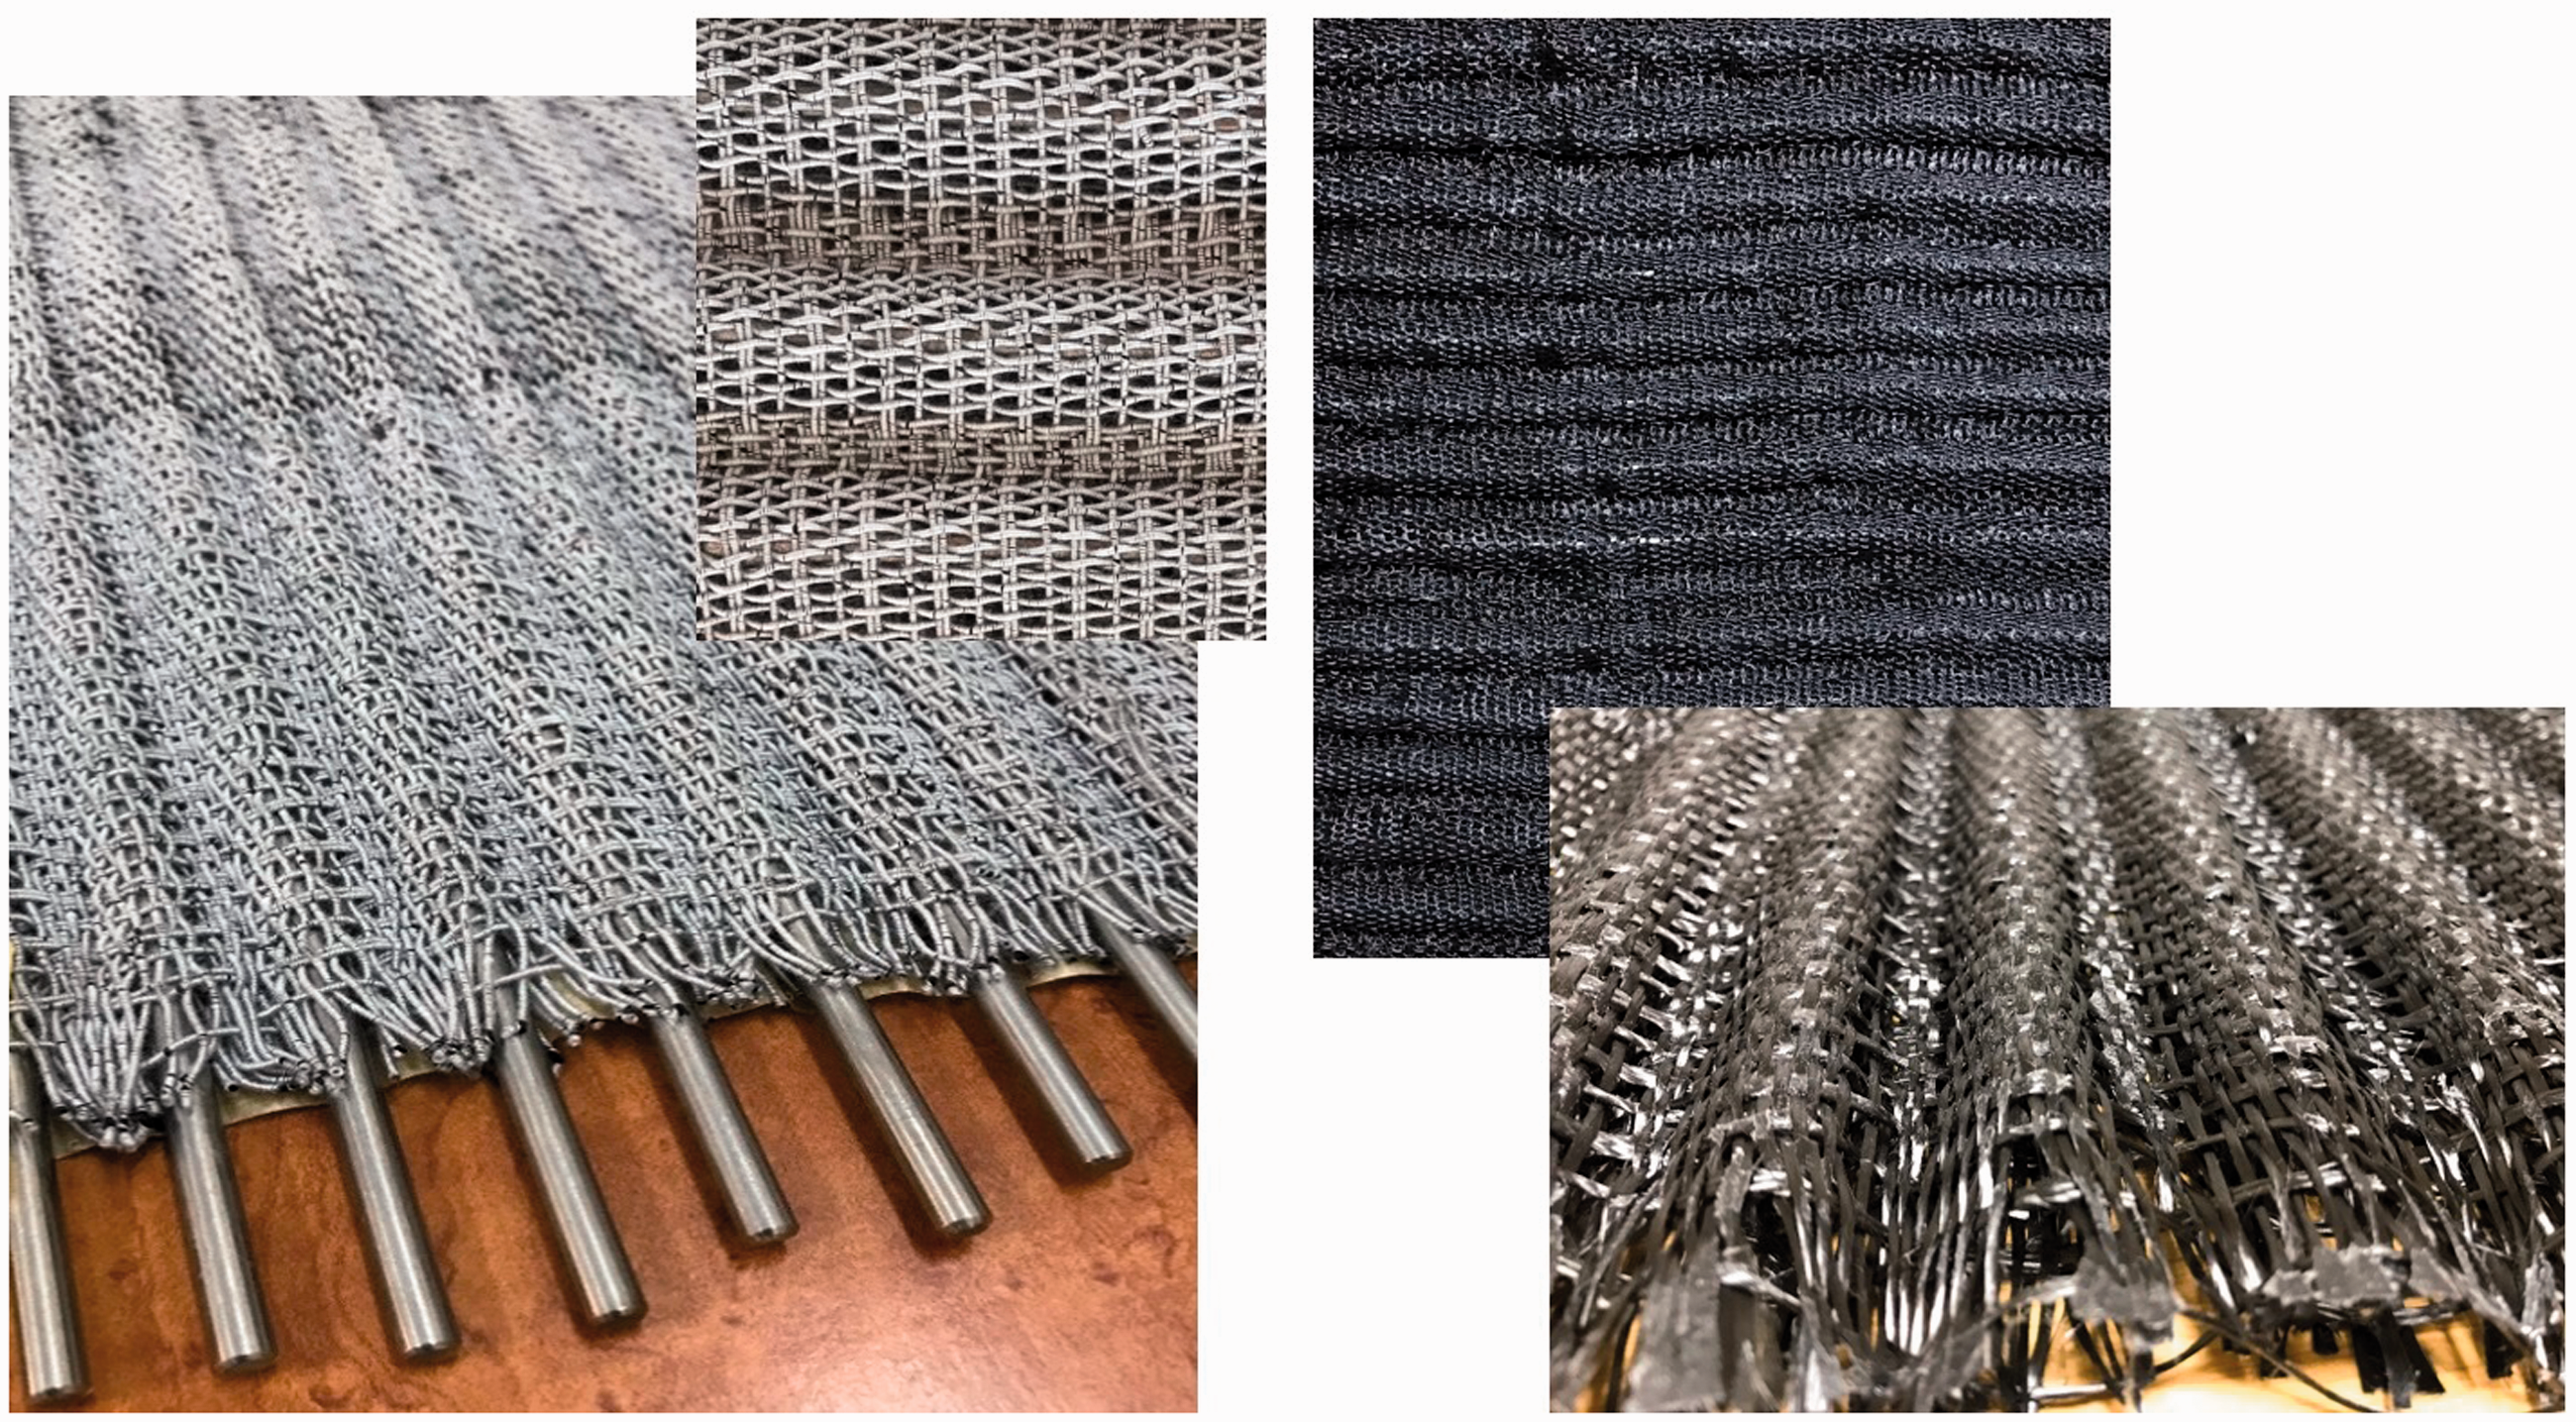
The fabric appearances before and after PVA removal.
Applying heat treatments and determining optimum temperature by DSC analysis
According to the results of pre-trials based on the literature [29–32], cold-worked nitinol wires in diameters 0.2 mm and 0.3 mm were exposed to heat in the argon atmosphere at four different temperatures (200°C, 300°C, 400°C, 500°C) for an hour in Protherm tube furnace and then quenched in salted ice-water.
DSC analysis was applied to all heat-treated wire samples, austenite and martensite transformation temperatures (Ms, Mf, As and Af) were determined with the help of exothermic and endothermic peaks. Perkin Elmer Pyris 6 Differential Scanning Calorimetry was used for analysis which was accomplished from -40°C to +80°C and from +80°C to -120°C with a heating/cooling rate of 5°C/min. According to the results of the DSC analysis, the optimum temperature was determined for heat treatment.
Heat treatments applied on 3D woven fabrics were carried out in Protherm high-temperature furnace. 3D woven fabrics with auxiliary steel bars were fixed in a steel frame to protect its shape during the process. The steel frame used in the study is given in Figure 4.

3D woven fabric sample fixed in a steel frame.
DMA analysis of nitinol wire core hybrid yarns
DMA analysis of heat-treated nitinol wire core hybrid yarns was carried out in TA Instruments DMA Q800. All technical calibrations of the DMA device and the clamps were done before each test. In the study, analysis methods were determined both for dynamic and static tests in the light of the previous studies [20,33,34]. In the dynamic test, the dynamic behavior of hybrid yarns was examined under different constant stresses (2 N, 4 N, and 6 N) in a temperature range between -40°C and +120°C with heating/cooling rate of 5°C/min. In the static test, strain properties of hybrid yarns were measured at constant temperature values determined with DSC analysis, and under different loads between (0.001-18 N).
Tensile test of wires, hybrid yarns, and fabrics
Tensile tests of wires and hybrid yarns were carried out on Shimadzu Universal Tensile Tester according to ASTM E8 standard. Tests were repeated for each sample five times. During tests performed at room temperature, a constant tensile force was applied to wire and hybrid yarns at a 1 mm/min velocity.
Fabric tensile tests were carried out on Shimadzu Universal Tensile Tester according to the ASTM D 3039 standard. Because the wire core yarns were only used in the warp direction of the fabrics to support the hollow shape and gap form, tests were done by applying a tensile force to fabrics only in warp direction at a 5 mm/min velocity. Tests were repeated for each sample three times.
Pull-out test of fabrics
In previous studies in which pull-out strength was studied [35,36], it was seen that the interface adhesion between the wire and the matrix was examined by pulling the wires from the composite structure. In this study, pull-out tests were accomplished on Shimadzu Universal Tensile Tester to investigate the pull-out strength of the wire core hybrid yarns from the 3D woven fabrics. There is not a particular standard for this test [37]. The test was carried out by mounting the end of hybrid yarn on the upper grip and the end of the fabric on bottom grip, and tensile force at a 1 mm/min velocity was applied to samples. Tests were repeated for each sample three times.
Low-velocity impact test of fabrics
The low-velocity impact test was carried out on the CEAST Fractovis Plus Impact tester according to the standard of ASTM D3763. The diameter of the impactor 12.7 mm, the mass 626 grams, and the maximum loading capacity of force transducer was chosen 22.4 kN. There is an anti-rebounding system in the testing machine to prevent the repeated impacts on the sample. The low-velocity impact was applied to different samples at 20 J, 40 J, and 60 J impact energy levels to determine the appropriate impact energy level for fabric samples. Because 40 J is the perforation threshold of the samples, the low-velocity impact test was carried out at this energy level for all samples. The average maximum impact velocity was 4.025 m/s, and tests were repeated for each sample three times.
Statistical evaluations
In the study, experimental data were evaluated with Multiple Linear Regression Analysis with IBM SPSS 22 software program at 95% confidence level. In the analysis, the backward method was chosen to determine the optimum parameters by removing the insignificant variables with coefficients with a low level of significance. Additionally, multiple regression models that forecast the effect of heat treatment, yarn type, wire type, wire diameter, and fabric gap width parameters on the mechanical properties of hybrid yarns and fabrics were obtained. Because the heat treatment, wire type, yarn type, and fabric gap width are categorical independent variables, artificial coding was done for each variable, and dummy variables were created according to the category number of the independent variable [38,39]. Table 6 shows the coding of dummy variables. The significance of the relationship between the dependent and independent samples was revealed utilizing regression analysis.
Coding of dummy variables.

Results and discussion
DSC analysis
In the study, DSC analysis was carried out to observe the transformation of nitinol wires between austenite and martensite phases, additionally to determine the transformation temperatures and the optimum heat treatment temperature. According to the results, nitinol wire exposed to heat at 200°C, did not exhibit any transformation. On the other hand, nitinol wires exposed to heat at 300°C, 400°C, and 500°C, exhibited transformation between austenite and martensite phases, in other words, gained shape memory property. The curves of nitinol wires in diameters 0.2 mm and 0.3 mm exposed to heat at 300°C, 400°C, and 500°C, are shown in Figures 5 to 7, respectively. The data obtained from all DSC plots are given in Table 7.

DSC plot of nitinol wire heat-treated at 300°C: (a) 0.2 mm and (b) 0.3 mm.
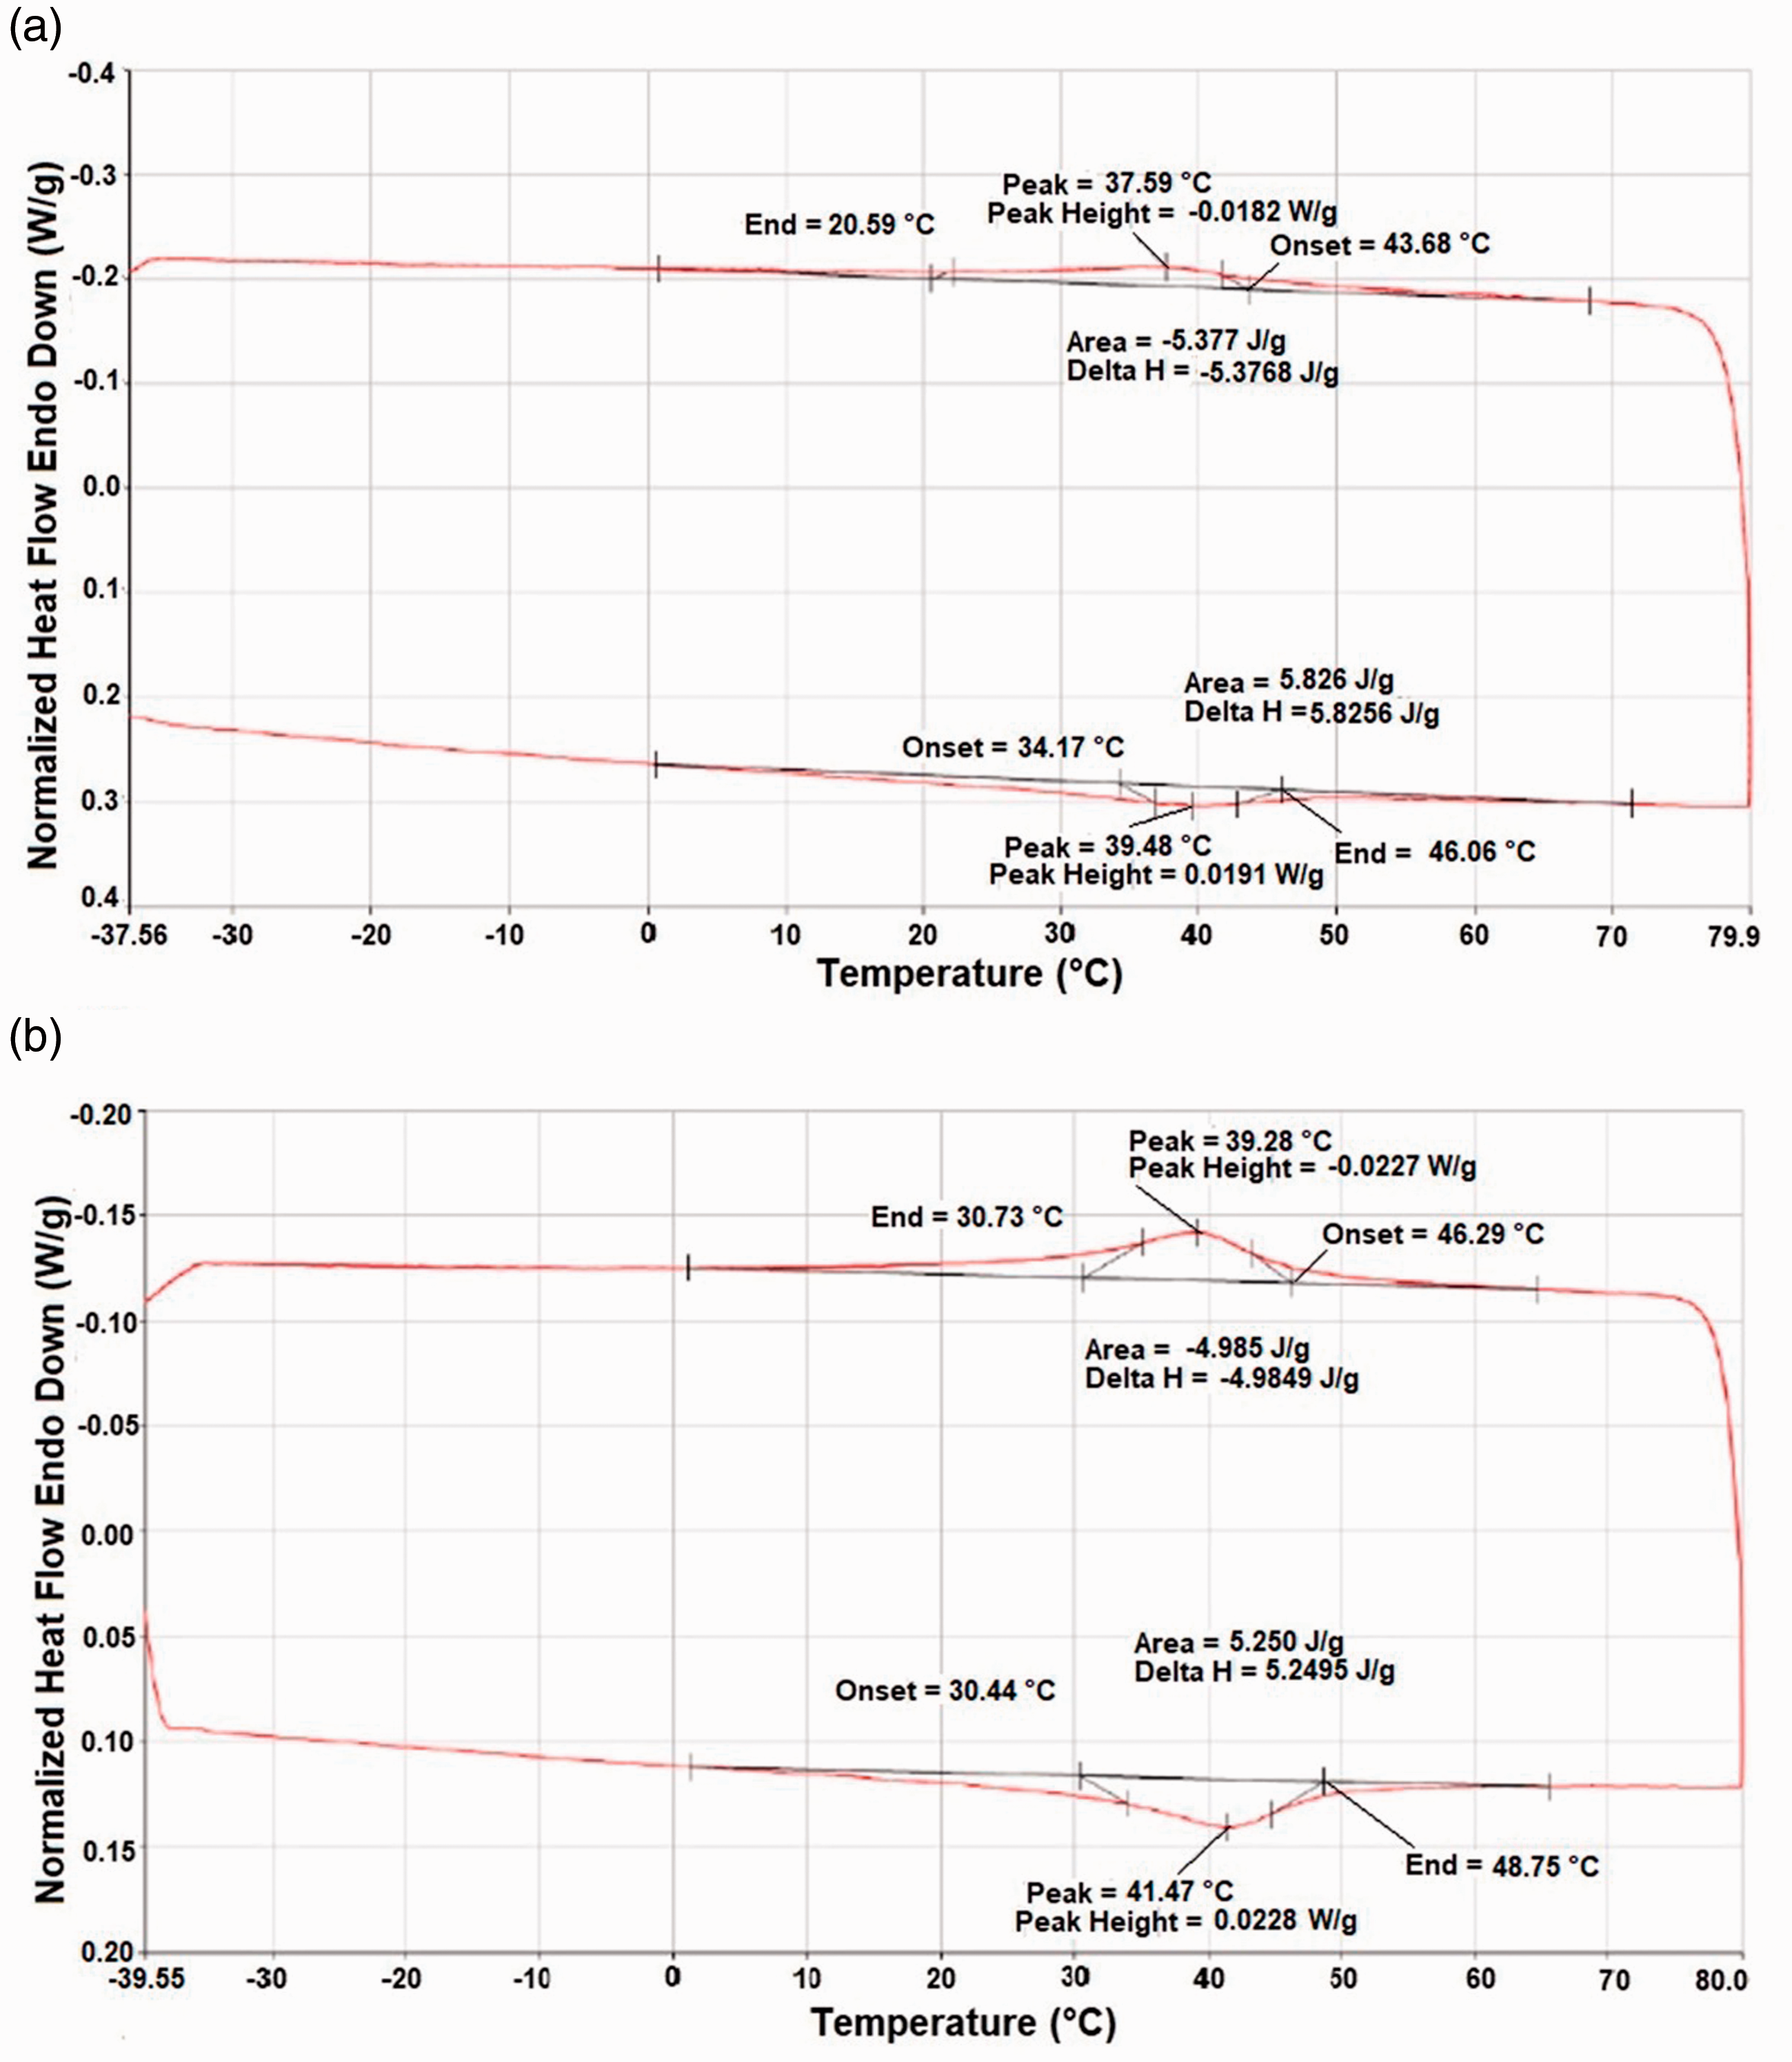
DSC plot of nitinol wire heat-treated at 400°C: (a) 0.2 mm and (b) 0.3 mm.

DSC plot of nitinol wire heat-treated at 500°C: (a) 0.2 mm and (b) 0.3 mm.
Data obtained from DSC analysis.

Figures 5 to 7 show the transformation cycle and the As, Af, Ms and Mf temperatures of heat-treated nitinol wires. When the DSC plot of nitinol wire in diameter 0.2 mm that exposed to heat at the optimum temperature (Figure 6(a)) is examined, it was seen that start temperature for endothermic phase transformation is As = 34.17°C. After this temperature, the material starts to transform into the austenitic phase. The endothermic reaction reaches a peak at 39.48°C (Apeak) and ends at 46.06°C. After austenitic finish temperature (Af), the material is completely austenitic. Austenitic phase transformation enthalpy was found 5.826 J/g. By cooling nitinol wire, the exothermic reaction was observed to begin, and the material started to transform into the martensitic phase. It was determined from DSC analysis that the martensitic start temperature is 43.68°C, and the martensitic finish temperature is 20,59°C. Martensitic phase transformation enthalpy was found -5.377 J/g. According to the DSC plot of nitinol wire in diameter 0.3 mm that exposed to heat at the optimum temperature (Figure 6(b)), endothermic phase transformation starts at As = 30.44°C, reaches a peak at Apeak = 41.47°C and finishes at Af = 48.75°C. Above austenitic finish temperature, the material was found 100% austenitic. An exothermic reaction was observed to start by cooling the wire. It was determined that the martensitic start temperature is Ms = 46.29°C, the martensitic peak temperature is Mpeak = 39.28°C, and the martensitic finish temperature is Mf = 30.73°C. Below Mf temperature, the material is totally in the martensitic phase. Austenitic and martensitic phase transformation enthalpies were found +5.250 J/g and −4.985 J/g, respectively.
According to Table 7, the maximum heat exchange was observed at 400°C during phase change for both endothermic and exothermic reactions for both wire diameters. It means that system needs more heat exchange to occur phase transformation [40] of nitinol wires at this temperature. For this reason, 400°C was chosen as the optimum temperature for all heat treatments. The As, Af, Ms and Mf temperatures obtained from DSC analysis were also used to determine the austenite and martensite temperatures of different wire diameters to carry out the DMA analysis.
DMA analysis
In this study, to observe the mechanical properties of nitinol wire according to the temperature change, dynamic and static tests were carried out under constant forces and temperatures. Since the mechanical properties of steel wire do not depend on the temperature [32], the analysis was only applied to heat-treated nitinol wire samples. Strain-temperature curves obtained from the dynamic tests for nitinol wires in diameters 0.2 mm and 0.3 mm are given in Figure 8.
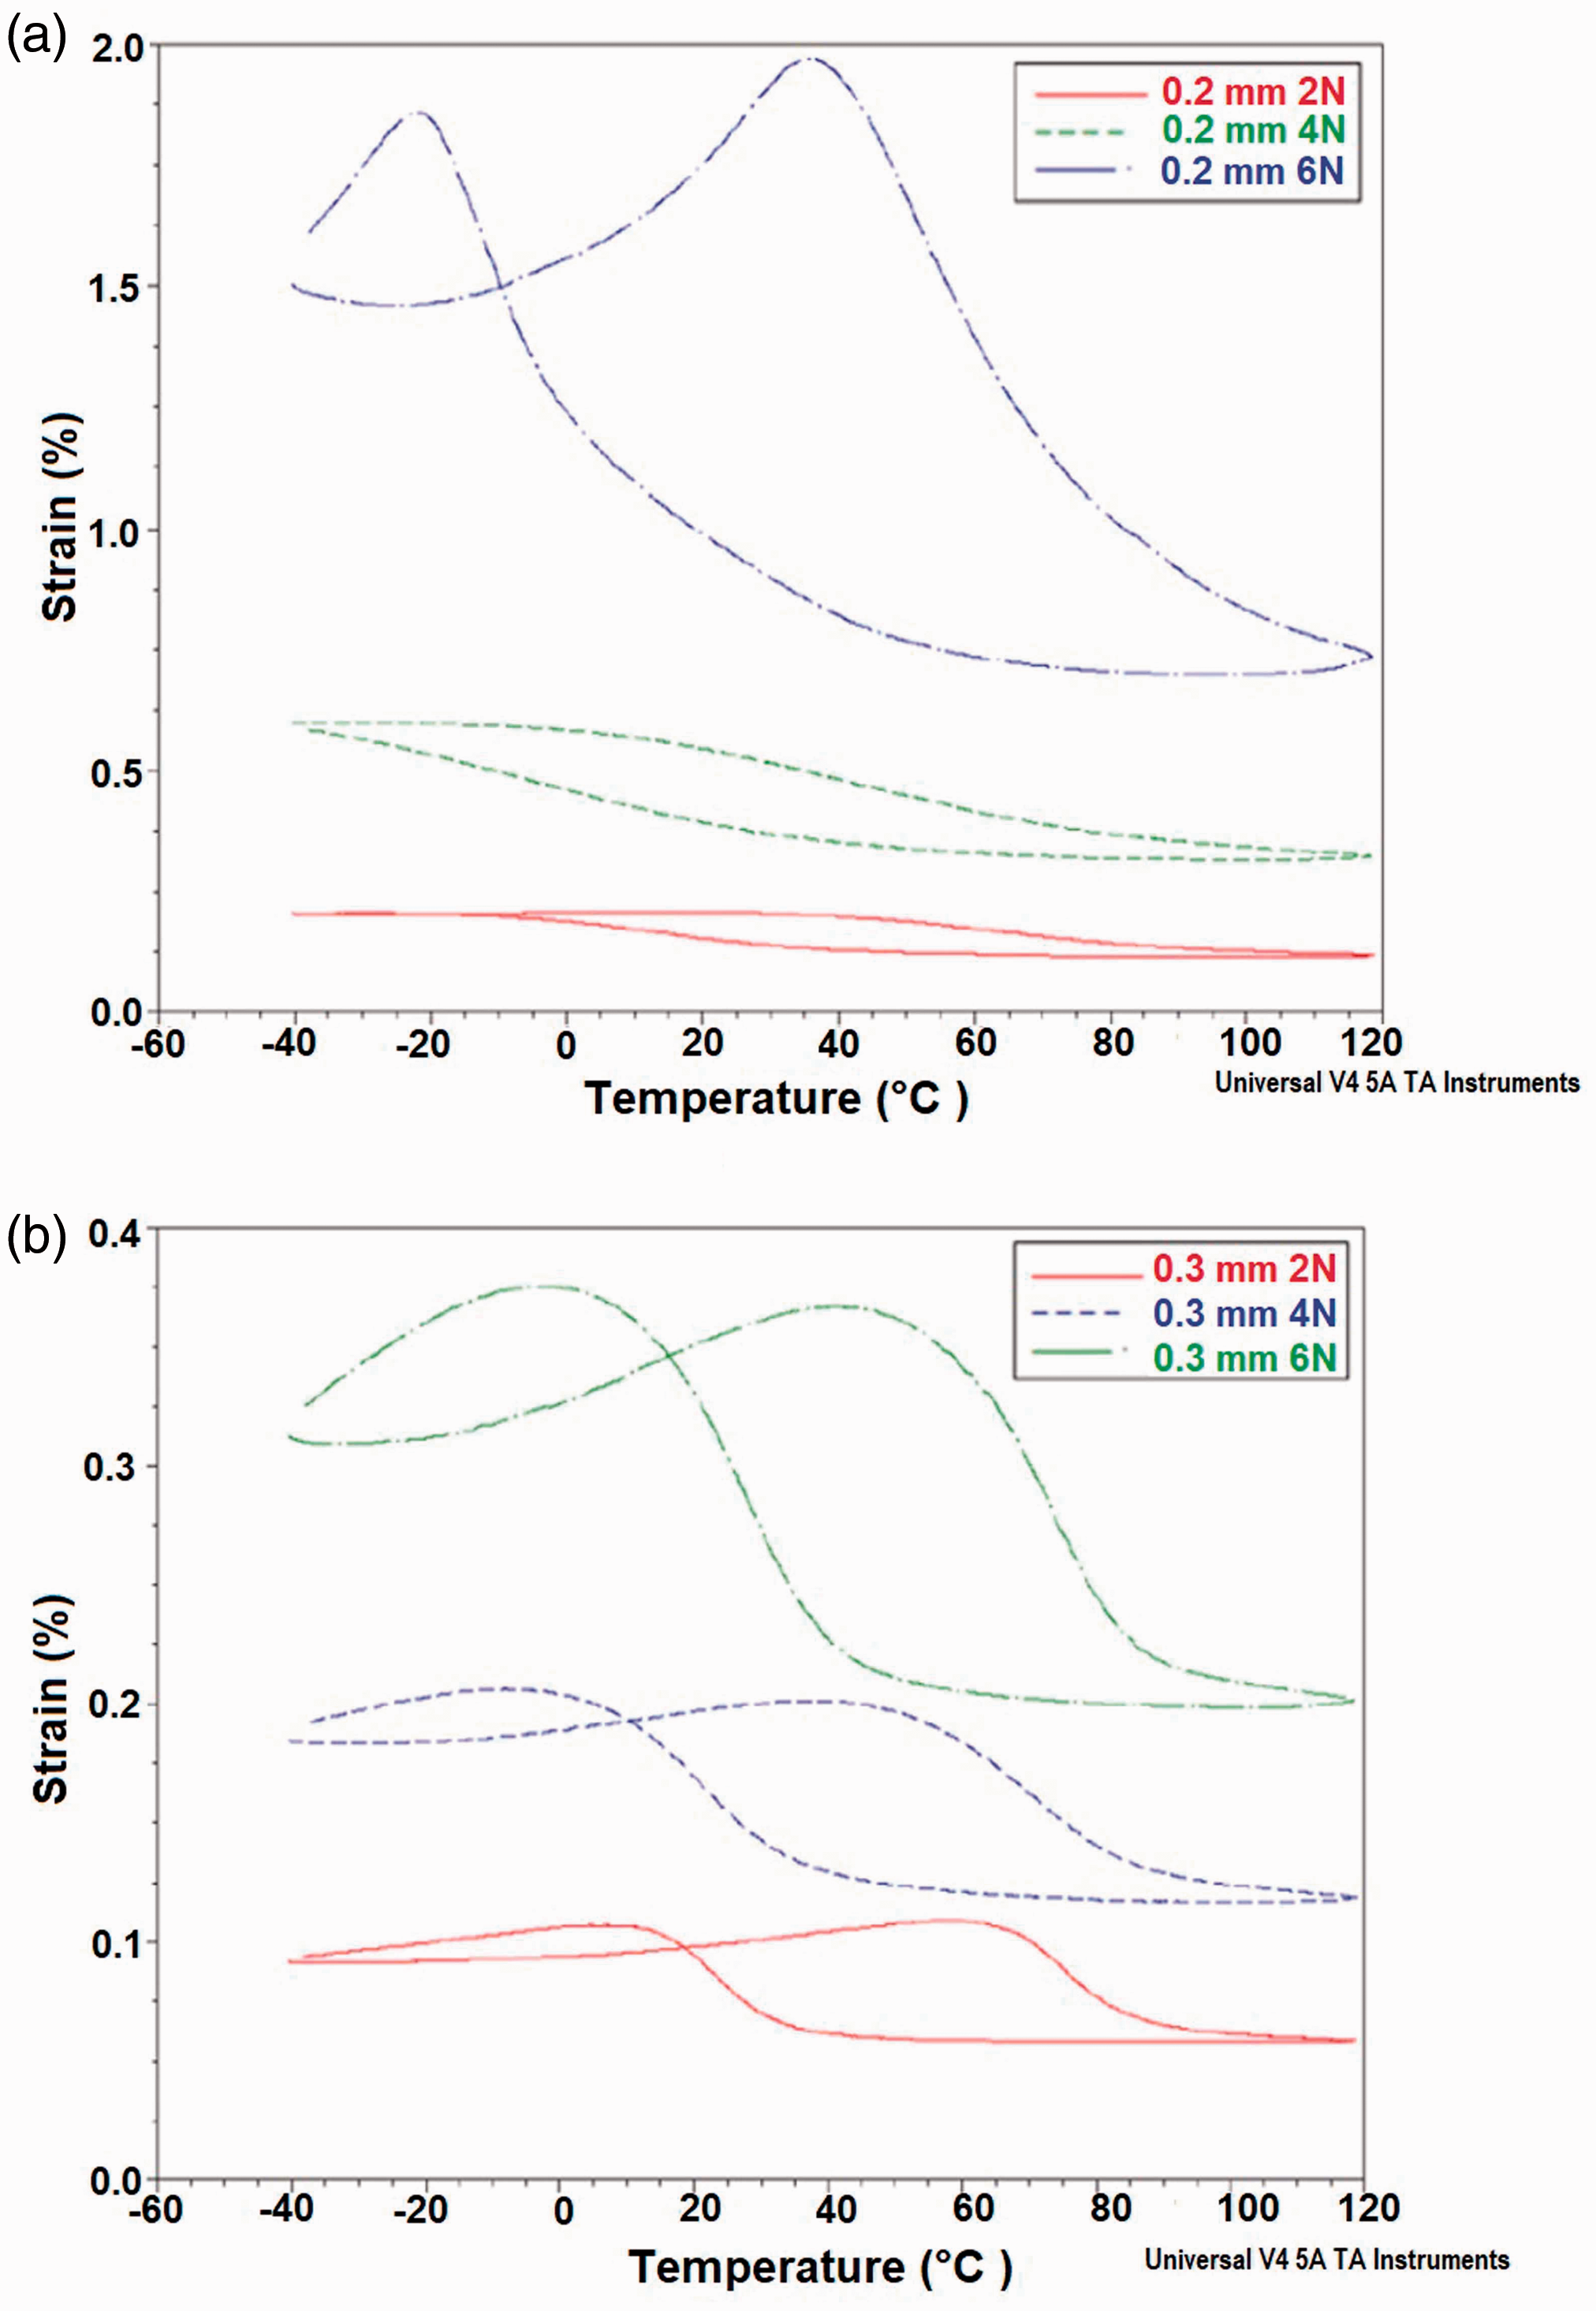
Strain-temperature curves of nitinol wire obtained by dynamic analysis: (a) 0.2 mm and (b) 0.3 mm wire.
According to the obtained results, it was determined that the strain value changes depending on temperature and the applied force, additionally the strain increases by an increase in applied force for both wire diameters. On the other hand, the transformation of nitinol wire between the austenitic and martensitic phases was observed. Depending on the temperature change, it was seen that the strain first increases with the increase of temperature, then decreases for 0.2 mm wire, which was exposed to 6N and for all wires in diameter 0.3 mm. When the transformation begins from the austenitic phase to the martensitic phase, the strain increases first depending on the decrease in temperature, then it decreases. It was determined for 0.2 mm wires exposed to 2 N and 4 N forces that the strain decreases with increment in temperature and increases with a decrease in temperature.
The change in storage modulus of nitinol wires depending on temperature was also examined in the dynamic test scope. Storage modulus-temperature curves of nitinol wires in diameters 0.2 mm and 0.3 mm are given in Figure 9. According to the results, it was observed that the storage modulus decreases at first, then increases due to the increase of temperature for both wire diameters. This result is also compatible with the literature [34]. Also, different results were obtained for different wire diameters. Maximum storage modulus values were observed under 2N and 4N forces for 0.2 mm and 0.3 mm nitinol wires, respectively. Because storage modulus of 0.2 mm wire higher than 0.3 mm wire, it can be said that 0.2 mm nitinol wire is more durable against deformation and absorbs more energy.

Storage modulus-temperature curve of nitinol wire obtained by the dynamic test: (a) 0.2 mm and (b) 0.3 mm wire.
Stress-strain curves obtained from the static test for 0.2 mm and 0.3 mm wires are given in Figure 10. As shown in Figure 10, force loading and unloading curves obtained from the static analysis carried out at different constant temperatures do not overlap. It is similar to the heating and cooling cycle, hysteresis, which was obtained with stress-strain curves. Therefore, it could be concluded that the nitinol wires gained shape memory property by the heat treatments applied in the study.

Stress-strain curve of nitinol wire obtained by static analysis: (a) 0.2 mm and (b) 0.3 mm wire.
According to static test results, it was determined that the mechanical properties of nitinol wires change depending on the temperature. The strain values of the wires in the martensitic phase are more than in the austenitic phase for both two different wire diameters. It is caused by the fact that the nitinol wire in the martensitic phase can be deformed easily [41]. The decrease in strain depending on temperature is much more distinct for 0.2 mm wire, and it can be said that the strain of 0.2 mm wire in the martensitic phase is higher than 0.3 mm wire.
Tensile tests of wire and hybrid yarns
Obtained results from the tensile test applied on the wire, and hybrid yarns are given in Table 8. Additionally, stress-strain curves were prepared according to the results and interpreted in terms of the effect of parameters such as heat treatment (heat-treated or cold-worked), yarn type (wire or hybrid yarn), wire type (steel or nitinol) and wire diameter (0.2 mm or 0.3 mm). Stress-strain curves of heat-treated and cold-worked nitinol wires, and nitinol wire core hybrid yarns are given in Figure 11.
Tensile test results of wire and hybrid yarns.


Stress-strain curves of heat-treated and cold-worked nitinol wires and hybrid yarns: (a) 0.2 mm and (b) 0.3 mm
It was determined that cold-worked nitinol wires and the hybrid yarns have higher tensile strength but have lower strain values for both wire diameters than heat-treated nitinol wires and nitinol wire core hybrid yarns (Figure 11). This result originated from high-density dislocations, which are the crystal defects and occur due to atoms' improper configuration. They are presented in the inner structure of the cold-worked wire. So, it causes an increase in strength of the material; on the other side, flexibility decreases because of dislocations. Thanks to heat treatment, dislocations that prevent martensitic transformation are eliminated, so the rate of recoverable strain increases [42,43].
In statistical analysis, two statistically significant regression models were obtained. ANOVA results are F(4,35) = 11.307, p < 0.001 for first the regression model and F(3,35) = 14.937, p < 0.001 for the second. Table 9 shows the statistical data of regression models forecasting tensile strength of wire and hybrid yarns.
Statistical data of regression models forecasting tensile strength of wires and hybrid yarns.

Statistically significant.
According to Table 9, the effects of heat treatment, yarn type, and wire type were found statistically significant. The regression equation obtained after removing the insignificant variable is given below
The regression equation shows that the tensile strength of the sample significantly decreases by heat treatment; additionally, better results are obtained when hybrid yarn and nitinol wire are used. It is determined that statistical results support the experimental data.
Stress-strain curves prepared by grouping the samples according to the sample type are given in Figure 12 for steel and nitinol wire, respectively. As is seen from the figures, both hybrid yarns produced with nitinol and steel wires have more strength than the single wire form. It is an expected result because the wire in the core was supported with twisted carbon fiber yarn, and as a result, yarn strength increases.

Stress-strain curves of wires and hybrid yarns: (a) steel and (b) nitinol.
Two regression models for predicting tensile strain were obtained, and they were found statistically significant. ANOVA results are F(4,35) = 112.937, p < 0.001 for first the regression model and F(3,35) = 155.434, p < 0.001 for the second. Table 10 shows the statistical data of regression models forecasting tensile strain.
Statistical data of regression models forecasting tensile strain of wires and hybrid yarns.
Statistically significant.
According to Table 10, the effects of wire diameter, heat treatment, and wire type were found statistically significant. The regression equation obtained after removing the insignificant variable is given below
The regression equation shows that the sample's tensile strain significantly increases by applying heat treatment and using steel wire. Additionally, the increase in wire diameter significantly increases the strain values. Statistical results correspond to experimental results.
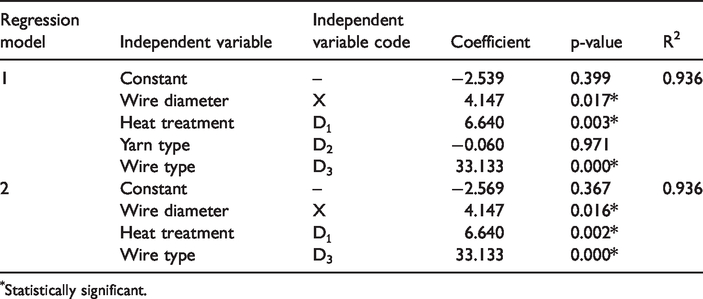
According to the regression analysis results for predicting the elasticity modulus of wire and hybrid yarns, three regression models were obtained. ANOVA results are found F(4,35) = 16,813, p < 0.001 for the first, F(3,35) = 22.277, p < 0.001 for the second and finally F(2,35) = 30.857, p < 0.001 for the third regression model. Table 11 shows the statistical data of regression models forecasting elasticity modulus.
Statistical data of regression models forecasting elasticity modulus of wires and hybrid yarns.
Statistically significant.
According to Table 11, the effects of wire diameter and yarn type were found statistically significant. The regression equation obtained after removing the insignificant variables is given below
The regression equation shows that wire diameter and yarn type significantly affects the elasticity modulus value. It is seen that increase in wire diameter significantly decreases the elasticity modulus, and higher elasticity modulus is observed when the hybrid yarn is used.
Tensile test of fabrics
The data obtained from the tensile test of 3D woven fabrics are given in Table 12. According to the results obtained from the test only applied in the warp direction, stress-strain properties of fabric samples were examined in terms of sample type (fabric with steel or nitinol wire and without wire), wire diameter (0.2 mm or 0.3 mm), and gap width (wide or narrow).
Tensile test results of 3D woven fabrics.

Stress-strain curves were prepared by grouping samples according to the sample type to evaluate the effect of wire diameter and gap width (Figure 13). According to the tensile test results of fabric samples with steel wire, sample 03-S-W has the highest tensile strength, and sample 03-S-N has the second highest tensile strength value. Similarly, sample 02-S-W is better than fabric with narrow gaps, although the wire diameter was the same (02-S-T). This result could be interpreted as the increase in wire diameter, and wide gap choice increase the fabrics' tensile strength. It is an expected result that the thick wire causes an increase in the tensile strength of the fabric because the tensile strength of both wire and hybrid yarns was also found higher for thicker wire diameter.

Stress-strain curves of 3D woven fabrics according to the sample type: (a) fabrics with steel wire and reference fabrics, (b) fabrics with nitinol wire, and reference fabrics.
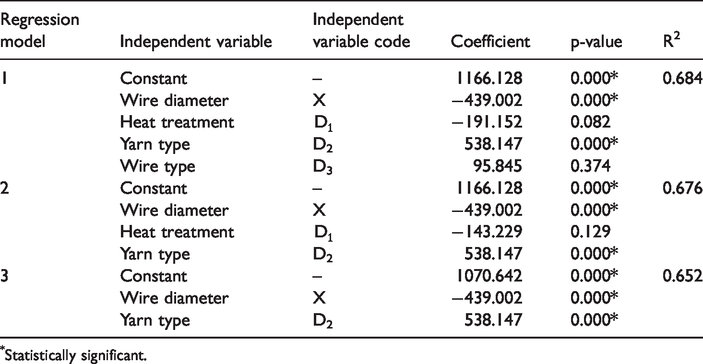
In order to support the experimental results, multiple linear regression analysis was carried out. Three regression models were obtained. ANOVA results are found F(4,19) = 6.418, p = 0.003, F(3,19) = 8.943, p = 0.001 and F(2,19) = 13.264, p < 0.001 respectively. Table 13 shows the statistical data of regression models forecasting the tensile strength of fabric samples.
Statistical data of regression models forecasting tensile strength of fabrics.

Statistically significant.
According to Table 13, only the use of steel wire was statistically significant (p < 0.001). The regression equation obtained after removing the insignificant variables is given below
The regression equation shows that the fabric's tensile strength significantly increases by using steel wire in the fabric construction. Additionally, the choice of the wide gap has a positive effect on tensile strength in line with the experimental data. Nevertheless, it was not found statistically significant.
On the other hand, when stress-strain curves of steel wire-reinforced fabrics were examined, strain values of fabric with 0.2 mm wires and narrow gaps (02-S-N) were higher than those with wide gaps. As a result, it can be interpreted that the fabric structure with thin wire diameter and narrow gaps increases the strain value. The reference sample with the wide gap (R-W) is worse than fabrics with 0.3 mm steel wire and better than fabrics with 0.2 mm wire, while the reference sample with narrow gaps (R-N) has the lowest tensile strength and the lowest strain value.
It was determined from the results that the sample 03-N-N has the best, and the sample 03-N-W has the worst tensile strength around all nitinol wire-reinforced fabrics. Because of this, for nitinol wire included samples, it can be said that fabrics with narrow gaps are better than fabrics with wide gaps. When reference samples compared with fabrics with nitinol wire, it was determined that the reference sample with narrow gaps (R-N) has higher tensile strength than the nitinol included fabrics, and the reference sample with the wide gap has the lowest tensile strength in all samples. It is thought that the difference between R-N and R-W may be due to fabric structure. There are two explanations for the higher tensile strength property of the reference fabric sample with wide gaps than fabric samples with steel wire (except fabrics with 0.3 mm steel wire) and the fabrics produced with nitinol wire. Firstly, the usage of high-performance fibers that are fragile like carbon or glass contributes to the mechanical properties but, at the same time, may cause a start of damage in the microstructure. The deformation that occurred in the microstructure causes a decrease in mechanical properties [17]. Secondly, in the study, the shape-memory property was gained to nitinol wire by applying heat treatments in the fabric form, which caused a decrease in the tensile strength of carbon fiber [44].
To examine the effect of sample type on the stress-strain property, fabric samples that include wire were grouped according to the wire diameter. The prepared stress-strain curves are given in Figure 14 for 0.2 mm and 0.3 mm wires, respectively. According to the obtained data, it is determined that the fabric samples with steel wire are better than fabrics with nitinol wire in terms of tensile strength, for both wire diameters. The strain values of fabrics with narrow gaps are higher than the fabrics with wide gaps for both fabrics having steel and nitinol wire.

Stress-strain curves of 3D woven fabrics according to the wire diameter: (a) 0.2 mm and (b) 0.3 mm.
On the other hand, according to the statistical analysis results that were carried out to forecast strain and elasticity properties of fabrics, obtained regression models and independent variables that enter the models were not found statistically significant.
Pull-out test of fabrics
After the pull-out test, maximum average force and displacement values to pull a hybrid yarn out of the fabric were determined. The results obtained from the pull-out test are given in Table 14.
Pull-out test results of 3D woven fabrics.

It could not be calculated because of the limited number of samples tested.
By using the results obtained from the pull-out test, force-displacement curves were prepared, to examine the property of pull-out resistance in terms of sample type (fabrics with steel or nitinol wire), wire diameter (0.2 mm or 0.3 mm) and fabric gap width (narrow or wide gap). Force-displacement curves of fabrics grouped according to the sample type are given in Figure 15 for fabrics with steel and nitinol wire, respectively.

Force-displacement curves of samples: (a) steel wire and (b) nitinol wire-reinforced fabrics.
According to the results obtained from the pull-out test of steel wire-reinforced fabrics, it was determined that the fabric sample with narrow gaps and wire diameter in diameter 0.3 mm (03-S-N) has the highest pull-out force and displacement values. On the other hand, the lowest values were obtained from the fabric sample with wide gaps and 0.3 mm steel wires (03-S-W). In this respect, it can be said that the pull-out force needed to pull a hybrid yarn out of a steel wire-reinforced fabric with narrow gaps is higher than fabrics with wide gaps. On the other hand, according to the results of nitinol wire-reinforced fabrics, fabrics with wire in diameter 0.2 mm and narrow gap have higher pull-out force values than 0.3 mm wire and wide gap fabrics (Table 14). The higher pull-out strength was observed for both steel, and nitinol wire-reinforced fabrics with narrow gaps. It is an expectable result because of the tight structure of fabrics with narrow gaps.
By regression analysis of pull-out data, two regression models were obtained for forecasting the pull-out force. ANOVA results are found statistically significant as F(3,15) = 17.659, p < 0.001 and F(2,15) = 28.086, p < 0.001 respectively. Table 15 shows the statistical data of regression models forecasting the pull-out force of fabric samples.
Statistical data of regression models forecasting pull-out force of fabrics.

Statistically significant.
According to Table 15, sample type-1 and gap width were found statistically significant. The regression equation obtained after removing the insignificant wire type variable is given below
The regression equation shows that the fabric's pull-out strength significantly decreases when nitinol wire is used, and the gap width is wide. Experimental results also support the results of statistical analysis. Experimental data proves that the pull-out strength of fabrics with narrow gaps is higher than fabrics with wide gaps. Similarly, nitinol reinforced fabrics have lower pull-out force than steel wire-reinforced fabrics.
Samples were grouped according to the gap width to evaluate the effect of sample type and wire diameter on pull-out strength. Force-displacement curves of fabrics that were grouped according to the gap width are given in Figure 16 for fabrics with narrow and wide gaps, respectively. According to the experimental results, the pull-out strength of steel wire included fabrics with narrow gaps is higher than the nitinol wire included fabrics.

Force-displacement curves of samples: (a) fabrics with narrow gaps and (b) fabrics with wide gaps.
ANOVA results show that three significant regression models of displacement were obtained. These are F(3,15) = 9.733, p = 0.002; F(2,15) = 15.574, p < 0.001 and F(1,15) = 27.740, p < 0.001 respectively. Table 16 shows the statistical data of regression models forecasting pull-out displacement of fabric samples.
Statistical data of regression models forecasting pull-out displacement of fabrics.

Statistically significant.
According to Table 16, only the gap width parameter was found statistically significant (p < 0.001). The regression equation obtained after removing the insignificant variables is given below
The regression equation shows that the wire displacement during the pull-out test significantly decreases when the wide gap fabric is used.
Low-velocity impact test of fabrics
Data of contact force, deformation, and absorbed energy obtained from the impact test are given in Table 17. According to the fabric impact test results, contact force-deformation curves and energy-time curves were prepared. Impact properties of samples were examined in terms of sample type (sample with steel wire or sample with nitinol wire or reference sample), wire diameter (0.2 mm or 0.3 mm), and gap width (narrow or wide gap) and data were reviewed.
Data belong to the fabric impact test.

Samples were grouped according to the wire type and compared to reference samples. Contact force-deformation curves of fabrics with steel and nitinol wires are shown in Figure 17. The comparison between fabrics with steel wire and the reference samples shows that the highest contact force was obtained from the fabric with narrow gaps and including wires in 0.2 mm diameter (02-S-N). Figure 17(a) has shown that the sample 02-S-N has a closed curve at the energy level of 40 J. This means that the impactor rebounds at 40 J, and the applied impact does not cause a perforation on the sample. Reference samples, with narrow and wide gaps, have the highest contact force after the sample 02-S-N. This result obtained from the reference samples without wire is thought to be caused by the damage in the microstructure that occurred during the weaving process, and accordingly, the mechanical properties of carbon fabric containing wire decreases [17]. The lowest contact force was obtained for the sample with wires 0.3 mm in diameter and wide gaps (03-S-T). Therefore, it can be said that an increase in wire diameter causes an adverse effect on impact behavior.

Contact force-deformation curves of samples: (a) steel wire-reinforced fabrics versus reference fabrics and (b) nitinol wire-reinforced fabrics versus reference fabrics.
On the other hand, the comparison between fabrics with nitinol wire and the reference samples, respectively, reference samples, with narrow and wide gaps, were observed to have higher contact force than all fabrics with nitinol wire. Also, as seen in Figure 17(b), reference samples' impact behavior was found better than the fabric samples with nitinol wire. This result is similar to the fabric tensile test results, as explained in the previous parts (please see “Tensile test of fabrics”).
When the results are evaluated only for nitinol wire-reinforced fabrics, it was determined that the 0.2 mm wire-reinforced fabric with narrow gaps (02-N-N) has the highest contact force, and this was followed by the samples 02-N-W, 03-N-N and 03-N-W, respectively. According to these results, it can be said that the nitinol wire-reinforced fabric samples with narrow gaps were found better in terms of impact resistance than the fabrics with wide gaps. It is thought that this is because of the tight structure of the fabric with narrow gaps. On the other hand, the increase in wire diameter causes a decrease in the contact force. Additionally, all 0.3 mm nitinol wire-reinforced fabrics with narrow or wide gaps, have higher deformation values besides the lower contact force results than 0.2 mm nitinol wire-reinforced fabrics. It shows the low impact resistance of fabrics reinforced with nitinol wires in 0.3 mm diameter, and this result is compatible with the DMA data.
When a general assessment is done for the fabric impact test results, the impact resistance of 0.2 mm wire-reinforced fabrics with narrow gaps was found better than both nitinol and steel wires. In other words, contact force values of all 0.2 mm wire-reinforced fabrics with narrow gaps were found higher, while deformation values were lower than fabrics with wide gaps. Regression analysis results support the experimental data. ANOVA results of obtained regression models that forecast the contact force are F(4,19) = 9.758, p < 0.001 for the first; F(3,19) = 13.819, p < 0.001 for the second and F(2,19) = 19.628, p < 0.001 for the third regression model. Table 18 presents the statistical data of the contact force.
Statistical data of regression models forecasting contact force of fabrics.
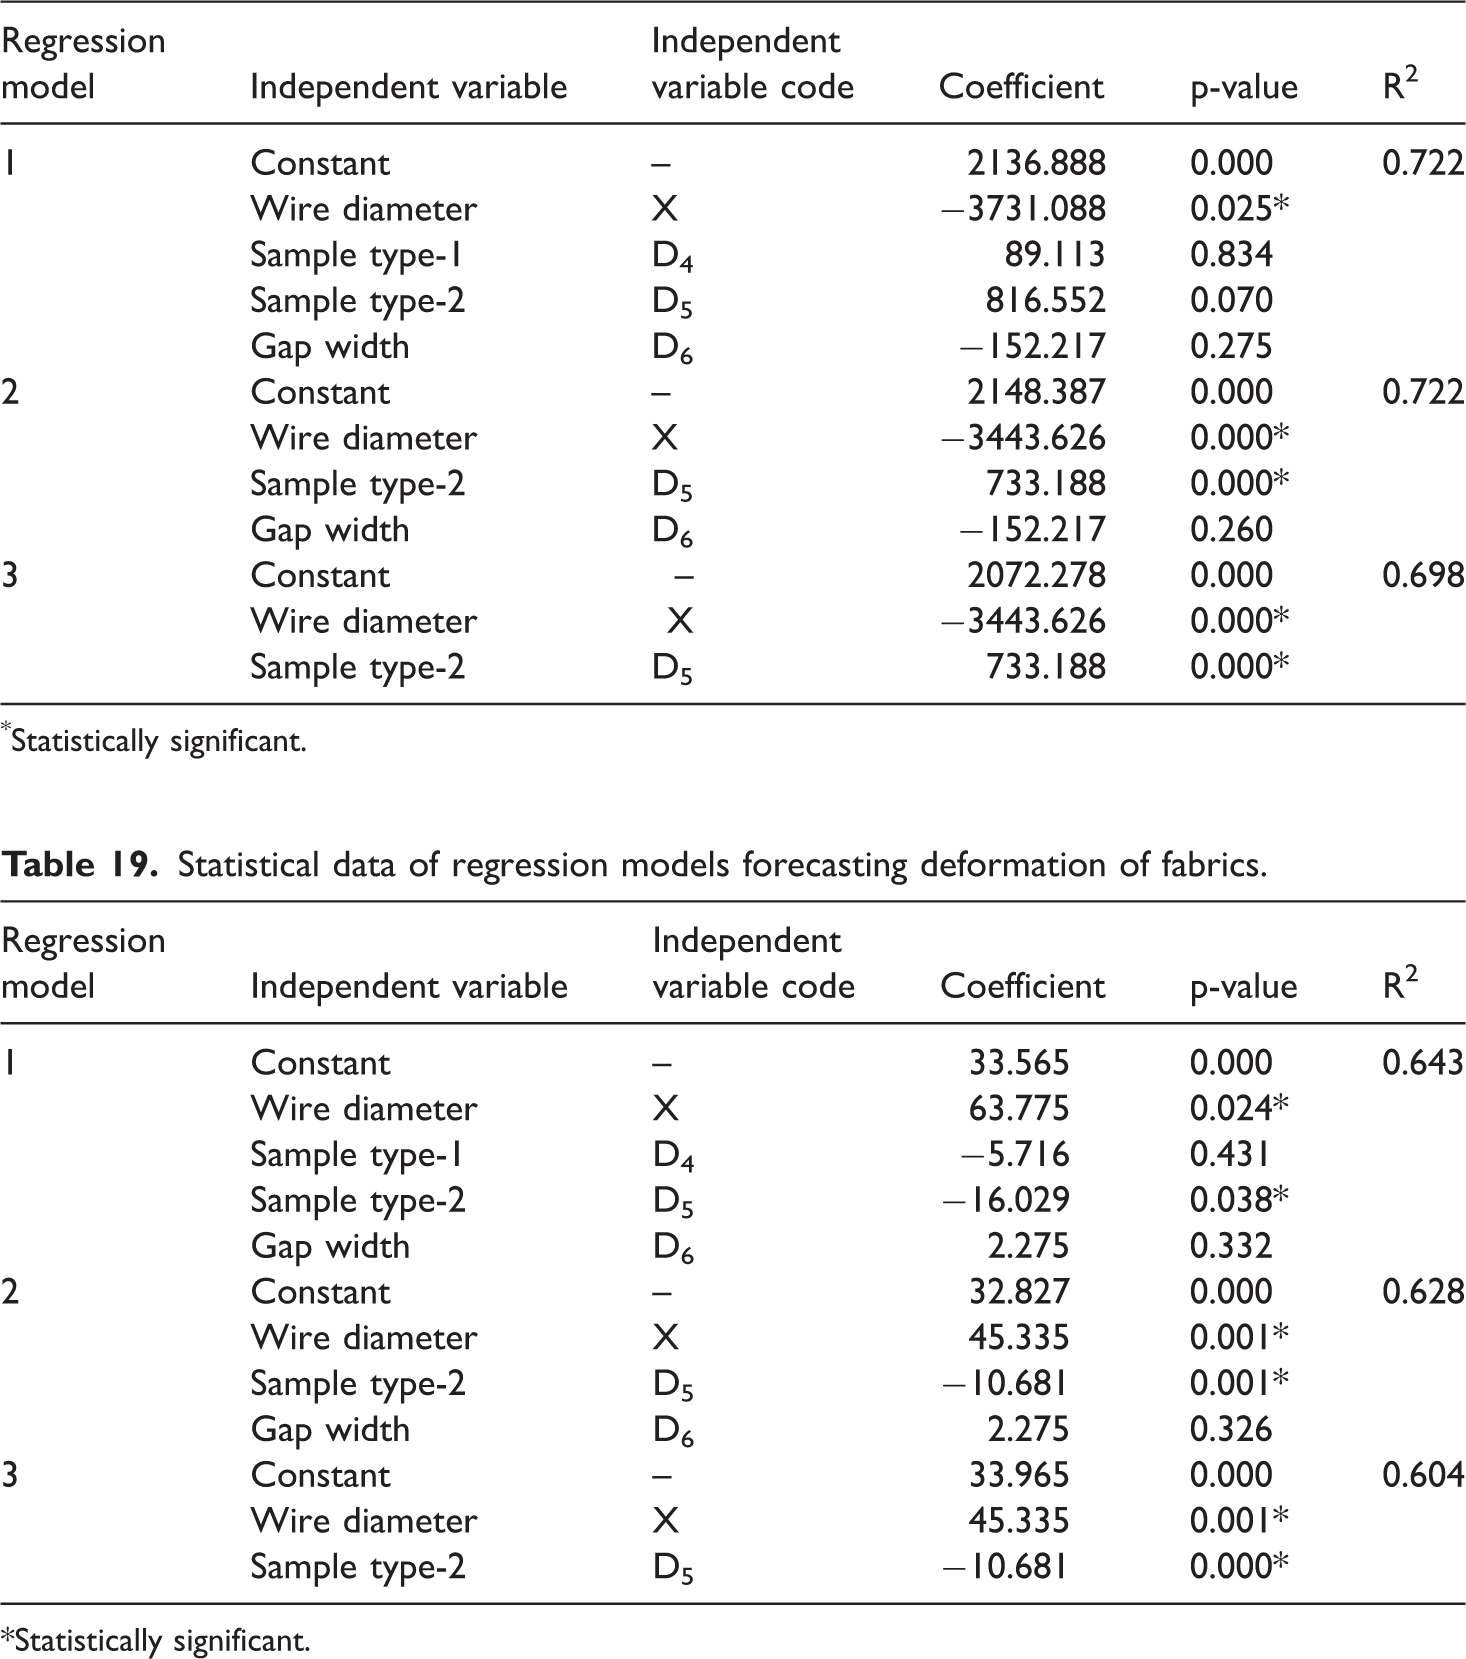
Statistically significant.
According to Table 18, wire diameter and sample type-2 were found statistically significant. The regression equation obtained after removing the insignificant variables is given below
The regression equation shows that the contact force of the fabric significantly decreases when the wire diameter increases. The use of steel wire in the fabric construction causes a significant increment in contact force compared to the reference sample.
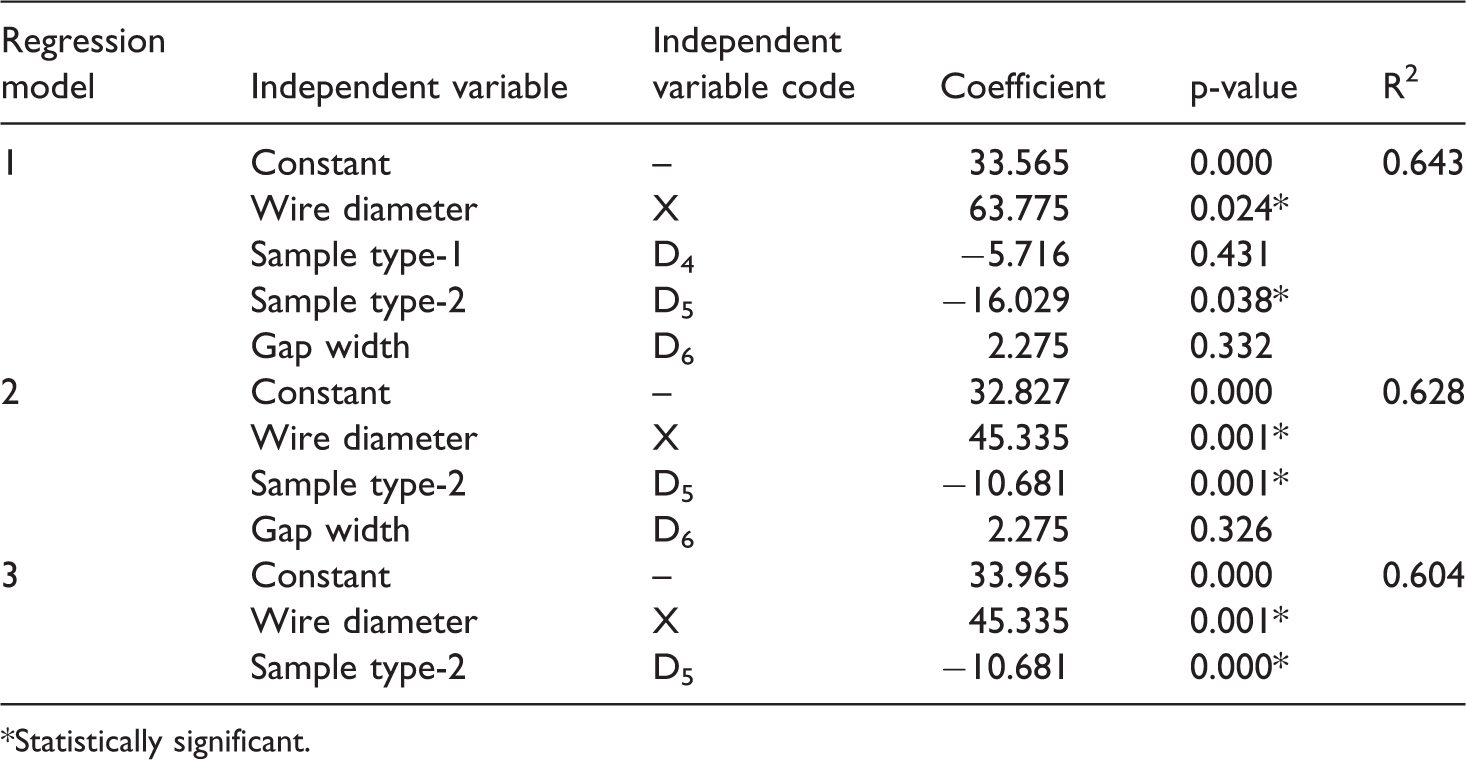
ANOVA results that were obtained by regression analysis on deformation data shows that all models are statistically significant. The results are F(4,19) = 6.757, p = 0.003 for the first, F(3,19) = 8.985, p = 0.001 for the second and F(2,19) = 12.943, p < 0.001 for the third regression model. Table 19 shows the data of regression analysis on deformation values.
Statistical data of regression models forecasting deformation of fabrics.
*Statistically significant.
According to Table 19, wire diameter and sample type-2 were found statistically significant. The regression equation obtained after removing the insignificant variables is given below
The regression equation shows that the thickness of wire diameter and the usage of steel wire in the fabric construction significantly affect fabric deformation. Deformation increases when the wire diameter increases. Fabrics with steel wire have lower deformation values when compared to the reference fabrics. On the other hand, the energy absorption values of fabrics were also evaluated after the impact test statistically. ANOVA results show that two of the three models are statistically significant. However, the R2 values of the models are low. The results are F(4,19) = 2.635, p = 0.076 for the first, F(3,19) = 3.461, p = 0.041 for the second and F(2,19) = 5.352, p = 0.016 for the third regression model. Table 20 shows the data of regression analysis on energy absorption values.
Statistical data of regression models forecasting the energy absorption of fabrics.

*Statistically significant.
According to Table 20, only the gap width parameter was found statistically significant. Although the sample type-1 parameter entered the model, it was not found statistically significant. The latest regression equation obtained with the backward method is given below
The regression equation shows that the usage of sample type-1 causes a decrease in energy absorption. It clarifies why nitinol wire-reinforced fabrics have lower energy absorption values when compared to reference fabrics. On the other hand, according to the equation, wide gap choice significantly decreases the energy absorption. This result supports the experimental data of the energy absorption values of fabrics with narrow gaps are higher than the fabrics with wide gaps.
Conclusions
In this study, nitinol and steel wires were used as core material, and carbon fiber was used as sheath materials to produce hybrid yarns. Additionally, three-plied twisted carbon fiber yarns were produced, which were used as warp and weft yarns. An innovative technique was developed to weave carbon fiber yarns on a conventional automated sample loom; hybrid and twisted carbon fiber yarns were wrapped with water-soluble PVA yarn, which prevents the carbon fiber damage during the weaving process. After fabric production, PVA on fabrics was removed by dipping in a hot water bath before other processes.
Nitinol wires were purchased in cold-worked condition to process them efficiently during weaving, and to gain shape memory in the desired form after integration into the fabric structure. Heat treatments were exposed to nitinol wires at various temperatures, and according to DSC results, the optimum temperature was determined. Mechanical properties of heat-treated nitinol wires, which change due to temperature, were examined with DMA. DMA results prove that nitinol wires exhibit transformation between austenite and martensite phases, namely gain shape memory property. Additionally, tensile tests applied on wires and hybrid yarns clarify that the tensile strength of heat-treated nitinol wires and hybrid yarns decreases, while strain values increase prominently. On the other hand, the tensile strength of hybrid yarns is higher than wires; also, nitinol was found better than steel both as a wire and hybrid yarn.
Mechanical tests such as tensile, pull-out, and impact were applied to wire-reinforced and reference 3D woven fabrics. All nitinol reinforced fabrics were exposed to heat treatment before the mechanical tests. Data obtained from all tests show that nitinol reinforced fabrics have lower mechanical properties than steel wire-reinforced fabrics. It is because applying heat treatments on nitinol wires in fabric form, which causes a decrease in the tensile strength of carbon fiber. For this reason, it is suggested to use annealed nitinol wire, which is in the austenitic phase at room temperature, as a wire reinforcement for further studies. Thereby, there will not be a need for applying heat treatments on nitinol wire-reinforced fabrics, and different types of high performance fibers such as glass fiber or aramid could be used instead of carbon fiber. However, in the case of annealed nitinol wire preferred, it is thought that weaving of the wire as a warp yarn will probably be more difficult because of a high recovery tendency to its original shape. In this case, using nitinol wires as weft yarns is a second suggestion to integrate the wire into the fabric structure. Moreover, nitinol wire can also be used with hand lay-up before composite production.
In the study's scope, it was encountered with several problems due to different tension values of hybrid and twisted carbon fiber yarns, which were released from the same beam during the weaving process. In the direction of gained experience, it is suggested to integrate wire core hybrid yarns into fabric structure as warp yarns by releasing them from a second beam for both two wire types. Thus, problems during weaving production will be reduced and eliminated.
This study is a comprehensive base of a further study in which it is planned to examine the impact resistance of textile composites that will be produced by using the determined optimum fabric parameters. Study outputs supported by statistical analysis determine that steel wire core hybrid yarns can be used for improving the mechanical properties of fabrics, thin wires become integrated with the fabric structure much better and thus are damaged less during the weaving process. On the other hand, better results were obtained from fabrics with narrow gaps due to their tight structure is another obtained result. It is thought that the 3D hollow woven fabric produced with optimum parameters could be used in textile composites that are used as personal protective equipment such as helmets, knee and elbow protectors, or automotive structures.
Footnotes
Acknowledgement
Authors thank ScotCad Textiles Ltd. from Scotland, UK, for their valuable support for creating 3D cross-sectional views of the produced 3D fabrics using ScotWeave software.
Declaration of conflicting interests
The author(s) declared no potential conflicts of interest with respect to the research, authorship, and/or publication of this article.
Funding
The author(s) disclosed receipt of the following financial support for the research, authorship, and/or publication of this article: This study was financially supported by TUBITAK 217M173 project.